Changes in PRIMAP-hist v2.6.1_final compared to v2.6_final for Macao
2025-03-19
Johannes Gütschow
Change analysis for Macao for PRIMAP-hist v2.6.1_final compared to v2.6_final
Overview over emissions by sector and gas
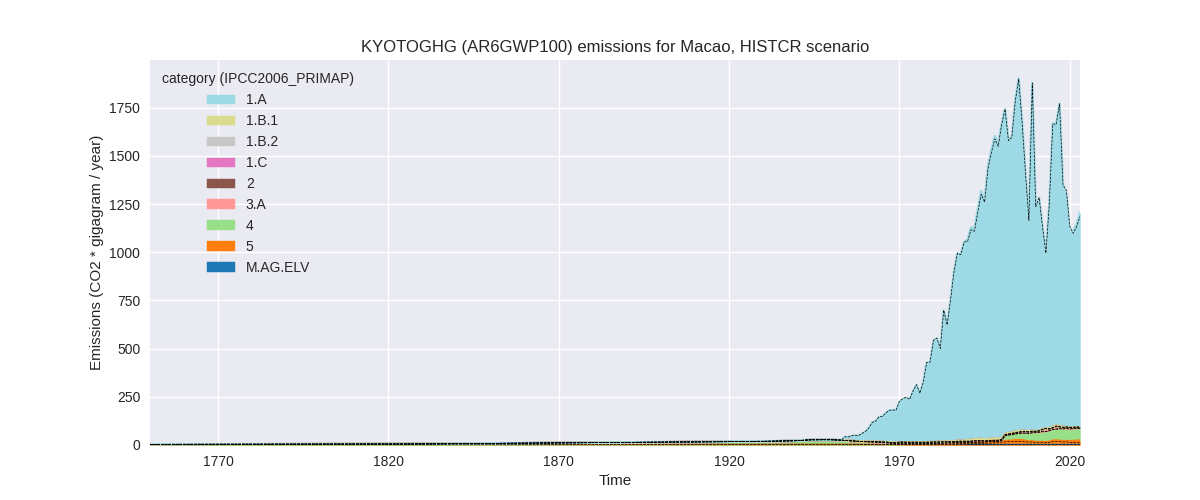
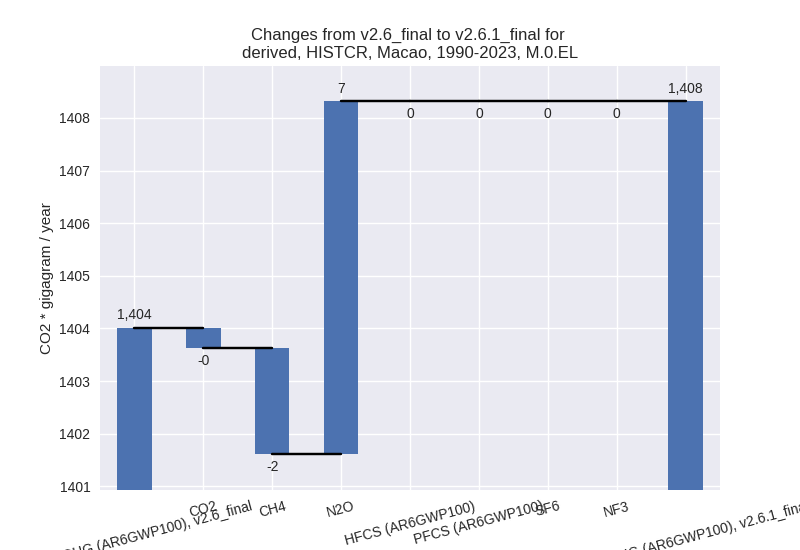
The following figures show the aggregate national total emissions excluding LULUCF AR6GWP100 for the country reported priority scenario. The dotted linesshow the v2.6_final data.

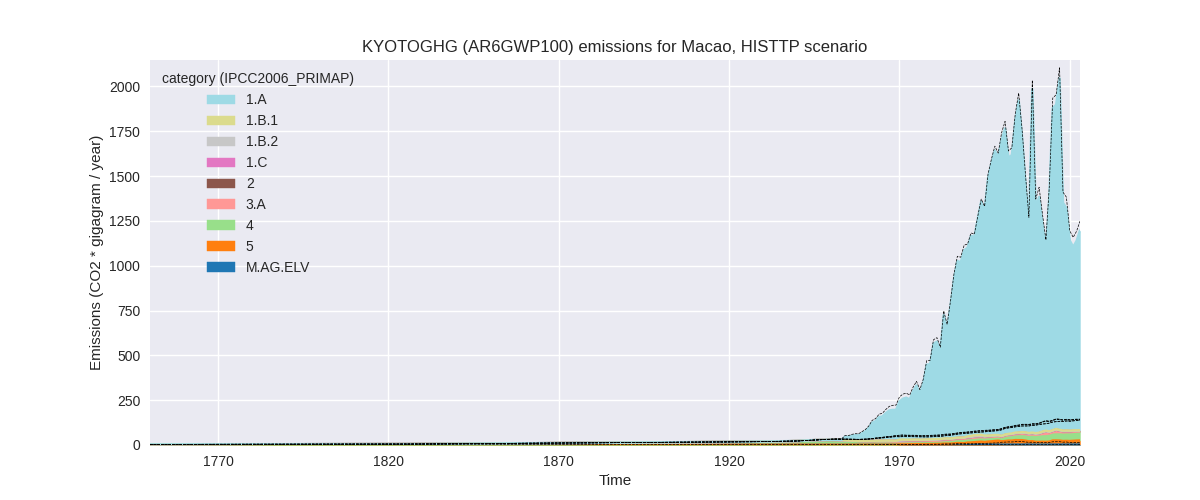
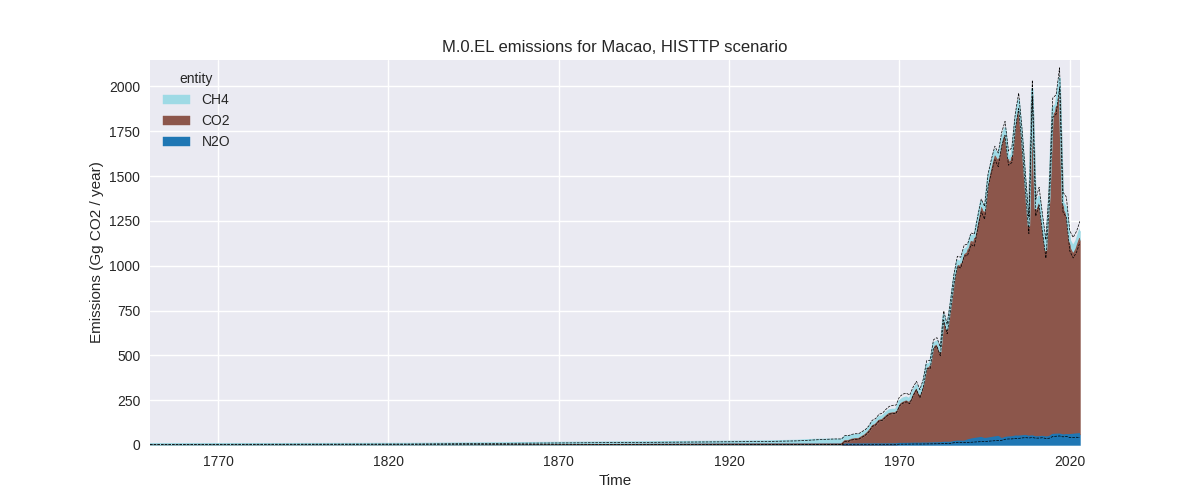
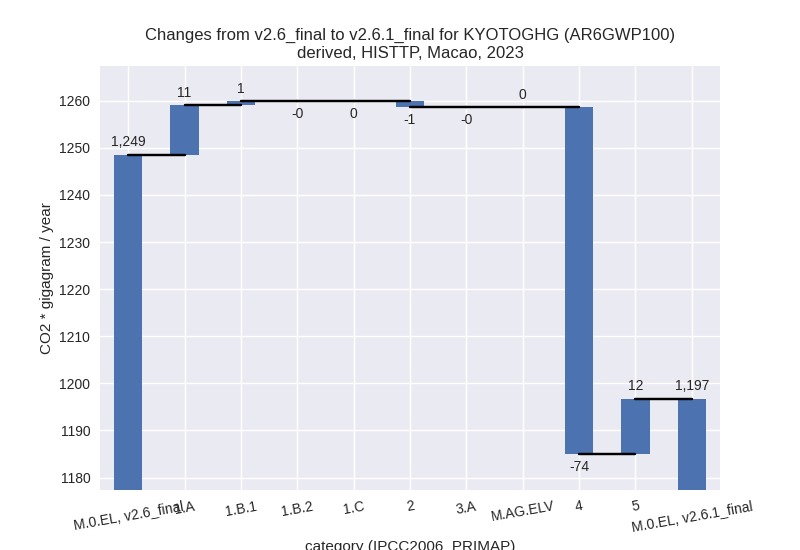
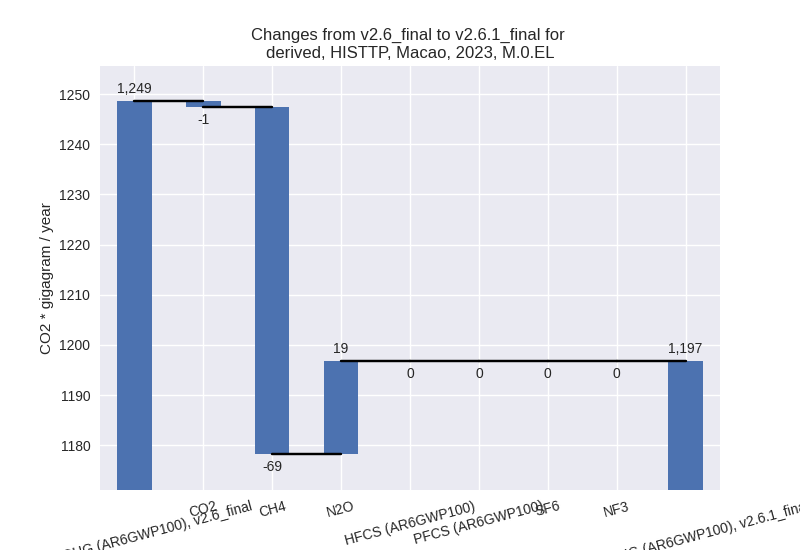
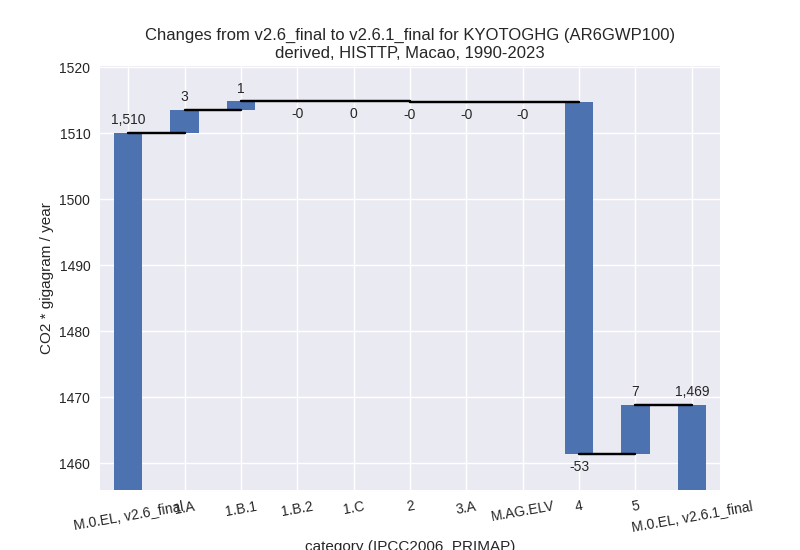
The following figures show the aggregate national total emissions excluding LULUCF AR6GWP100 for the third party priority scenario. The dotted linesshow the v2.6_final data.
Overview over changes
In the country reported priority scenario we have the following changes for aggregate Kyoto GHG and national total emissions excluding LULUCF (M.0.EL):
- Emissions in 2023 have changed by 1.5%% (18.37 Gg CO2 / year)
- Emissions in 1990-2023 have changed by 0.3%% (4.30 Gg CO2 / year)
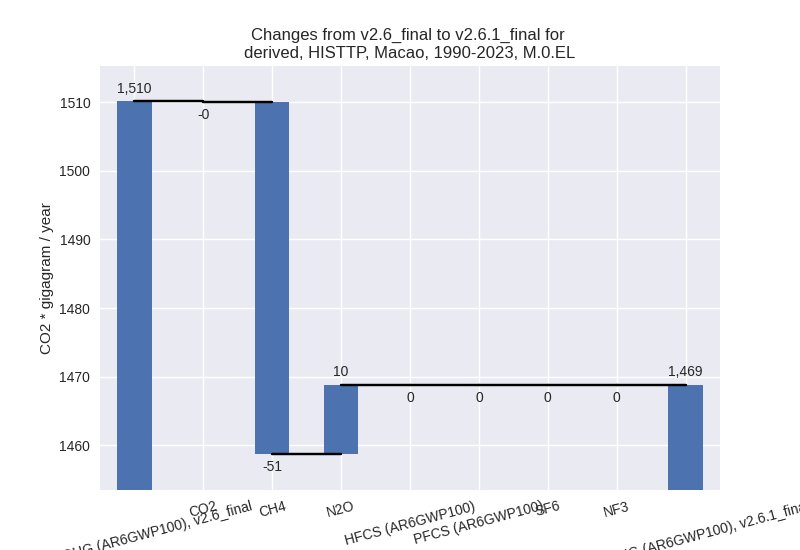
In the third party priority scenario we have the following changes for aggregate Kyoto GHG and national total emissions excluding LULUCF (M.0.EL):
- Emissions in 2023 have changed by -4.1%% (-51.78 Gg CO2 / year)
- Emissions in 1990-2023 have changed by -2.7%% (-41.29 Gg CO2 / year)
Most important changes per scenario and time frame
In the country reported priority scenario the following sector-gas combinations have the highest absolute impact on national total KyotoGHG (AR6GWP100) emissions in 2023 (top 5):
- 1: 1.A, CO2 with 11.84 Gg CO2 / year (1.1%)
- 2: 5, N2O with 11.83 Gg CO2 / year (109.6%)
- 3: 1.A, N2O with 8.45 Gg CO2 / year (53.6%)
- 4: 4, N2O with -8.17 Gg CO2 / year (-13.7%)
- 5: M.AG.ELV, N2O with -2.47 Gg CO2 / year (-100.0%)
In the country reported priority scenario the following sector-gas combinations have the highest absolute impact on national total KyotoGHG (AR6GWP100) emissions in 1990-2023 (top 5):
- 1: 5, N2O with 7.47 Gg CO2 / year (63.5%)
- 2: 1.A, N2O with 2.64 Gg CO2 / year (19.0%)
- 3: 1.B.1, CH4 with -2.27 Gg CO2 / year (-100.0%)
- 4: M.AG.ELV, N2O with -2.09 Gg CO2 / year (-100.0%)
- 5: 4, N2O with -0.93 Gg CO2 / year (-3.2%)
In the third party priority scenario the following sector-gas combinations have the highest absolute impact on national total KyotoGHG (AR6GWP100) emissions in 2023 (top 5):
- 1: 4, CH4 with -72.47 Gg CO2 / year (-66.0%)
- 2: 5, N2O with 11.83 Gg CO2 / year (109.6%)
- 3: 1.A, N2O with 7.95 Gg CO2 / year (55.3%)
- 4: 1.A, CH4 with 2.57 Gg CO2 / year (52.3%)
- 5: 4, N2O with -1.24 Gg CO2 / year (-9.6%)
In the third party priority scenario the following sector-gas combinations have the highest absolute impact on national total KyotoGHG (AR6GWP100) emissions in 1990-2023 (top 5):
- 1: 4, CH4 with -53.28 Gg CO2 / year (-65.0%)
- 2: 5, N2O with 7.47 Gg CO2 / year (63.5%)
- 3: 1.A, N2O with 2.78 Gg CO2 / year (21.0%)
- 4: 1.B.1, CH4 with 1.25 Gg CO2 / year (54.9%)
- 5: 1.A, CH4 with 0.70 Gg CO2 / year (12.7%)
Notes on data changes
Here we list notes explaining important emissions changes for the country.
- CRT data from BTR1 for 2005, 2020, and 2021 has been included. It replaces BUR3 data for 2005 and extends BUR3 for 2020-2021. Other sources used are BUR3 for 2018 and NC4 for 2017.
- The new data leads to changes in the post 2018. In sector 5 the change is directly from EDGAR data as there is no country reported data for the sector.
- In the TP scenario the changes are for similar sectors with the addition of a high reduction of waste CH4 emissions from EDGAR data.
Changes by sector and gas
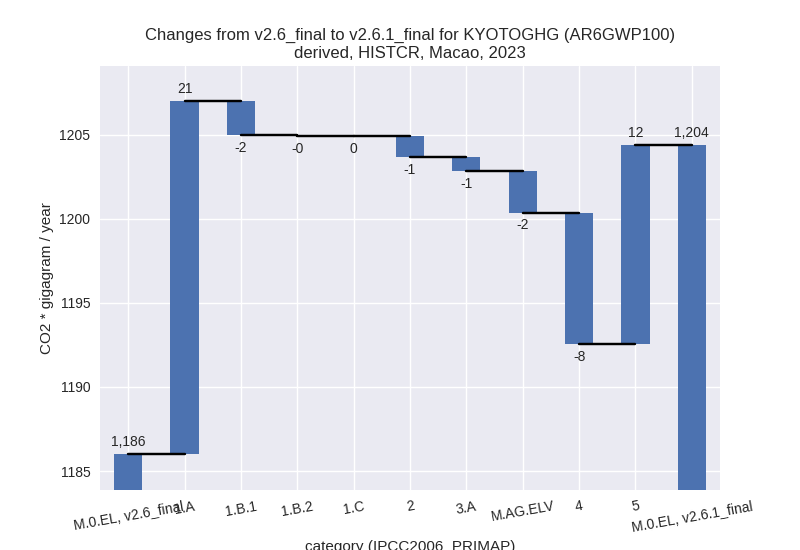
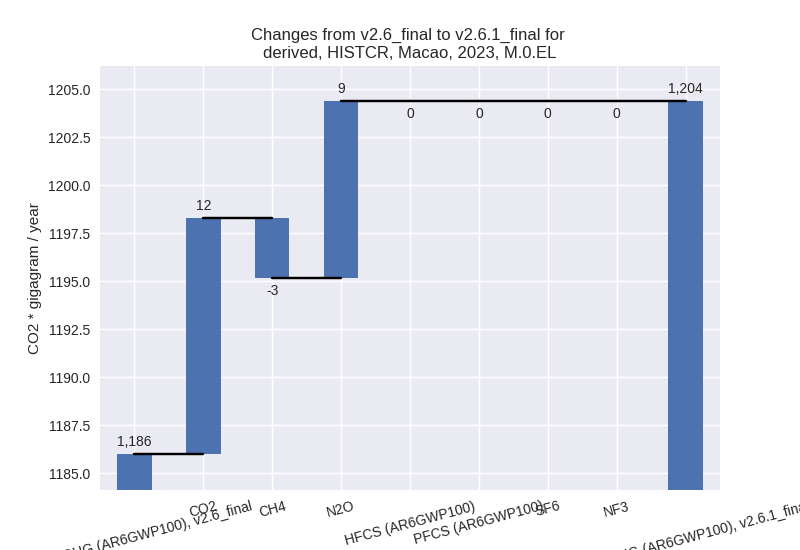
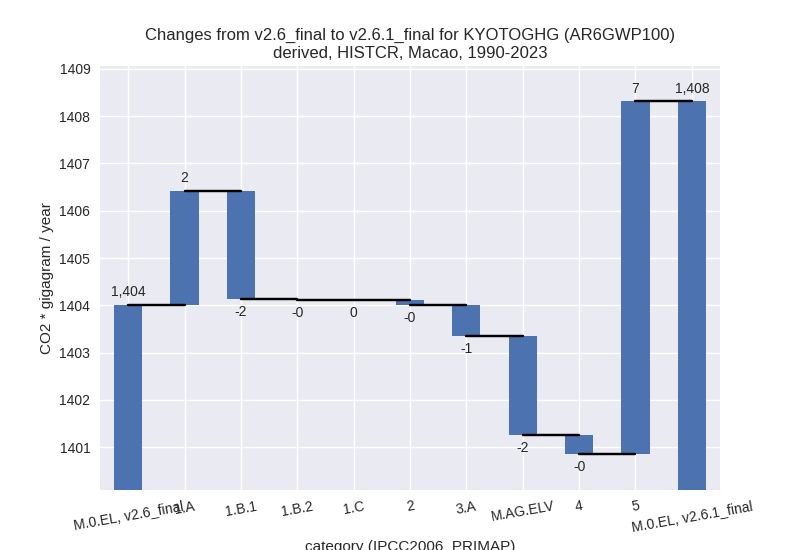
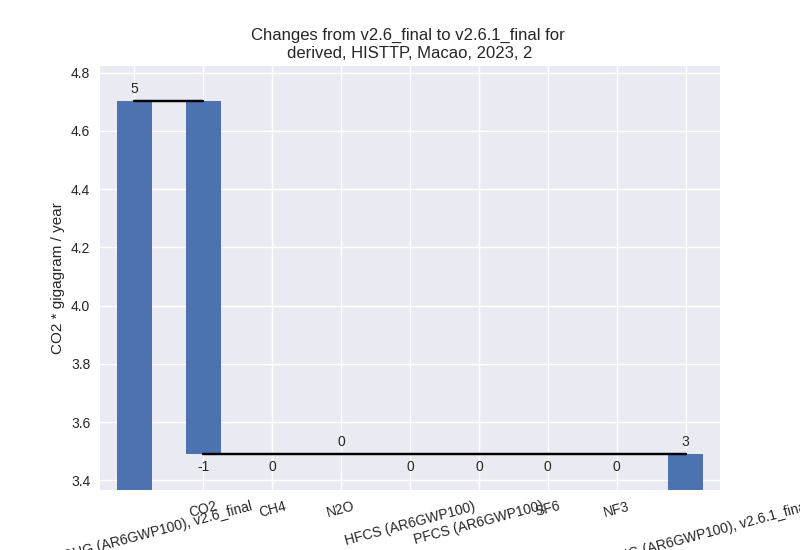
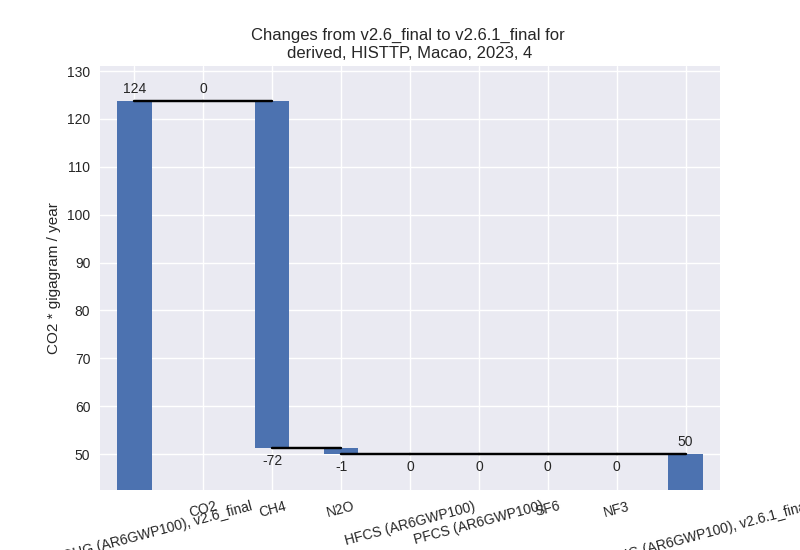
For each scenario and time frame the changes are displayed for all individual sectors and all individual gases. In the sector plot we use aggregate Kyoto GHGs in AR6GWP100. In the gas plot we usenational total emissions without LULUCF.
country reported scenario
2023
1990-2023
third party scenario
2023
1990-2023
Detailed changes for the scenarios:
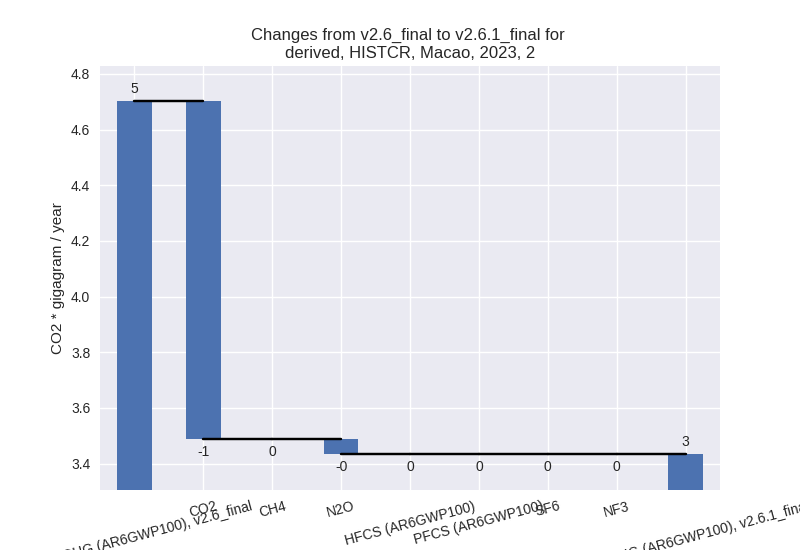
country reported scenario (HISTCR):
Most important changes per time frame
For 2023 the following sector-gas combinations have the highest absolute impact on national total KyotoGHG (AR6GWP100) emissions in 2023 (top 5):
- 1: 1.A, CO2 with 11.84 Gg CO2 / year (1.1%)
- 2: 5, N2O with 11.83 Gg CO2 / year (109.6%)
- 3: 1.A, N2O with 8.45 Gg CO2 / year (53.6%)
- 4: 4, N2O with -8.17 Gg CO2 / year (-13.7%)
- 5: M.AG.ELV, N2O with -2.47 Gg CO2 / year (-100.0%)
For 1990-2023 the following sector-gas combinations have the highest absolute impact on national total KyotoGHG (AR6GWP100) emissions in 1990-2023 (top 5):
- 1: 5, N2O with 7.47 Gg CO2 / year (63.5%)
- 2: 1.A, N2O with 2.64 Gg CO2 / year (19.0%)
- 3: 1.B.1, CH4 with -2.27 Gg CO2 / year (-100.0%)
- 4: M.AG.ELV, N2O with -2.09 Gg CO2 / year (-100.0%)
- 5: 4, N2O with -0.93 Gg CO2 / year (-3.2%)
Changes in the main sectors for aggregate KyotoGHG (AR6GWP100) are
- 1: Total sectoral emissions in 2022 are 1054.75 Gg CO2 / year which is 92.0% of M.0.EL emissions. 2023 Emissions have changed by 1.7% (18.92 Gg CO2 / year). 1990-2023 Emissions have changed by 0.0% (0.10 Gg CO2 / year).
- 2: Total sectoral emissions in 2022 are 4.38 Gg CO2
/ year which is 0.4% of M.0.EL emissions. 2023 Emissions have changed by
-27.0% (-1.27 Gg CO2 / year).
1990-2023 Emissions have changed by -1.6% (-0.11 Gg CO2 / year). For 2023 the
changes per gas
are:
- M.AG: Total sectoral emissions in 2022 are 0.00 Gg
CO2 / year which is 0.0% of M.0.EL emissions. 2023 Emissions have
changed by -100.0% (-3.28 Gg CO2 /
year). 1990-2023 Emissions have changed by -100.0% (-2.75 Gg CO2 / year). For 2023
the changes per gas
are:

For 1990-2023 the changes per gas are: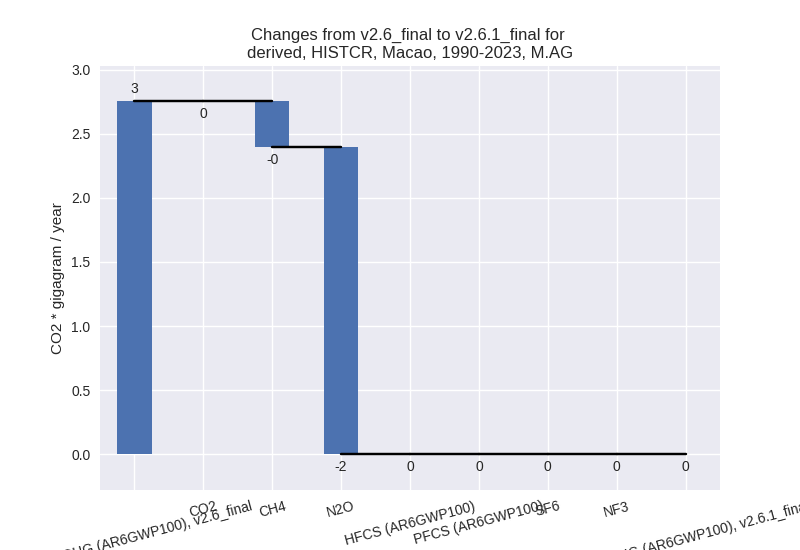
The changes come from the following subsectors:- 3.A: Total sectoral emissions in 2022 are 0.00 Gg
CO2 / year which is nan% of category M.AG emissions. 2023 Emissions have
changed by -100.0% (-0.81 Gg CO2 /
year). 1990-2023 Emissions have changed by -100.0% (-0.66 Gg CO2 / year). For 2023
the changes per gas
are:
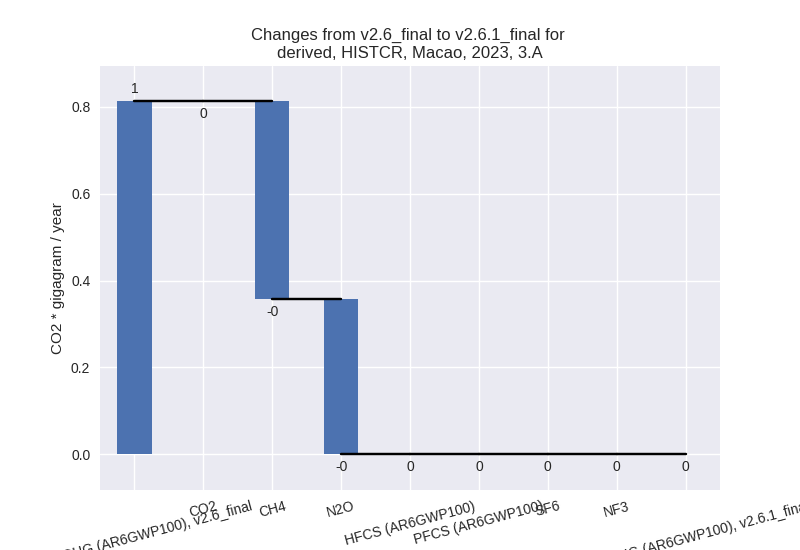
For 1990-2023 the changes per gas are: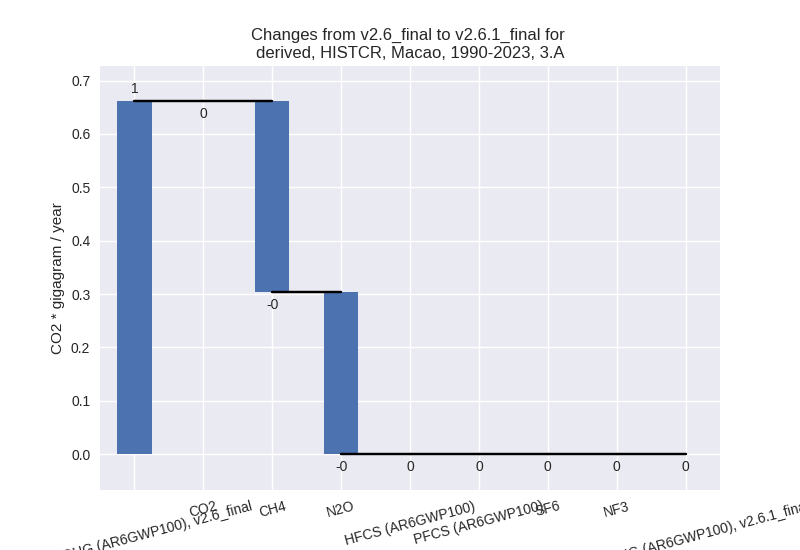
There is no subsector information available in PRIMAP-hist. - M.AG.ELV: Total sectoral emissions in 2022 are 0.00
Gg CO2 / year which is nan% of category M.AG emissions. 2023 Emissions
have changed by -100.0% (-2.47 Gg
CO2 / year). 1990-2023 Emissions have changed by -100.0% (-2.09 Gg CO2 / year). For 2023
the changes per gas
are:
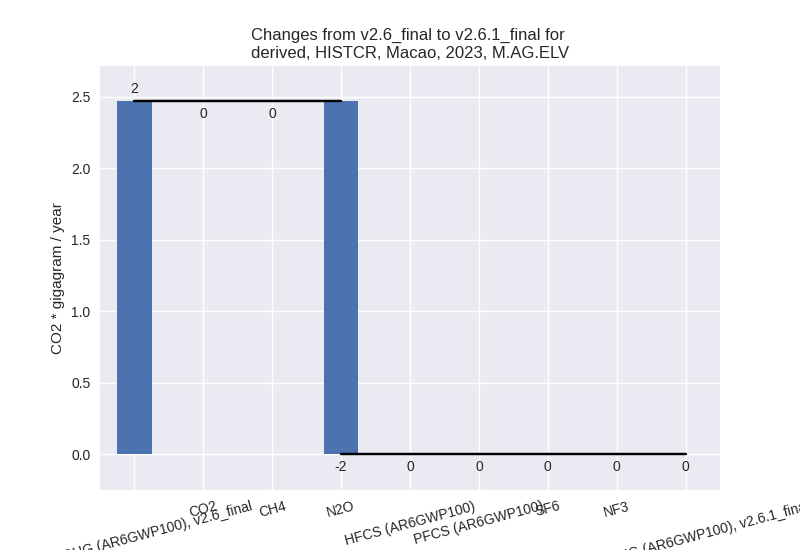
For 1990-2023 the changes per gas are: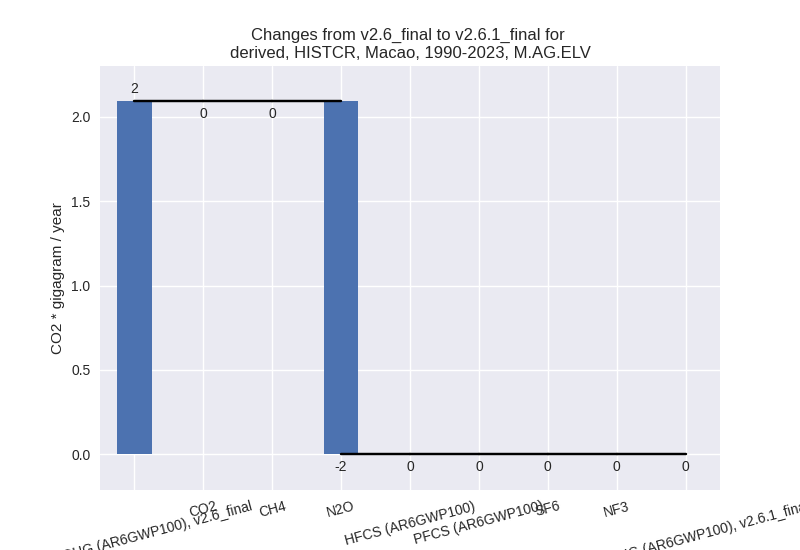
There is no subsector information available in PRIMAP-hist.
- 3.A: Total sectoral emissions in 2022 are 0.00 Gg
CO2 / year which is nan% of category M.AG emissions. 2023 Emissions have
changed by -100.0% (-0.81 Gg CO2 /
year). 1990-2023 Emissions have changed by -100.0% (-0.66 Gg CO2 / year). For 2023
the changes per gas
are:
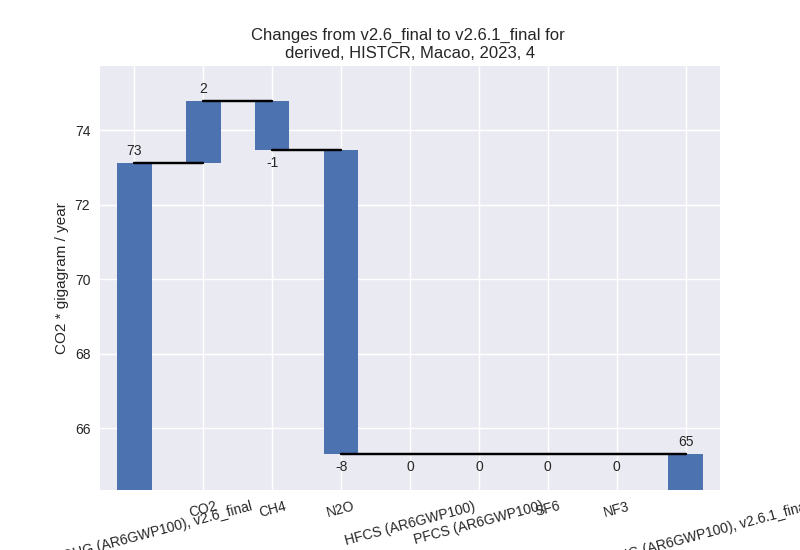
- 4: Total sectoral emissions in 2022 are 64.87 Gg
CO2 / year which is 5.7% of M.0.EL emissions. 2023 Emissions have
changed by -10.7% (-7.82 Gg CO2 /
year). 1990-2023 Emissions have changed by -1.0% (-0.40 Gg CO2 / year). For 2023 the
changes per gas
are:
- 5: Total sectoral emissions in 2022 are 22.08 Gg
CO2 / year which is 1.9% of M.0.EL emissions. 2023 Emissions have
changed by 109.6% (11.83 Gg CO2 /
year). 1990-2023 Emissions have changed by 63.5% (7.47 Gg CO2 / year). For 2023 the
changes per gas
are:

For 1990-2023 the changes per gas are: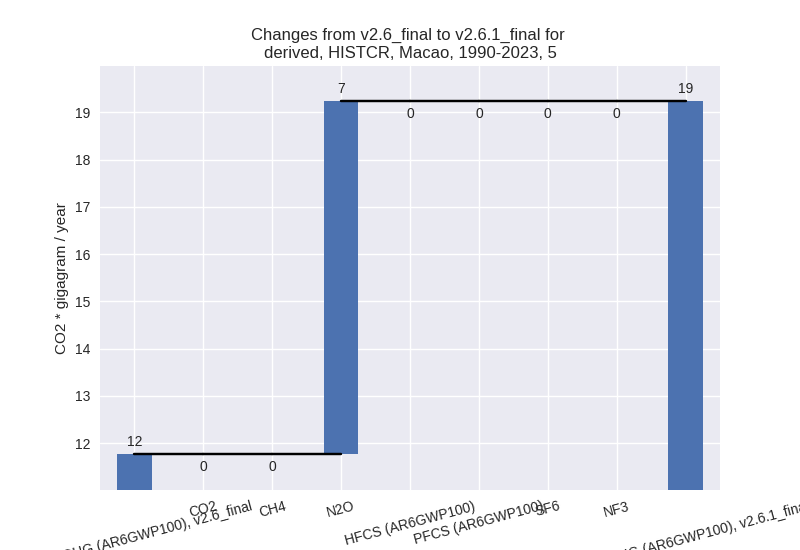
third party scenario (HISTTP):
Most important changes per time frame
For 2023 the following sector-gas combinations have the highest absolute impact on national total KyotoGHG (AR6GWP100) emissions in 2023 (top 5):
- 1: 4, CH4 with -72.47 Gg CO2 / year (-66.0%)
- 2: 5, N2O with 11.83 Gg CO2 / year (109.6%)
- 3: 1.A, N2O with 7.95 Gg CO2 / year (55.3%)
- 4: 1.A, CH4 with 2.57 Gg CO2 / year (52.3%)
- 5: 4, N2O with -1.24 Gg CO2 / year (-9.6%)
For 1990-2023 the following sector-gas combinations have the highest absolute impact on national total KyotoGHG (AR6GWP100) emissions in 1990-2023 (top 5):
- 1: 4, CH4 with -53.28 Gg CO2 / year (-65.0%)
- 2: 5, N2O with 7.47 Gg CO2 / year (63.5%)
- 3: 1.A, N2O with 2.78 Gg CO2 / year (21.0%)
- 4: 1.B.1, CH4 with 1.25 Gg CO2 / year (54.9%)
- 5: 1.A, CH4 with 0.70 Gg CO2 / year (12.7%)
Changes in the main sectors for aggregate KyotoGHG (AR6GWP100) are
- 1: Total sectoral emissions in 2022 are 1058.98 Gg CO2 / year which is 93.0% of M.0.EL emissions. 2023 Emissions have changed by 1.0% (11.30 Gg CO2 / year). 1990-2023 Emissions have changed by 0.3% (4.75 Gg CO2 / year).
- 2: Total sectoral emissions in 2022 are 4.43 Gg CO2
/ year which is 0.4% of M.0.EL emissions. 2023 Emissions have changed by
-25.8% (-1.21 Gg CO2 / year).
1990-2023 Emissions have changed by -1.0% (-0.06 Gg CO2 / year). For 2023 the
changes per gas
are:
- M.AG: Total sectoral emissions in 2022 are 3.26 Gg CO2 / year which is 0.3% of M.0.EL emissions. 2023 Emissions have changed by 0.2% (0.01 Gg CO2 / year). 1990-2023 Emissions have changed by -1.4% (-0.04 Gg CO2 / year).
- 4: Total sectoral emissions in 2022 are 49.47 Gg
CO2 / year which is 4.3% of M.0.EL emissions. 2023 Emissions have
changed by -59.6% (-73.71 Gg CO2 /
year). 1990-2023 Emissions have changed by -59.9% (-53.40 Gg CO2 / year). For 2023
the changes per gas
are:
For 1990-2023 the changes per gas are:
- 5: Total sectoral emissions in 2022 are 22.08 Gg
CO2 / year which is 1.9% of M.0.EL emissions. 2023 Emissions have
changed by 109.6% (11.83 Gg CO2 /
year). 1990-2023 Emissions have changed by 63.5% (7.47 Gg CO2 / year). For 2023 the
changes per gas
are:

For 1990-2023 the changes per gas are: