Changes in PRIMAP-hist v2.6.1_final compared to v2.6_final for Monaco
2025-03-19
Johannes Gütschow
Change analysis for Monaco for PRIMAP-hist v2.6.1_final compared to v2.6_final
Overview over emissions by sector and gas
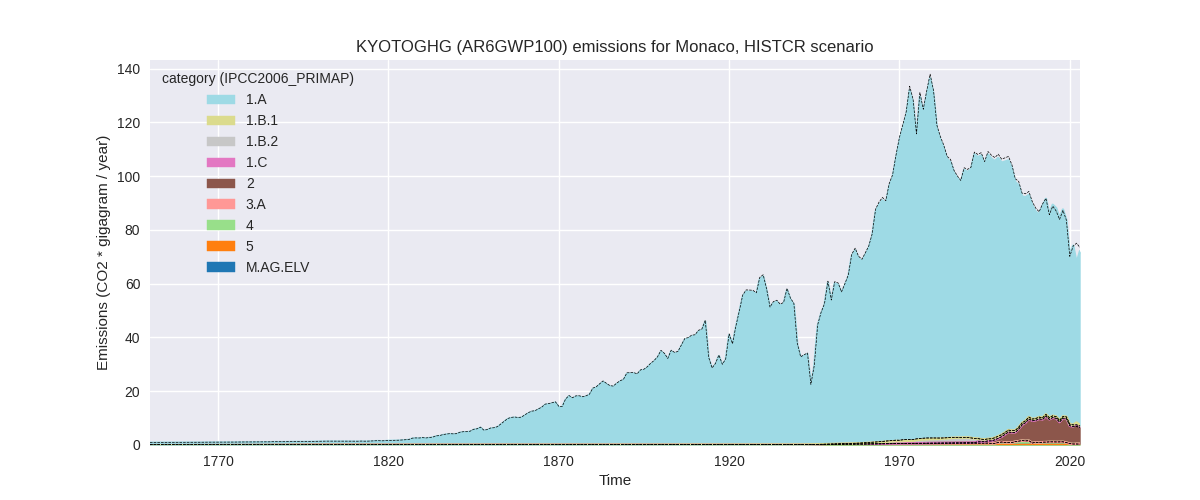
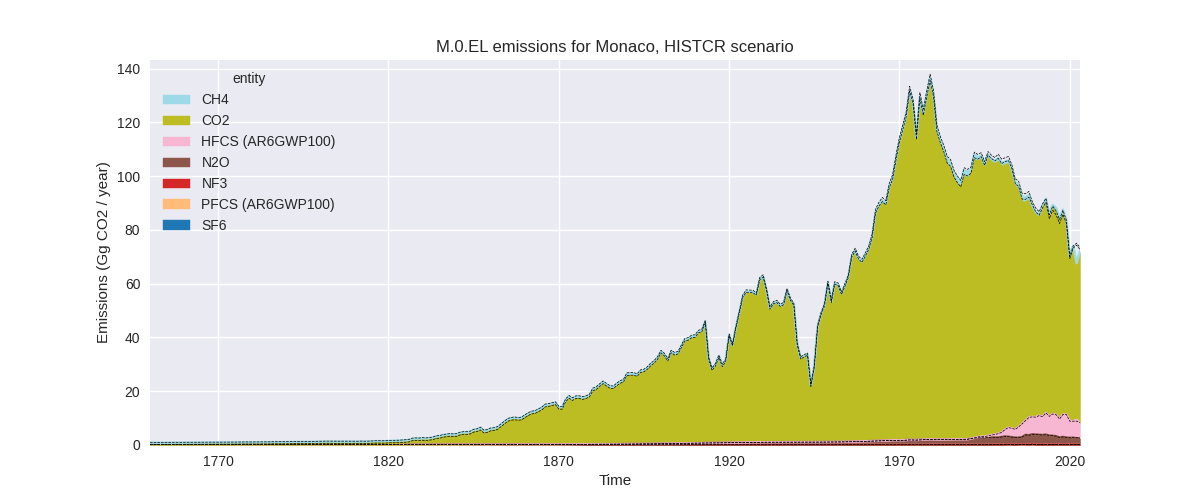
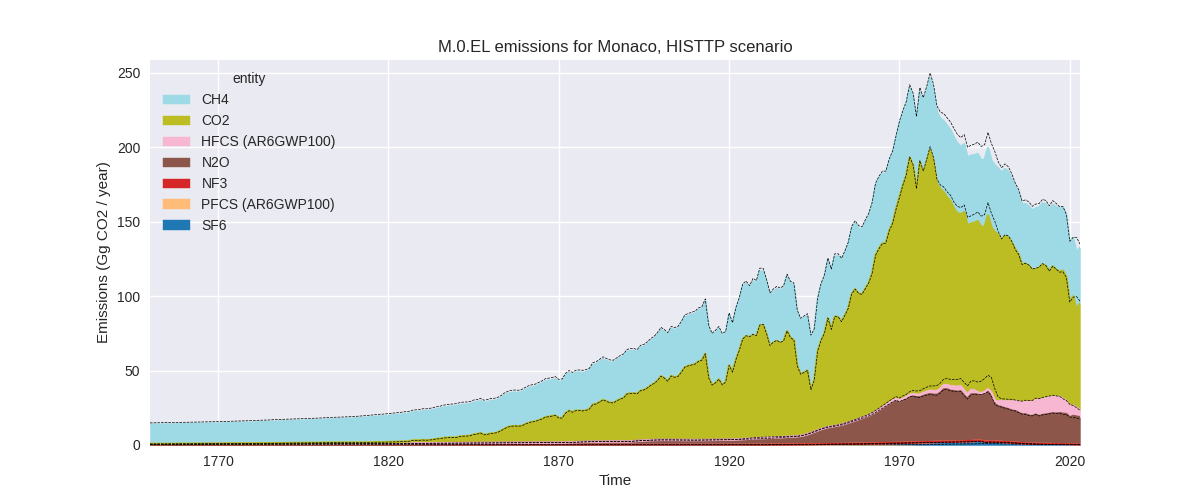
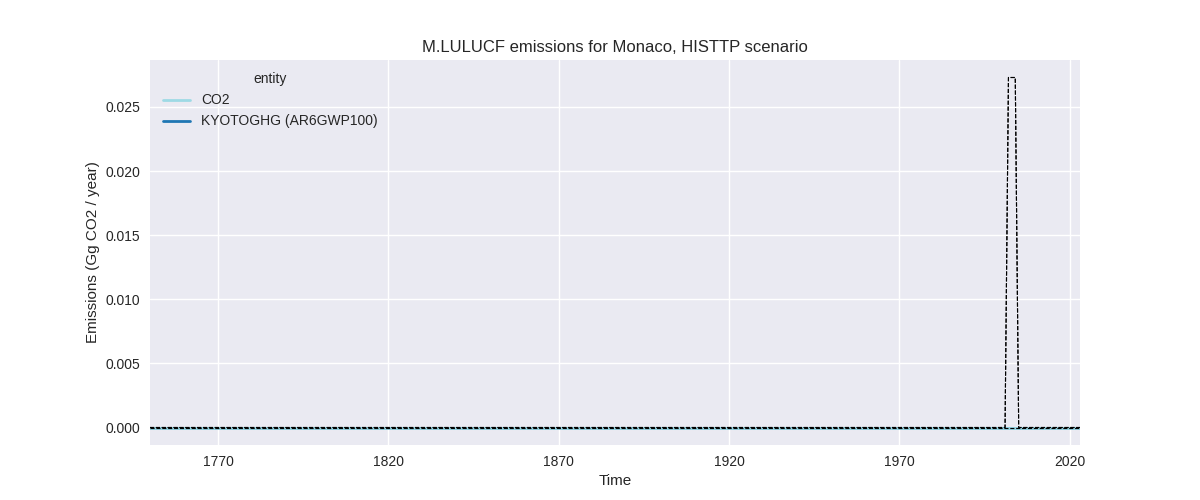
The following figures show the aggregate national total emissions excluding LULUCF AR6GWP100 for the country reported priority scenario. The dotted linesshow the v2.6_final data.
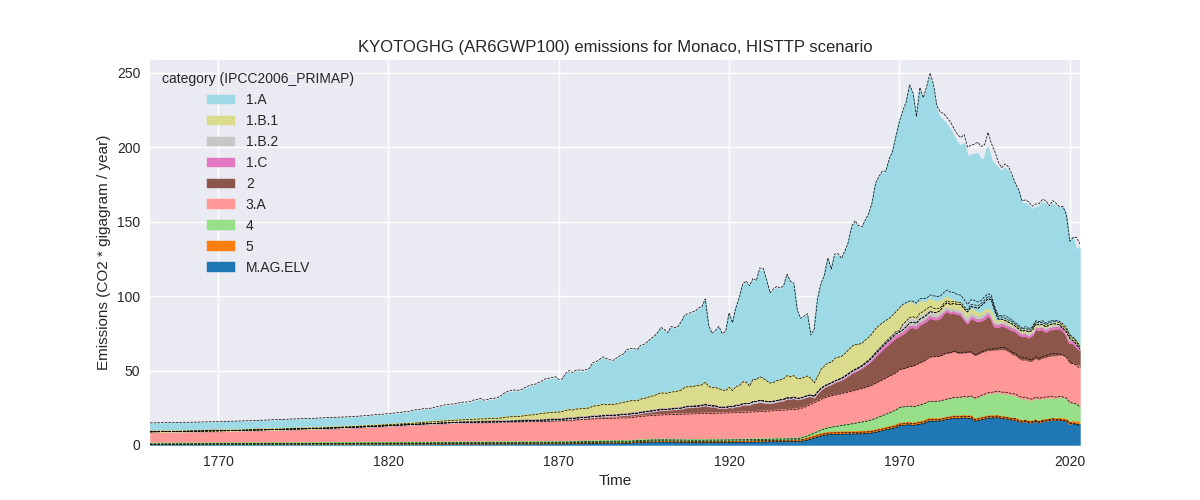
The following figures show the aggregate national total emissions excluding LULUCF AR6GWP100 for the third party priority scenario. The dotted linesshow the v2.6_final data.
Overview over changes
In the country reported priority scenario we have the following changes for aggregate Kyoto GHG and national total emissions excluding LULUCF (M.0.EL):
- Emissions in 2023 have changed by -1.8%% (-1.32 Gg CO2 / year)
- Emissions in 1990-2023 have changed by -1.1%% (-1.00 Gg CO2 / year)
In the third party priority scenario we have the following changes for aggregate Kyoto GHG and national total emissions excluding LULUCF (M.0.EL):
- Emissions in 2023 have changed by -1.8%% (-2.38 Gg CO2 / year)
- Emissions in 1990-2023 have changed by -2.6%% (-4.46 Gg CO2 / year)
Most important changes per scenario and time frame
In the country reported priority scenario the following sector-gas combinations have the highest absolute impact on national total KyotoGHG (AR6GWP100) emissions in 2023 (top 5):
- 1: 1.A, CO2 with -1.36 Gg CO2 / year (-2.1%)
- 2: 1.A, N2O with -0.25 Gg CO2 / year (-12.7%)
- 3: 2, HFCS (AR6GWP100) with 0.09 Gg CO2 / year (1.6%)
- 4: 4, N2O with 0.09 Gg CO2 / year (26.8%)
- 5: 4, CH4 with 0.07 Gg CO2 / year (inf%)
In the country reported priority scenario the following sector-gas combinations have the highest absolute impact on national total KyotoGHG (AR6GWP100) emissions in 1990-2023 (top 5):
- 1: 1.A, CO2 with -1.01 Gg CO2 / year (-1.2%)
- 2: 2, HFCS (AR6GWP100) with 0.02 Gg CO2 / year (0.6%)
- 3: 1.A, N2O with -0.02 Gg CO2 / year (-1.1%)
- 4: 4, N2O with 0.00 Gg CO2 / year (0.8%)
- 5: 4, CH4 with 0.00 Gg CO2 / year (0.8%)
In the third party priority scenario the following sector-gas combinations have the highest absolute impact on national total KyotoGHG (AR6GWP100) emissions in 2023 (top 5):
- 1: 1.A, CO2 with -2.58 Gg CO2 / year (-4.0%)
- 2: 4, CH4 with -1.31 Gg CO2 / year (-12.7%)
- 3: M.AG.ELV, N2O with 1.30 Gg CO2 / year (11.0%)
- 4: 2, HFCS (AR6GWP100) with -1.01 Gg CO2 / year (-16.9%)
- 5: 2, CO2 with -0.67 Gg CO2 / year (-11.9%)
In the third party priority scenario the following sector-gas combinations have the highest absolute impact on national total KyotoGHG (AR6GWP100) emissions in 1990-2023 (top 5):
- 1: 2, HFCS (AR6GWP100) with -2.82 Gg CO2 / year (-30.1%)
- 2: 4, CH4 with -1.85 Gg CO2 / year (-13.7%)
- 3: 1.B.2, CO2 with 0.62 Gg CO2 / year (1118.1%)
- 4: 1.A, CO2 with -0.36 Gg CO2 / year (-0.4%)
- 5: 3.A, CH4 with -0.25 Gg CO2 / year (-0.9%)
Notes on data changes
Here we list notes explaining important emissions changes for the country.
- CRT data from BTR1 has been included. Changes in the CR time-series are small and mostly come from the additional year in the country reported data (and are thus limited to 2022 and 2023).
- The TP time-series change in 1.A, CO2 comes from CRT data because
Monaco is not included in the EI data and thus CRT data is used to
extend CDIAC.
- Other TP scenario changes come from the updated EDGAR data. (Monaco is not included in the FAO data)
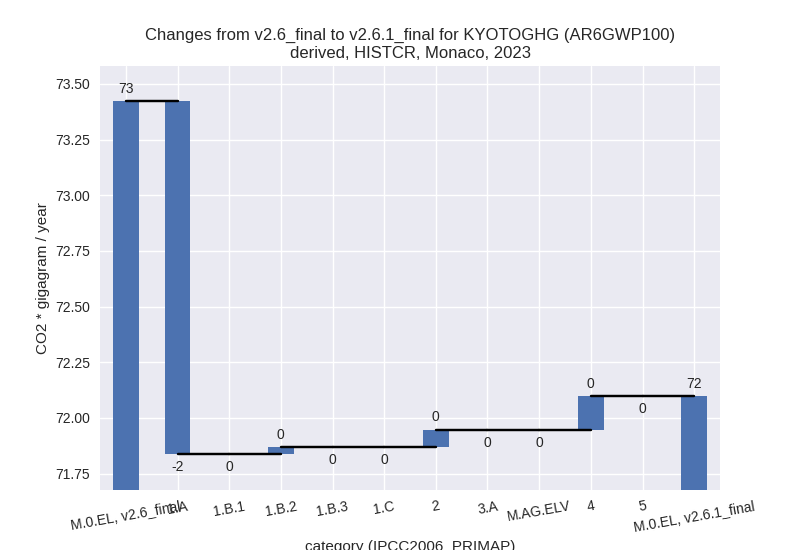
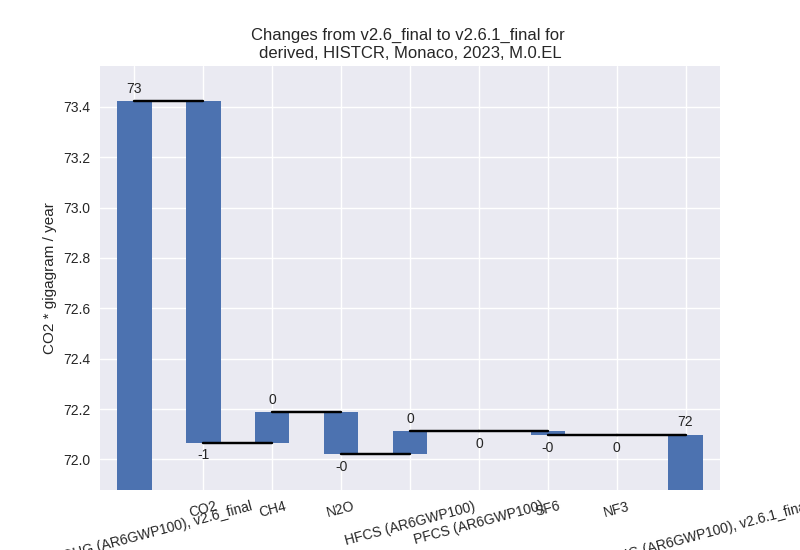
Changes by sector and gas
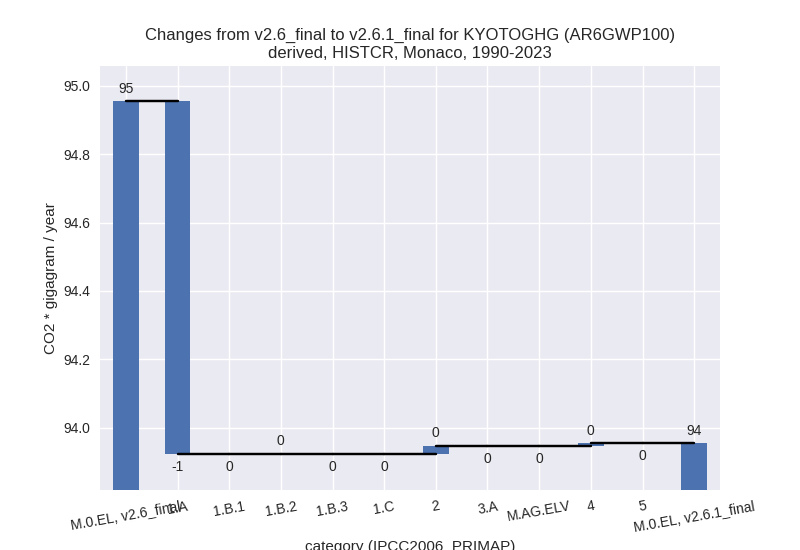
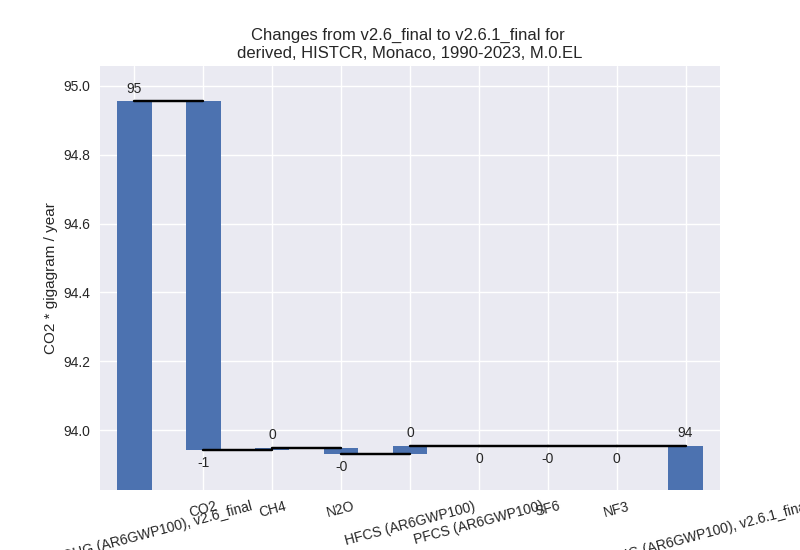
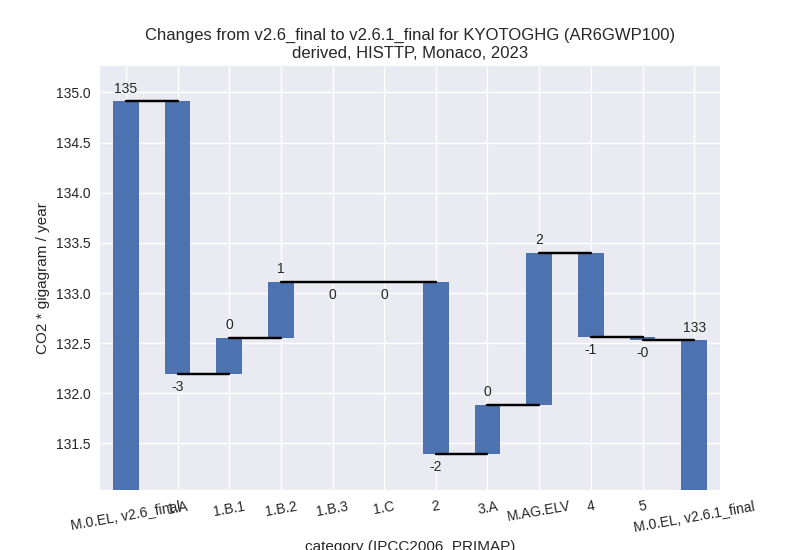
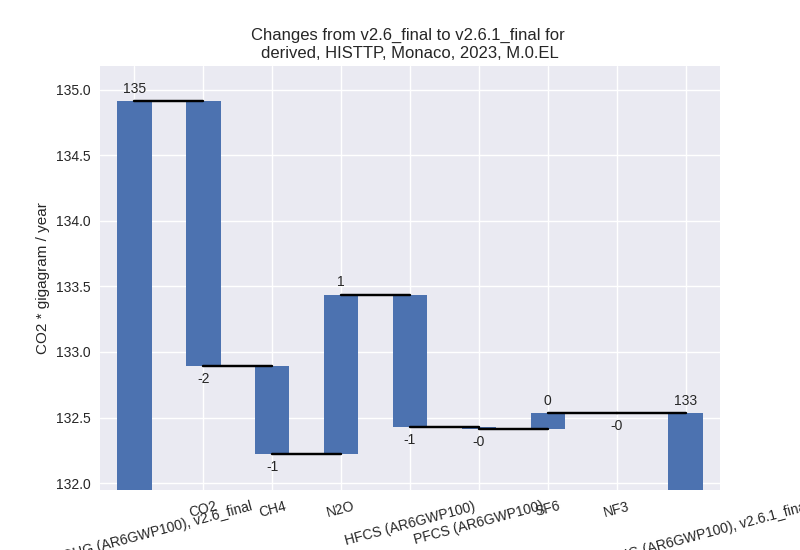
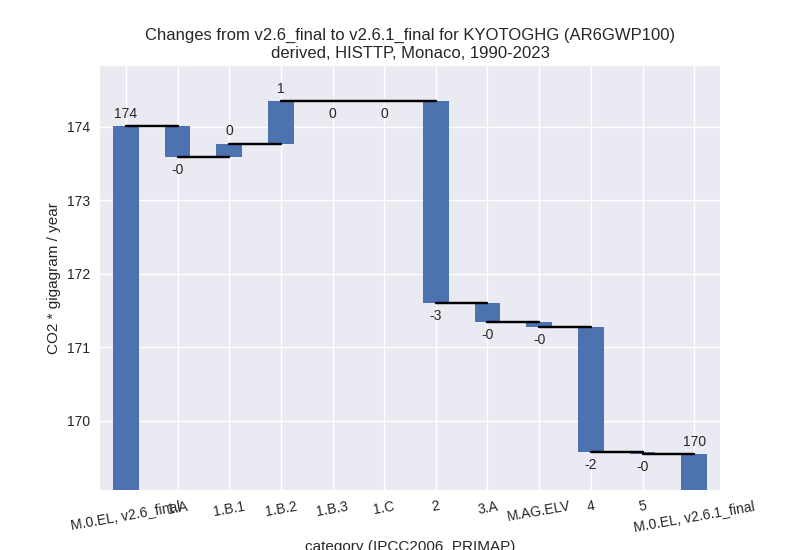
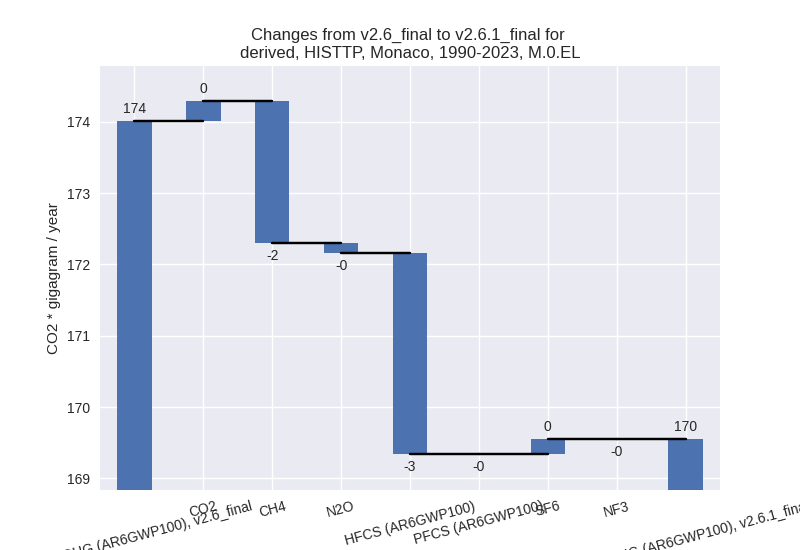
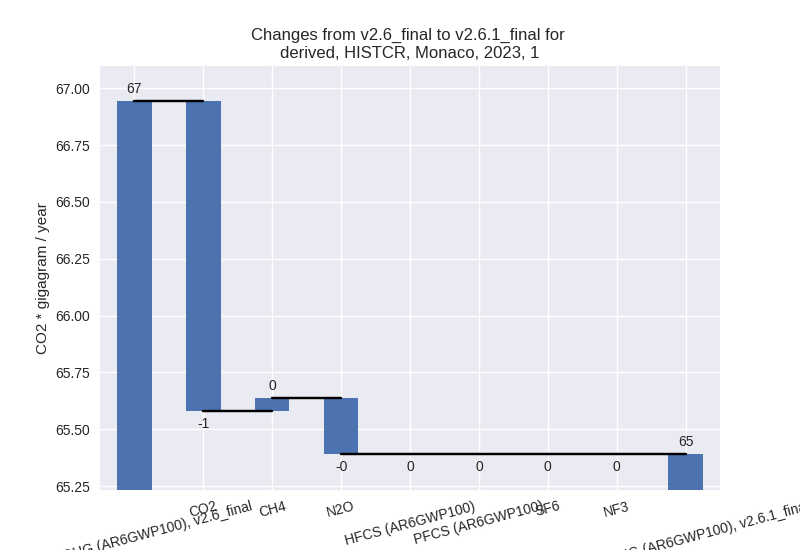
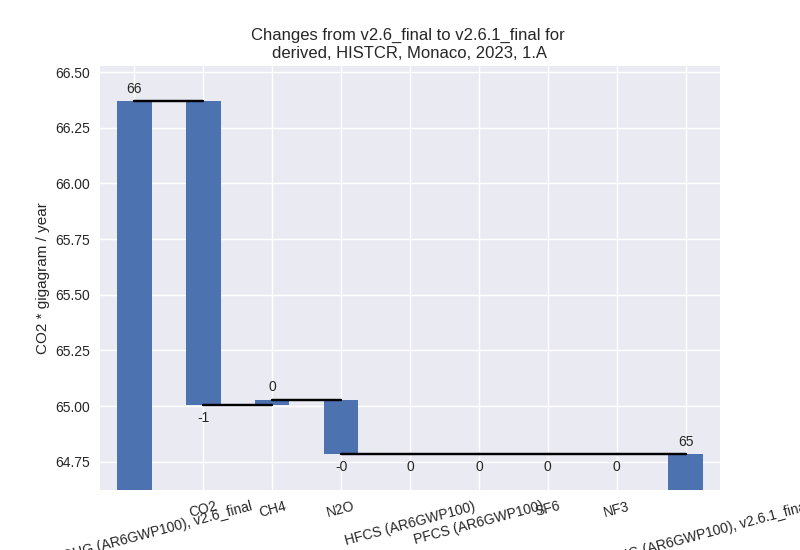
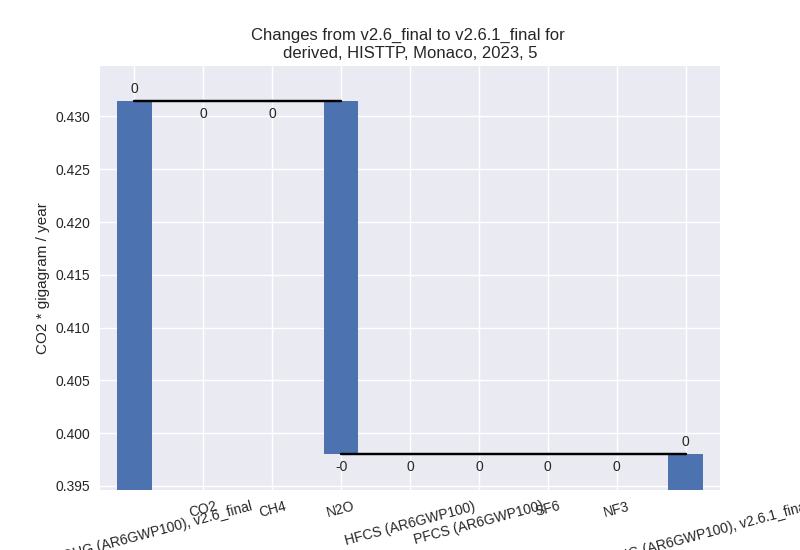
For each scenario and time frame the changes are displayed for all individual sectors and all individual gases. In the sector plot we use aggregate Kyoto GHGs in AR6GWP100. In the gas plot we usenational total emissions without LULUCF.
country reported scenario
2023
1990-2023
third party scenario
2023
1990-2023
Detailed changes for the scenarios:
country reported scenario (HISTCR):
Most important changes per time frame
For 2023 the following sector-gas combinations have the highest absolute impact on national total KyotoGHG (AR6GWP100) emissions in 2023 (top 5):
- 1: 1.A, CO2 with -1.36 Gg CO2 / year (-2.1%)
- 2: 1.A, N2O with -0.25 Gg CO2 / year (-12.7%)
- 3: 2, HFCS (AR6GWP100) with 0.09 Gg CO2 / year (1.6%)
- 4: 4, N2O with 0.09 Gg CO2 / year (26.8%)
- 5: 4, CH4 with 0.07 Gg CO2 / year (inf%)
For 1990-2023 the following sector-gas combinations have the highest absolute impact on national total KyotoGHG (AR6GWP100) emissions in 1990-2023 (top 5):
- 1: 1.A, CO2 with -1.01 Gg CO2 / year (-1.2%)
- 2: 2, HFCS (AR6GWP100) with 0.02 Gg CO2 / year (0.6%)
- 3: 1.A, N2O with -0.02 Gg CO2 / year (-1.1%)
- 4: 4, N2O with 0.00 Gg CO2 / year (0.8%)
- 5: 4, CH4 with 0.00 Gg CO2 / year (0.8%)
Changes in the main sectors for aggregate KyotoGHG (AR6GWP100) are
1: Total sectoral emissions in 2022 are 59.90 Gg CO2 / year which is 88.5% of M.0.EL emissions. 2023 Emissions have changed by -2.3% (-1.55 Gg CO2 / year). 1990-2023 Emissions have changed by -1.2% (-1.03 Gg CO2 / year). For 2023 the changes per gas are:
The changes come from the following subsectors:- 1.A: Total sectoral emissions in 2022 are 59.30 Gg
CO2 / year which is 99.0% of category 1 emissions. 2023 Emissions have
changed by -2.4% (-1.58 Gg CO2 /
year). 1990-2023 Emissions have changed by -1.2% (-1.03 Gg CO2 / year). For 2023 the
changes per gas
are:
There is no subsector information available in PRIMAP-hist. - 1.B.2: Total sectoral emissions in 2022 are 0.60 Gg
CO2 / year which is 1.0% of category 1 emissions. 2023 Emissions have
changed by 5.6% (0.03 Gg CO2 /
year). 1990-2023 Emissions have changed by 0.2% (0.00 Gg CO2 / year). For 2023 the
changes per gas
are:
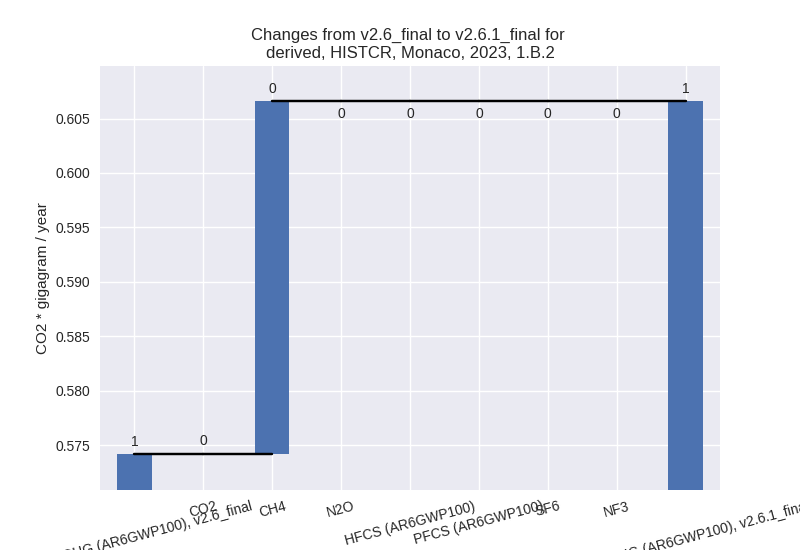
There is no subsector information available in PRIMAP-hist.
- 1.A: Total sectoral emissions in 2022 are 59.30 Gg
CO2 / year which is 99.0% of category 1 emissions. 2023 Emissions have
changed by -2.4% (-1.58 Gg CO2 /
year). 1990-2023 Emissions have changed by -1.2% (-1.03 Gg CO2 / year). For 2023 the
changes per gas
are:
2: Total sectoral emissions in 2022 are 7.28 Gg CO2 / year which is 10.8% of M.0.EL emissions. 2023 Emissions have changed by 1.3% (0.08 Gg CO2 / year). 1990-2023 Emissions have changed by 0.5% (0.02 Gg CO2 / year).
M.AG: No data
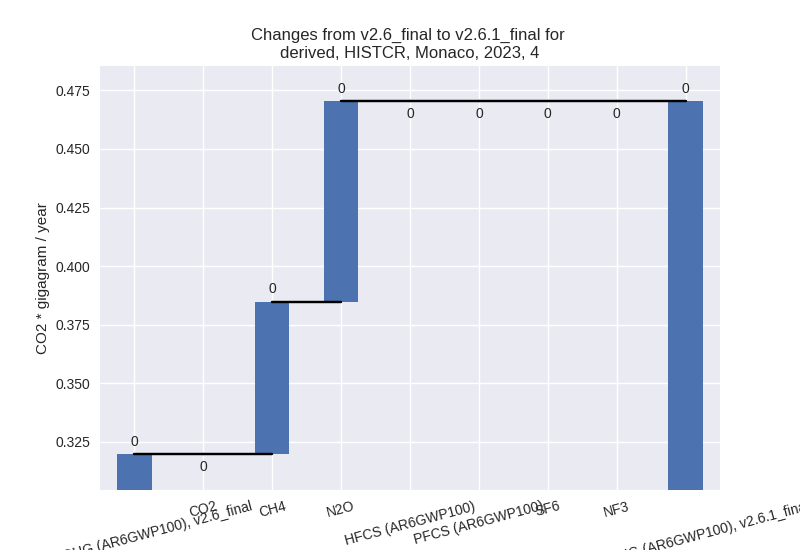
4: Total sectoral emissions in 2022 are 0.47 Gg CO2 / year which is 0.7% of M.0.EL emissions. 2023 Emissions have changed by 47.1% (0.15 Gg CO2 / year). 1990-2023 Emissions have changed by 0.8% (0.01 Gg CO2 / year). For 2023 the changes per gas are:
5: No data
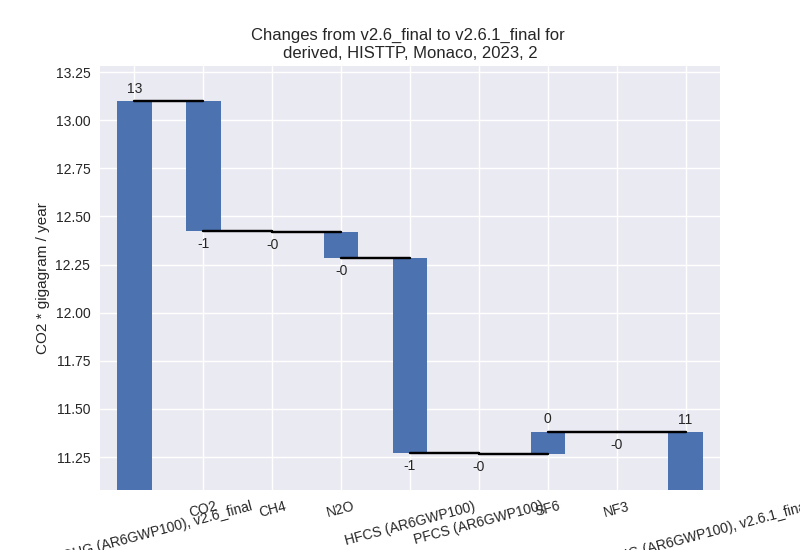
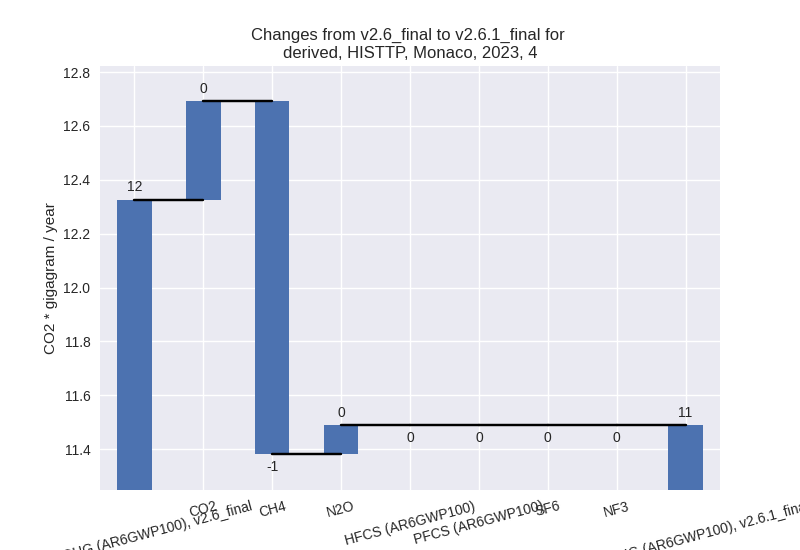
third party scenario (HISTTP):
Most important changes per time frame
For 2023 the following sector-gas combinations have the highest absolute impact on national total KyotoGHG (AR6GWP100) emissions in 2023 (top 5):
- 1: 1.A, CO2 with -2.58 Gg CO2 / year (-4.0%)
- 2: 4, CH4 with -1.31 Gg CO2 / year (-12.7%)
- 3: M.AG.ELV, N2O with 1.30 Gg CO2 / year (11.0%)
- 4: 2, HFCS (AR6GWP100) with -1.01 Gg CO2 / year (-16.9%)
- 5: 2, CO2 with -0.67 Gg CO2 / year (-11.9%)
For 1990-2023 the following sector-gas combinations have the highest absolute impact on national total KyotoGHG (AR6GWP100) emissions in 1990-2023 (top 5):
- 1: 2, HFCS (AR6GWP100) with -2.82 Gg CO2 / year (-30.1%)
- 2: 4, CH4 with -1.85 Gg CO2 / year (-13.7%)
- 3: 1.B.2, CO2 with 0.62 Gg CO2 / year (1118.1%)
- 4: 1.A, CO2 with -0.36 Gg CO2 / year (-0.4%)
- 5: 3.A, CH4 with -0.25 Gg CO2 / year (-0.9%)
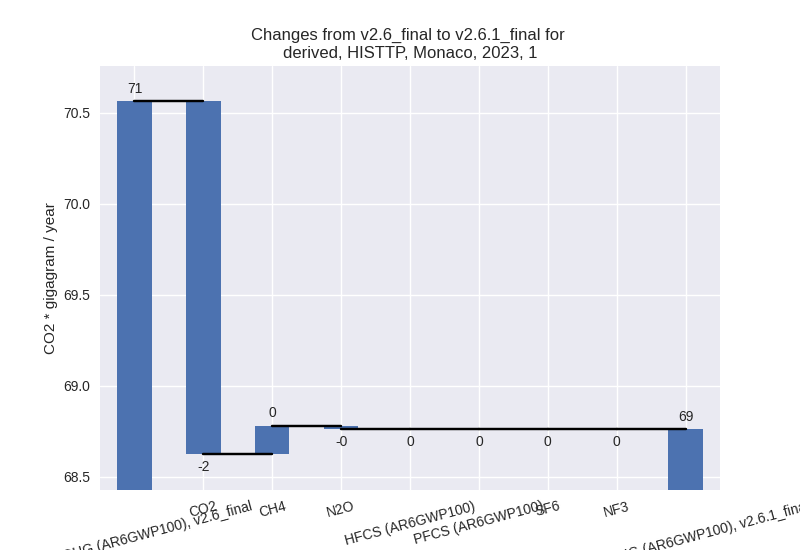
Changes in the main sectors for aggregate KyotoGHG (AR6GWP100) are
- 1: Total sectoral emissions in 2022 are 63.08 Gg
CO2 / year which is 48.9% of M.0.EL emissions. 2023 Emissions have
changed by -2.6% (-1.80 Gg CO2 /
year). 1990-2023 Emissions have changed by 0.4% (0.34 Gg CO2 / year). For 2023 the
changes per gas
are:
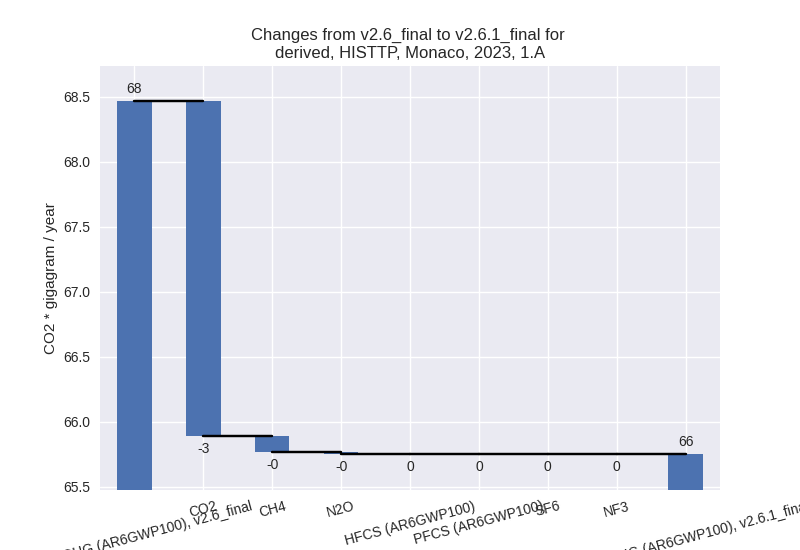
The changes come from the following subsectors:- 1.A: Total sectoral emissions in 2022 are 59.97 Gg
CO2 / year which is 95.1% of category 1 emissions. 2023 Emissions have
changed by -4.0% (-2.72 Gg CO2 /
year). 1990-2023 Emissions have changed by -0.5% (-0.41 Gg CO2 / year). For 2023 the
changes per gas
are:
There is no subsector information available in PRIMAP-hist. - 1.B.1: Total sectoral emissions in 2022 are 1.03 Gg
CO2 / year which is 1.6% of category 1 emissions. 2023 Emissions have
changed by 60.7% (0.36 Gg CO2 /
year). 1990-2023 Emissions have changed by 12.9% (0.18 Gg CO2 / year). For 2023 the
changes per gas
are:
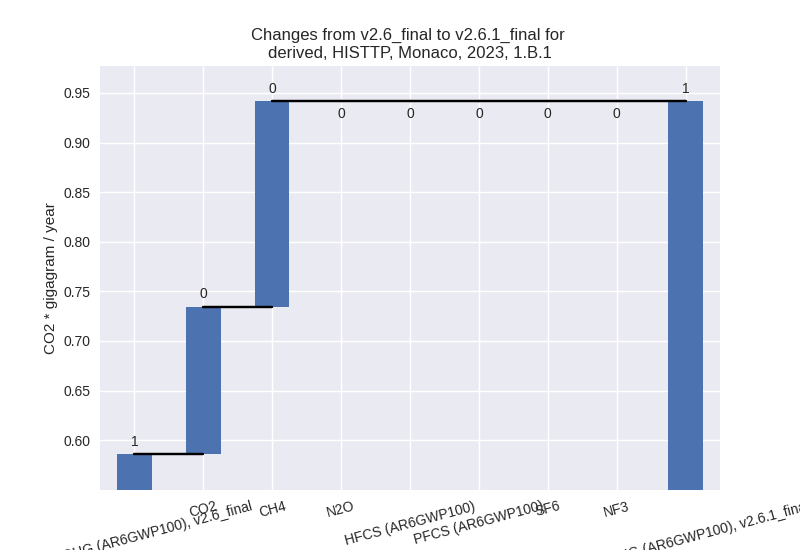
For 1990-2023 the changes per gas are: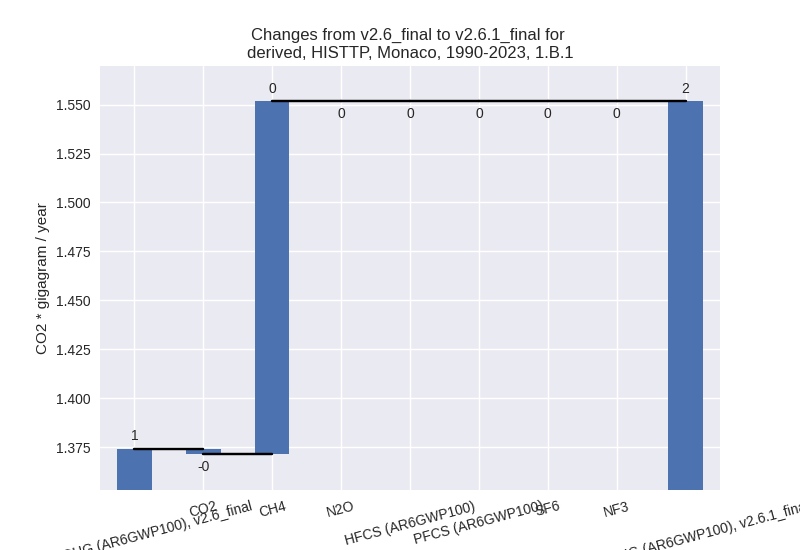
There is no subsector information available in PRIMAP-hist. - 1.B.2: Total sectoral emissions in 2022 are 2.08 Gg
CO2 / year which is 3.3% of category 1 emissions. 2023 Emissions have
changed by 36.9% (0.56 Gg CO2 /
year). 1990-2023 Emissions have changed by 38.9% (0.58 Gg CO2 / year). For 2023 the
changes per gas
are:
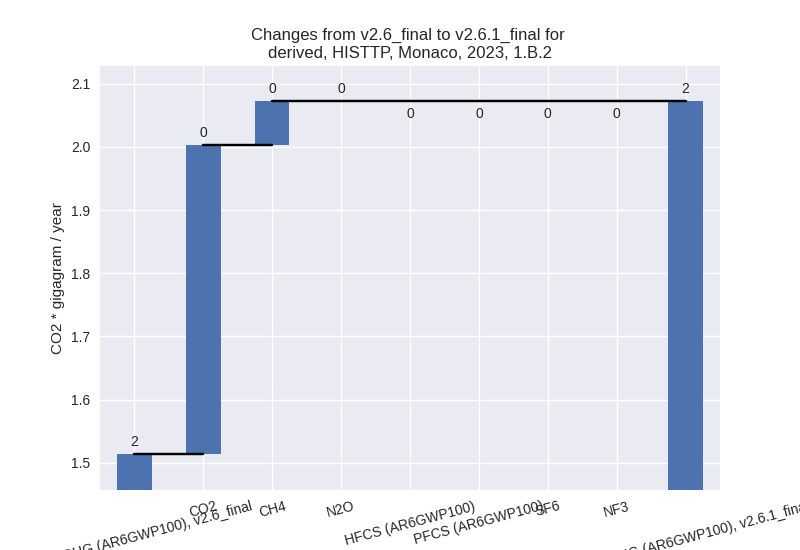
For 1990-2023 the changes per gas are: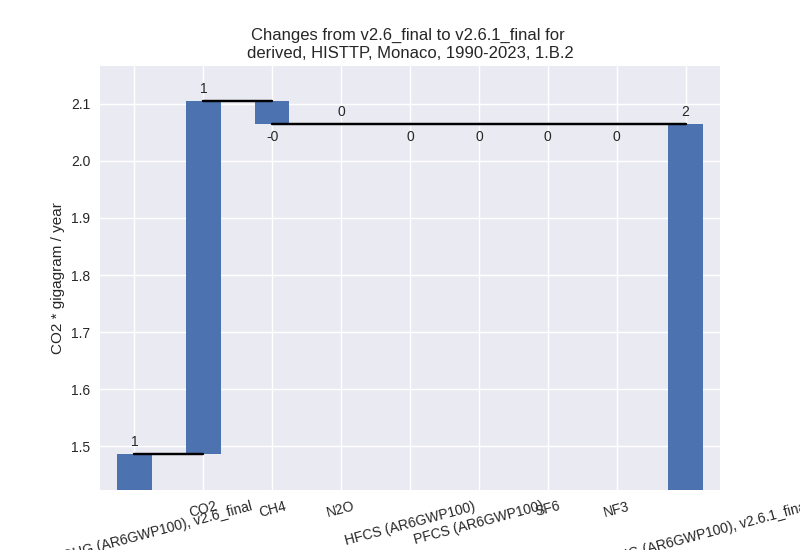
There is no subsector information available in PRIMAP-hist.
- 1.A: Total sectoral emissions in 2022 are 59.97 Gg
CO2 / year which is 95.1% of category 1 emissions. 2023 Emissions have
changed by -4.0% (-2.72 Gg CO2 /
year). 1990-2023 Emissions have changed by -0.5% (-0.41 Gg CO2 / year). For 2023 the
changes per gas
are:
- 2: Total sectoral emissions in 2022 are 12.96 Gg
CO2 / year which is 10.0% of M.0.EL emissions. 2023 Emissions have
changed by -13.1% (-1.72 Gg CO2 /
year). 1990-2023 Emissions have changed by -12.7% (-2.74 Gg CO2 / year). For 2023 the
changes per gas
are:
For 1990-2023 the changes per gas are: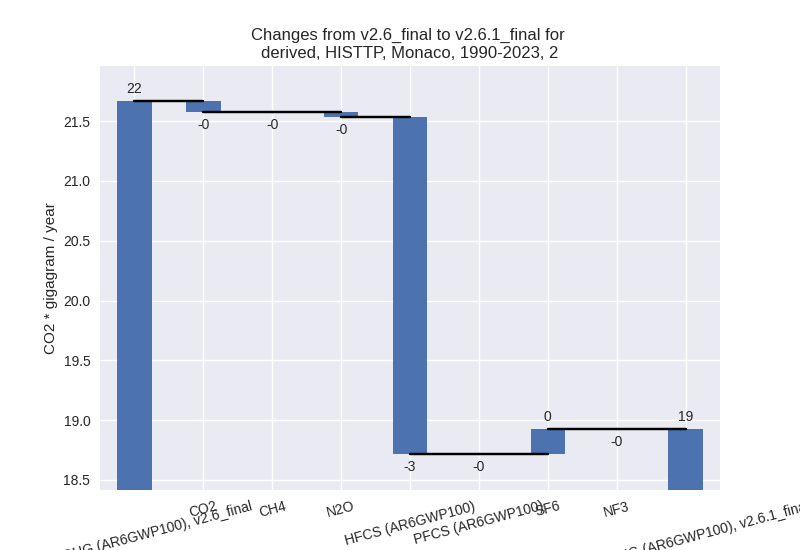
- M.AG: Total sectoral emissions in 2022 are 40.57 Gg
CO2 / year which is 31.5% of M.0.EL emissions. 2023 Emissions have
changed by 5.2% (2.01 Gg CO2 /
year). 1990-2023 Emissions have changed by -0.7% (-0.33 Gg CO2 / year). For 2023 the
changes per gas
are:
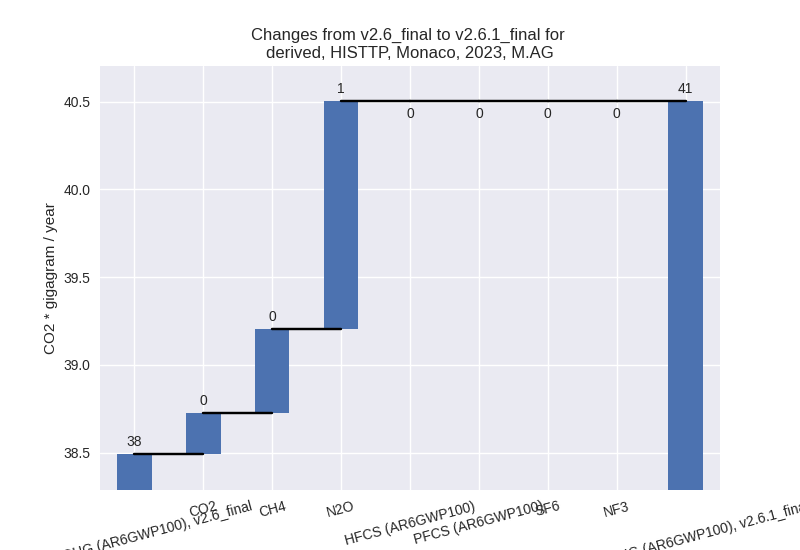
The changes come from the following subsectors:- 3.A: Total sectoral emissions in 2022 are 26.17 Gg CO2 / year which is 64.5% of category M.AG emissions. 2023 Emissions have changed by 1.9% (0.49 Gg CO2 / year). 1990-2023 Emissions have changed by -0.9% (-0.26 Gg CO2 / year).
- M.AG.ELV: Total sectoral emissions in 2022 are
14.40 Gg CO2 / year which is 35.5% of category M.AG emissions. 2023
Emissions have changed by 11.8%
(1.52 Gg CO2 / year). 1990-2023 Emissions have changed by -0.4% (-0.07 Gg CO2 / year). For 2023 the
changes per gas
are:
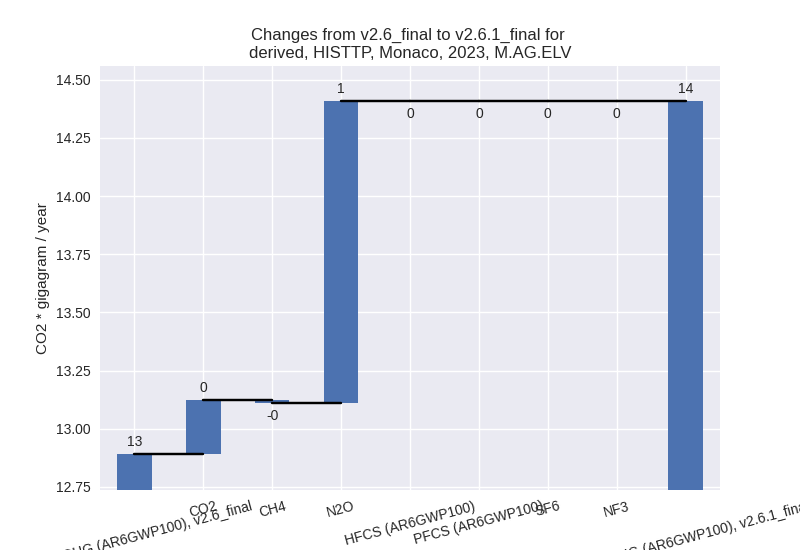
There is no subsector information available in PRIMAP-hist.
- 4: Total sectoral emissions in 2022 are 11.90 Gg
CO2 / year which is 9.2% of M.0.EL emissions. 2023 Emissions have
changed by -6.8% (-0.84 Gg CO2 /
year). 1990-2023 Emissions have changed by -11.1% (-1.70 Gg CO2 / year). For 2023 the
changes per gas
are:
For 1990-2023 the changes per gas are: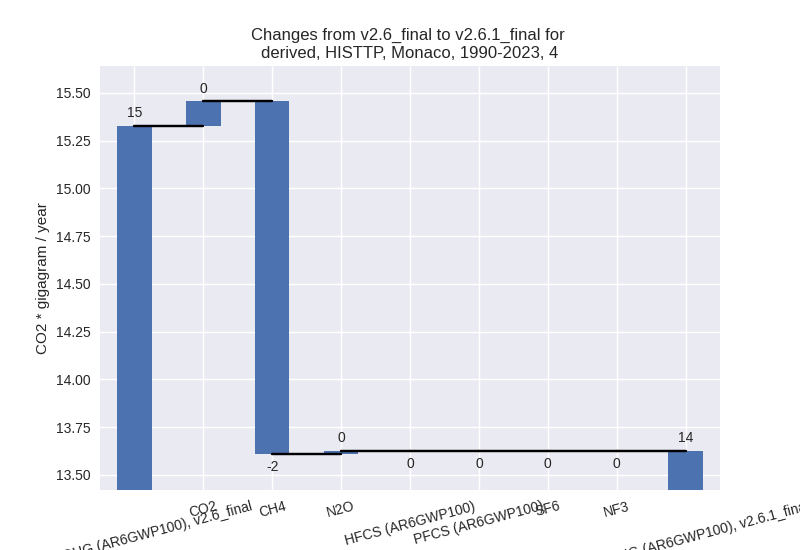
- 5: Total sectoral emissions in 2022 are 0.44 Gg CO2
/ year which is 0.3% of M.0.EL emissions. 2023 Emissions have changed by
-7.7% (-0.03 Gg CO2 / year).
1990-2023 Emissions have changed by -3.3% (-0.03 Gg CO2 / year). For 2023 the
changes per gas
are:
For 1990-2023 the changes per gas are: