Changes in PRIMAP-hist v2.6.1_final compared to v2.6_final for Moldova, Republic of
2025-03-19
Johannes Gütschow
Change analysis for Moldova, Republic of for PRIMAP-hist v2.6.1_final compared to v2.6_final
Overview over emissions by sector and gas
The following figures show the aggregate national total emissions excluding LULUCF AR6GWP100 for the country reported priority scenario. The dotted linesshow the v2.6_final data.
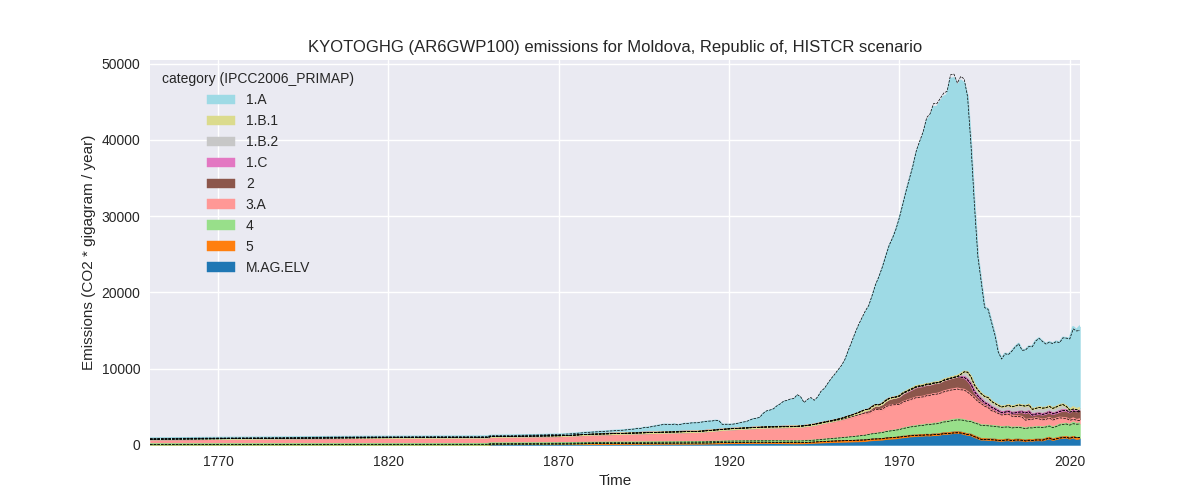
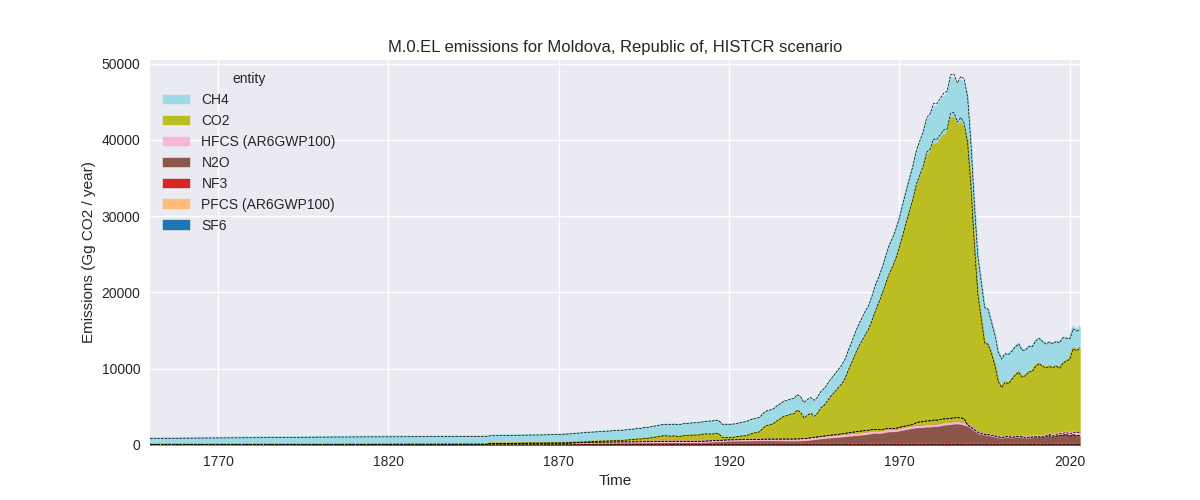
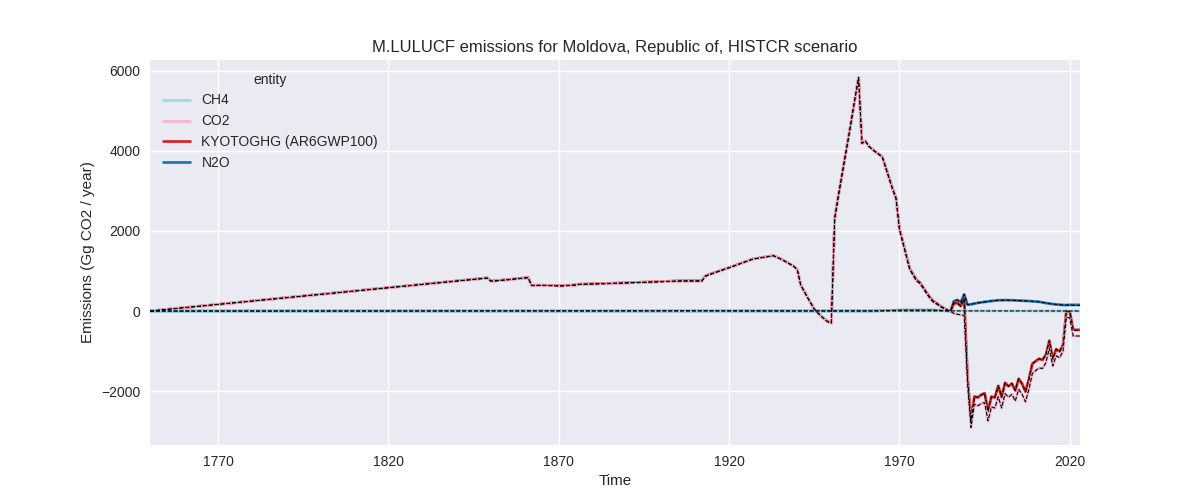
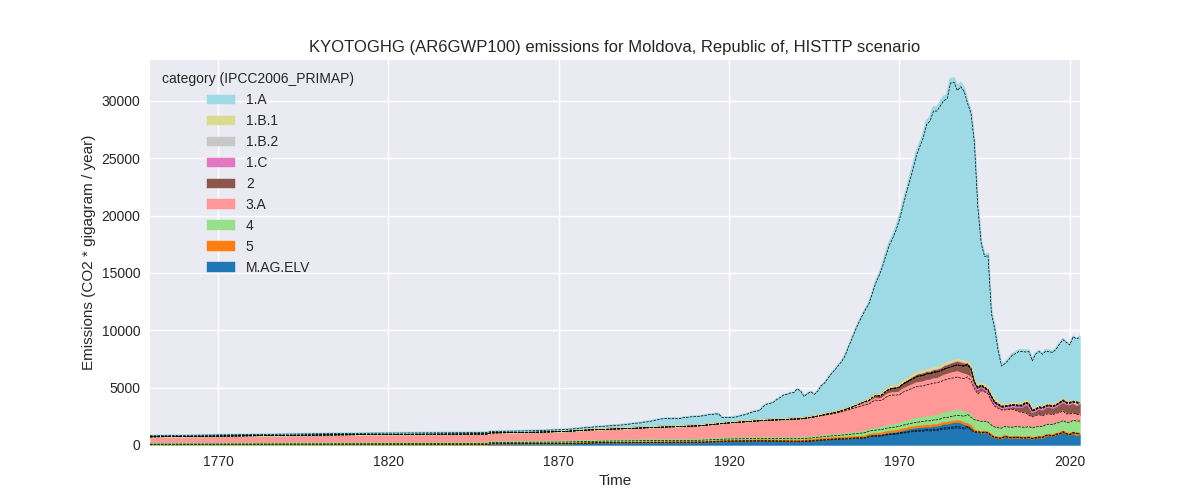
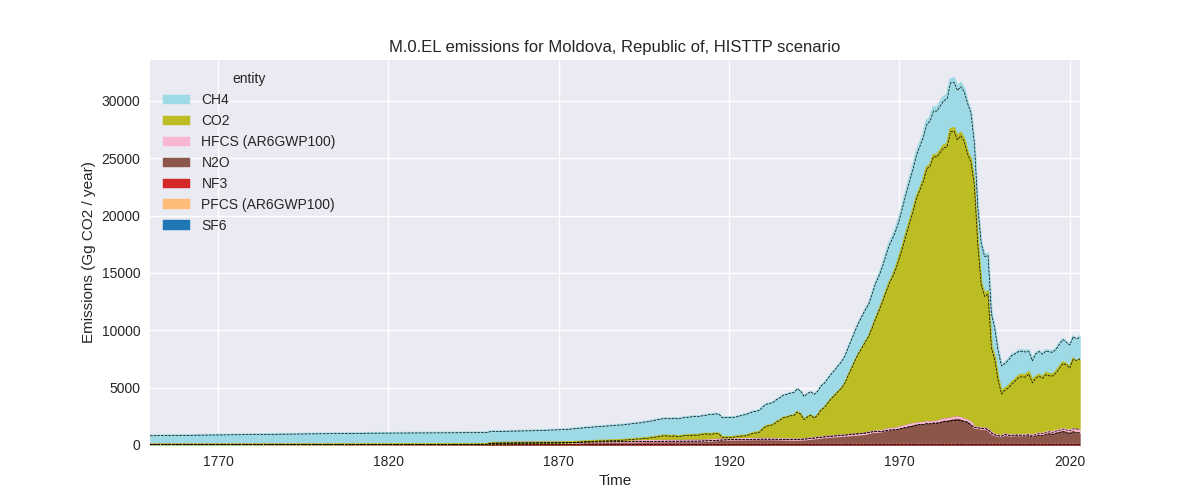
The following figures show the aggregate national total emissions excluding LULUCF AR6GWP100 for the third party priority scenario. The dotted linesshow the v2.6_final data.
Overview over changes
In the country reported priority scenario we have the following changes for aggregate Kyoto GHG and national total emissions excluding LULUCF (M.0.EL):
- Emissions in 2023 have changed by 3.5%% (522.12 Gg CO2 / year)
- Emissions in 1990-2023 have changed by 0.2%% (25.15 Gg CO2 / year)
In the third party priority scenario we have the following changes for aggregate Kyoto GHG and national total emissions excluding LULUCF (M.0.EL):
- Emissions in 2023 have changed by 1.1%% (101.17 Gg CO2 / year)
- Emissions in 1990-2023 have changed by 0.7%% (76.00 Gg CO2 / year)
Most important changes per scenario and time frame
In the country reported priority scenario the following sector-gas combinations have the highest absolute impact on national total KyotoGHG (AR6GWP100) emissions in 2023 (top 5):
- 1: 1.B.2, CH4 with 219.84 Gg CO2 / year (463.8%)
- 2: 4, CH4 with 171.12 Gg CO2 / year (10.3%)
- 3: M.AG.ELV, N2O with -89.69 Gg CO2 / year (-9.4%)
- 4: 2, CO2 with 76.68 Gg CO2 / year (10.0%)
- 5: 3.A, CH4 with 74.68 Gg CO2 / year (23.2%)
In the country reported priority scenario the following sector-gas combinations have the highest absolute impact on national total KyotoGHG (AR6GWP100) emissions in 1990-2023 (top 5):
- 1: 4, CH4 with 13.59 Gg CO2 / year (0.8%)
- 2: 2, CO2 with 8.02 Gg CO2 / year (1.3%)
- 3: M.AG.ELV, N2O with -7.59 Gg CO2 / year (-1.0%)
- 4: 1.B.2, CH4 with 6.35 Gg CO2 / year (0.9%)
- 5: 1.A, CH4 with 3.85 Gg CO2 / year (3.1%)
In the third party priority scenario the following sector-gas combinations have the highest absolute impact on national total KyotoGHG (AR6GWP100) emissions in 2023 (top 5):
- 1: M.AG.ELV, CH4 with 49.65 Gg CO2 / year (155.0%)
- 2: 1.A, CH4 with 46.48 Gg CO2 / year (19.5%)
- 3: M.AG.ELV, N2O with -40.50 Gg CO2 / year (-5.2%)
- 4: 1.B.2, CO2 with 36.31 Gg CO2 / year (302919.5%)
- 5: 3.A, CH4 with 33.00 Gg CO2 / year (6.8%)
In the third party priority scenario the following sector-gas combinations have the highest absolute impact on national total KyotoGHG (AR6GWP100) emissions in 1990-2023 (top 5):
- 1: 1.B.2, CO2 with 131.46 Gg CO2 / year (1749.3%)
- 2: 4, CH4 with -56.24 Gg CO2 / year (-6.3%)
- 3: M.AG.ELV, N2O with 5.23 Gg CO2 / year (0.7%)
- 4: 1.B.2, CH4 with 4.50 Gg CO2 / year (5.9%)
- 5: 1.A, CH4 with -3.93 Gg CO2 / year (-2.5%)
Notes on data changes
Here we list notes explaining important emissions changes for the country.
- No new country reported data has been included. Changes in the CR time-series are mostly limited to the latest years and due to new third-party data which includes updated emissions and also replaces numerically extrapolated data points (e.g. 1.B.1, CH4).
Changes by sector and gas
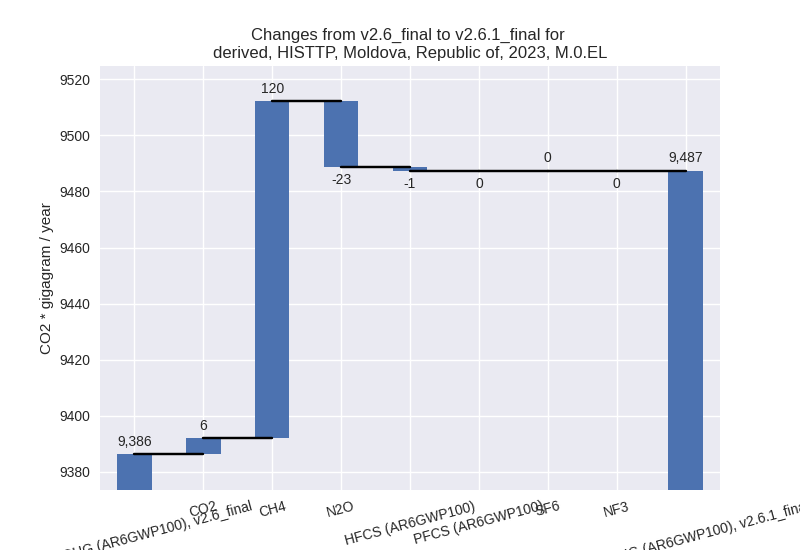
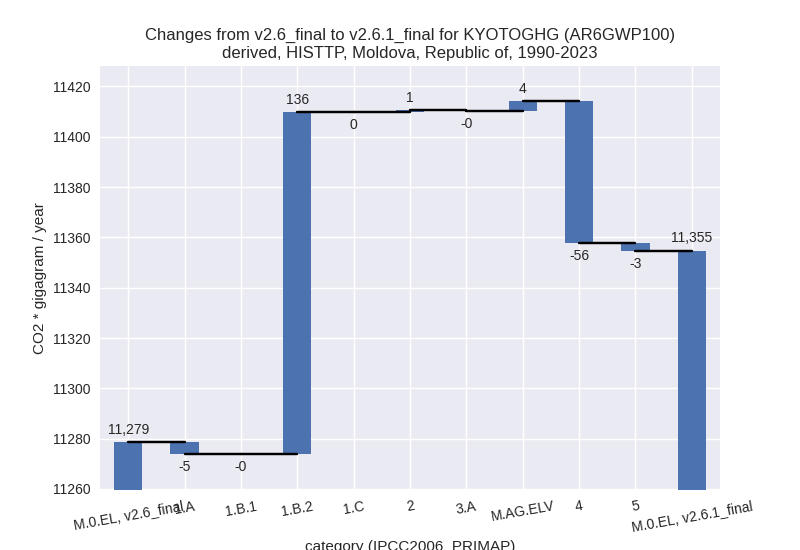
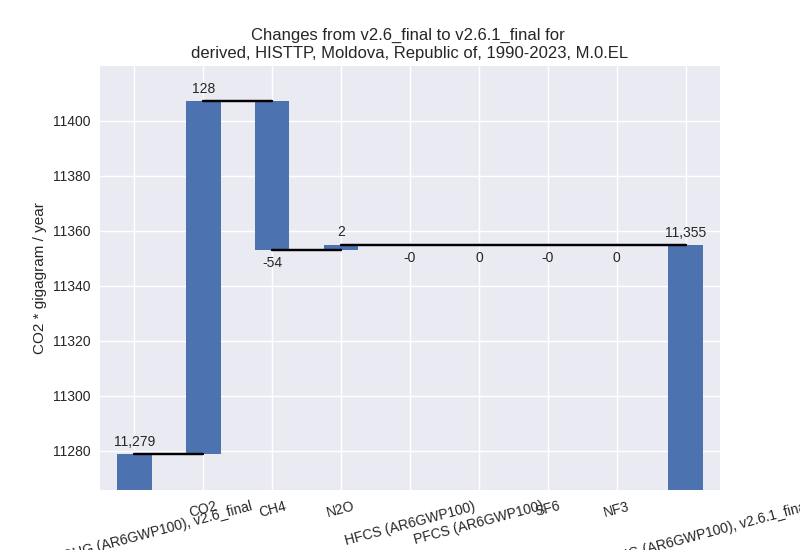
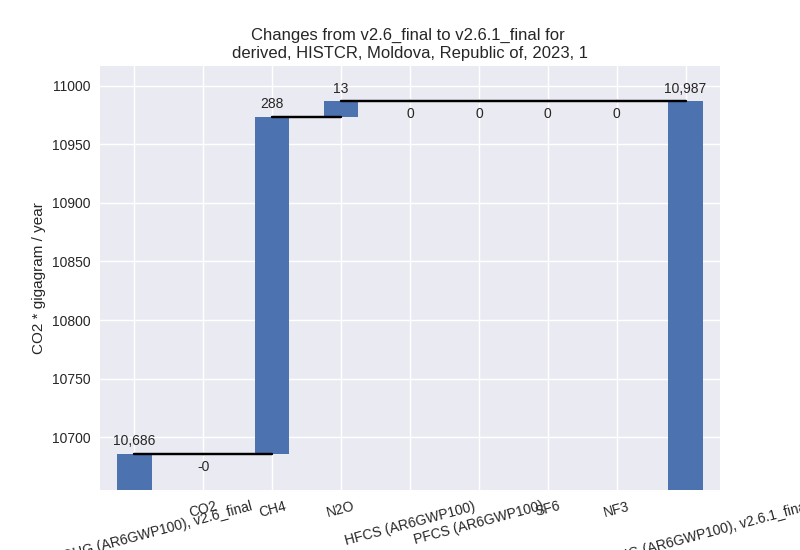
For each scenario and time frame the changes are displayed for all individual sectors and all individual gases. In the sector plot we use aggregate Kyoto GHGs in AR6GWP100. In the gas plot we usenational total emissions without LULUCF.
country reported scenario
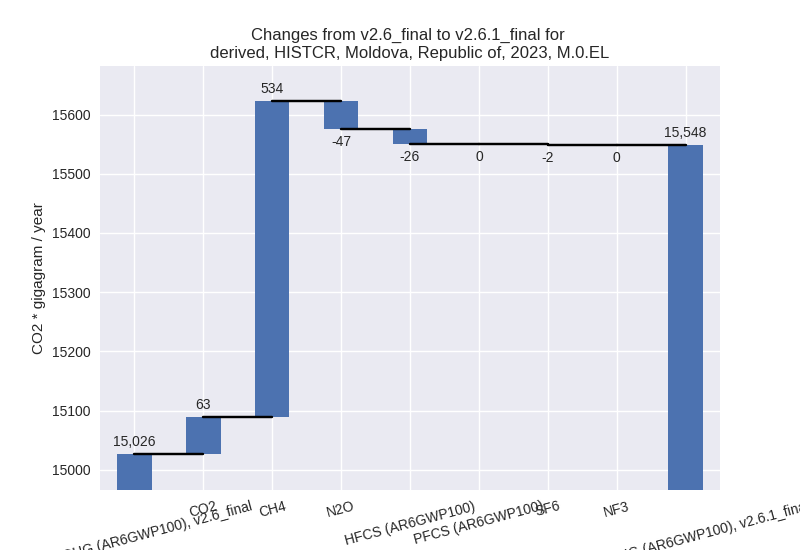
2023
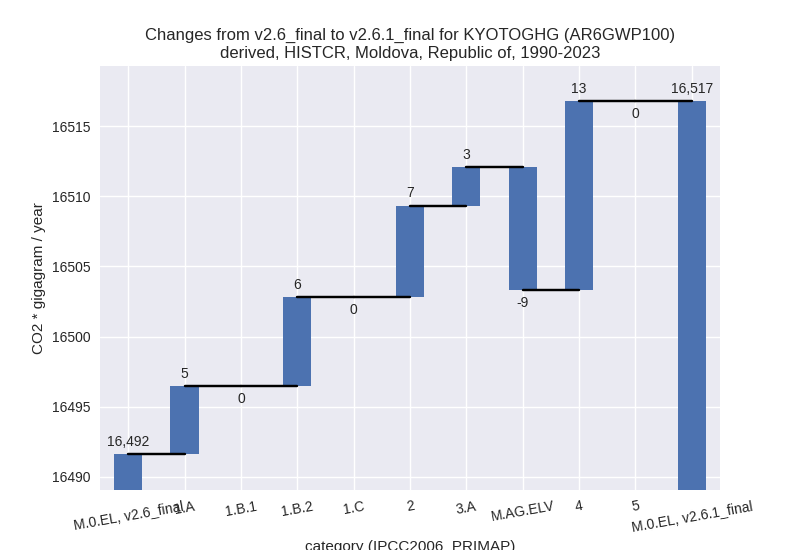
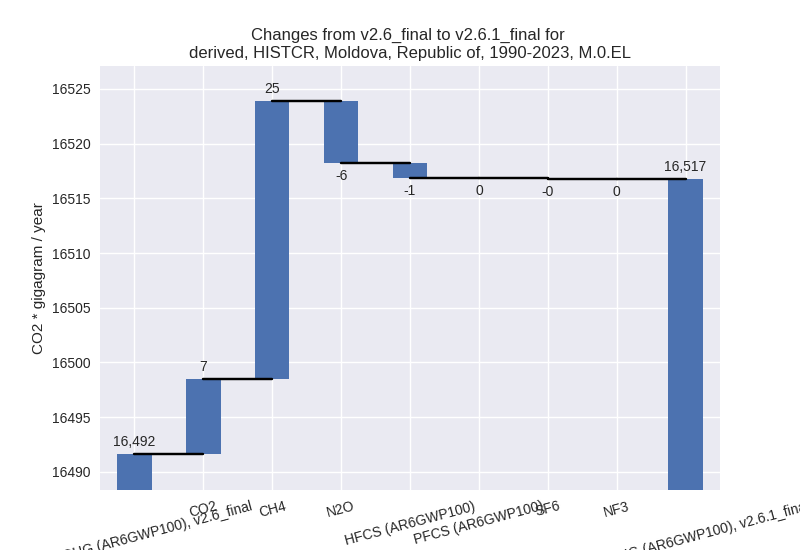
1990-2023
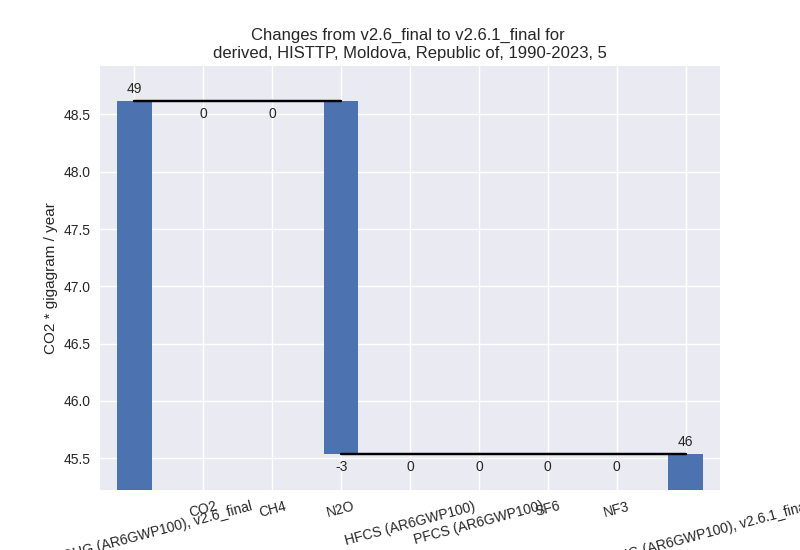
third party scenario
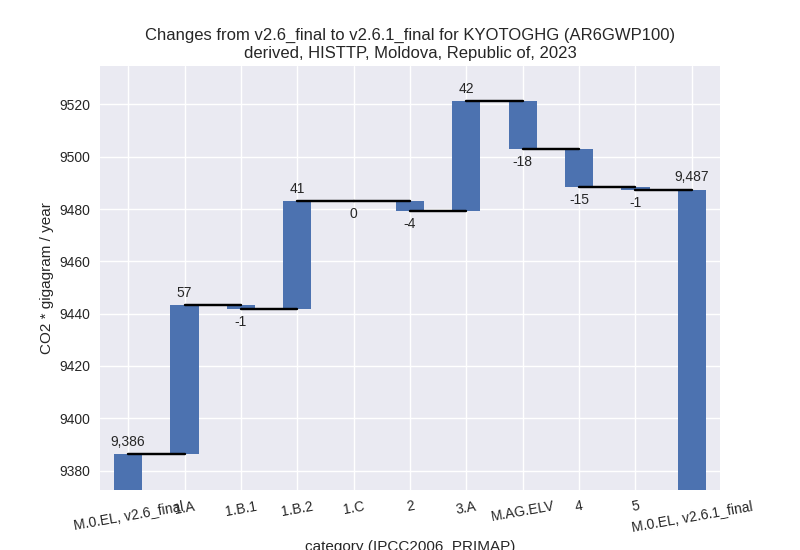
2023
1990-2023
Detailed changes for the scenarios:
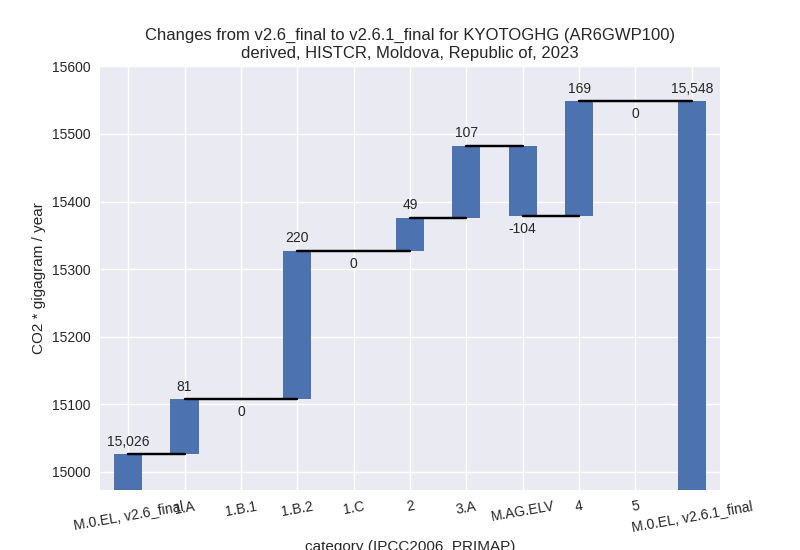
country reported scenario (HISTCR):
Most important changes per time frame
For 2023 the following sector-gas combinations have the highest absolute impact on national total KyotoGHG (AR6GWP100) emissions in 2023 (top 5):
- 1: 1.B.2, CH4 with 219.84 Gg CO2 / year (463.8%)
- 2: 4, CH4 with 171.12 Gg CO2 / year (10.3%)
- 3: M.AG.ELV, N2O with -89.69 Gg CO2 / year (-9.4%)
- 4: 2, CO2 with 76.68 Gg CO2 / year (10.0%)
- 5: 3.A, CH4 with 74.68 Gg CO2 / year (23.2%)
For 1990-2023 the following sector-gas combinations have the highest absolute impact on national total KyotoGHG (AR6GWP100) emissions in 1990-2023 (top 5):
- 1: 4, CH4 with 13.59 Gg CO2 / year (0.8%)
- 2: 2, CO2 with 8.02 Gg CO2 / year (1.3%)
- 3: M.AG.ELV, N2O with -7.59 Gg CO2 / year (-1.0%)
- 4: 1.B.2, CH4 with 6.35 Gg CO2 / year (0.9%)
- 5: 1.A, CH4 with 3.85 Gg CO2 / year (3.1%)
Changes in the main sectors for aggregate KyotoGHG (AR6GWP100) are
- 1: Total sectoral emissions in 2022 are 10631.11 Gg
CO2 / year which is 70.6% of M.0.EL emissions. 2023 Emissions have
changed by 2.8% (300.97 Gg CO2 /
year). 1990-2023 Emissions have changed by 0.1% (11.19 Gg CO2 / year). For 2023 the
changes per gas
are:
The changes come from the following subsectors:- 1.A: Total sectoral emissions in 2022 are 10363.86 Gg CO2 / year which is 97.5% of category 1 emissions. 2023 Emissions have changed by 0.8% (81.43 Gg CO2 / year). 1990-2023 Emissions have changed by 0.0% (4.86 Gg CO2 / year).
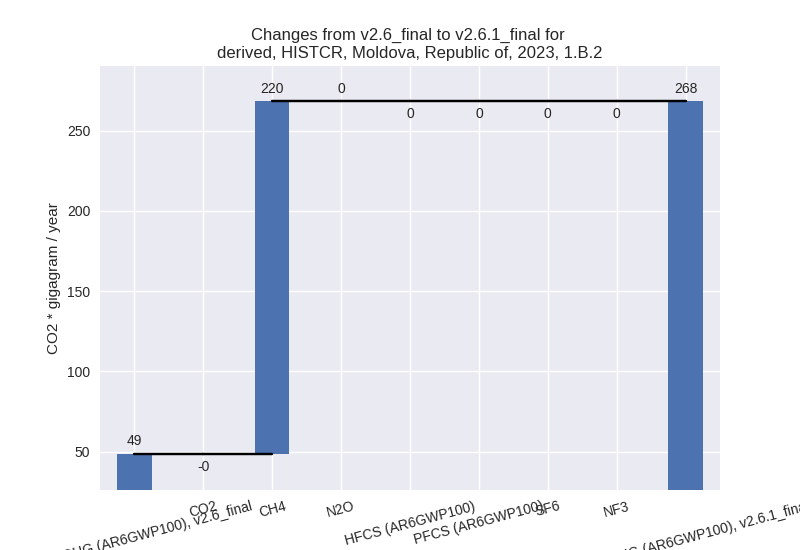
- 1.B.2: Total sectoral emissions in 2022 are 267.25
Gg CO2 / year which is 2.5% of category 1 emissions. 2023 Emissions have
changed by 450.9% (219.54 Gg CO2 /
year). 1990-2023 Emissions have changed by 0.9% (6.34 Gg CO2 / year). For 2023 the
changes per gas
are:
There is no subsector information available in PRIMAP-hist.
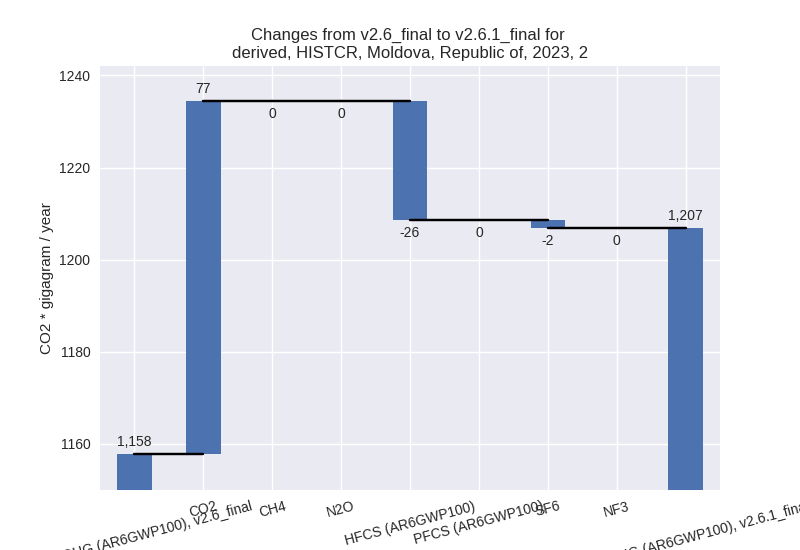
- 2: Total sectoral emissions in 2022 are 1180.62 Gg
CO2 / year which is 7.8% of M.0.EL emissions. 2023 Emissions have
changed by 4.2% (49.09 Gg CO2 /
year). 1990-2023 Emissions have changed by 0.9% (6.52 Gg CO2 / year). For 2023 the
changes per gas
are:
- M.AG: Total sectoral emissions in 2022 are 1358.03 Gg CO2 / year which is 9.0% of M.0.EL emissions. 2023 Emissions have changed by 0.2% (2.82 Gg CO2 / year). 1990-2023 Emissions have changed by -0.3% (-6.02 Gg CO2 / year).
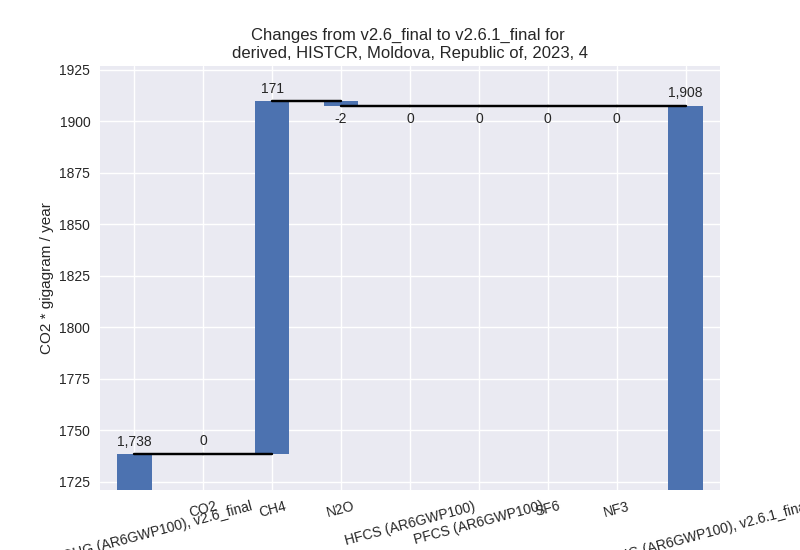
- 4: Total sectoral emissions in 2022 are 1883.27 Gg
CO2 / year which is 12.5% of M.0.EL emissions. 2023 Emissions have
changed by 9.7% (169.24 Gg CO2 /
year). 1990-2023 Emissions have changed by 0.8% (13.45 Gg CO2 / year). For 2023 the
changes per gas
are:
- 5: No data
third party scenario (HISTTP):
Most important changes per time frame
For 2023 the following sector-gas combinations have the highest absolute impact on national total KyotoGHG (AR6GWP100) emissions in 2023 (top 5):
- 1: M.AG.ELV, CH4 with 49.65 Gg CO2 / year (155.0%)
- 2: 1.A, CH4 with 46.48 Gg CO2 / year (19.5%)
- 3: M.AG.ELV, N2O with -40.50 Gg CO2 / year (-5.2%)
- 4: 1.B.2, CO2 with 36.31 Gg CO2 / year (302919.5%)
- 5: 3.A, CH4 with 33.00 Gg CO2 / year (6.8%)
For 1990-2023 the following sector-gas combinations have the highest absolute impact on national total KyotoGHG (AR6GWP100) emissions in 1990-2023 (top 5):
- 1: 1.B.2, CO2 with 131.46 Gg CO2 / year (1749.3%)
- 2: 4, CH4 with -56.24 Gg CO2 / year (-6.3%)
- 3: M.AG.ELV, N2O with 5.23 Gg CO2 / year (0.7%)
- 4: 1.B.2, CH4 with 4.50 Gg CO2 / year (5.9%)
- 5: 1.A, CH4 with -3.93 Gg CO2 / year (-2.5%)
Changes in the main sectors for aggregate KyotoGHG (AR6GWP100) are
- 1: Total sectoral emissions in 2022 are 5677.61 Gg CO2 / year which is 61.9% of M.0.EL emissions. 2023 Emissions have changed by 1.7% (96.78 Gg CO2 / year). 1990-2023 Emissions have changed by 1.8% (131.13 Gg CO2 / year).
- 2: Total sectoral emissions in 2022 are 971.78 Gg CO2 / year which is 10.6% of M.0.EL emissions. 2023 Emissions have changed by -0.4% (-3.90 Gg CO2 / year). 1990-2023 Emissions have changed by 0.1% (0.69 Gg CO2 / year).
- M.AG: Total sectoral emissions in 2022 are 1416.93 Gg CO2 / year which is 15.4% of M.0.EL emissions. 2023 Emissions have changed by 1.6% (23.72 Gg CO2 / year). 1990-2023 Emissions have changed by 0.2% (3.61 Gg CO2 / year).
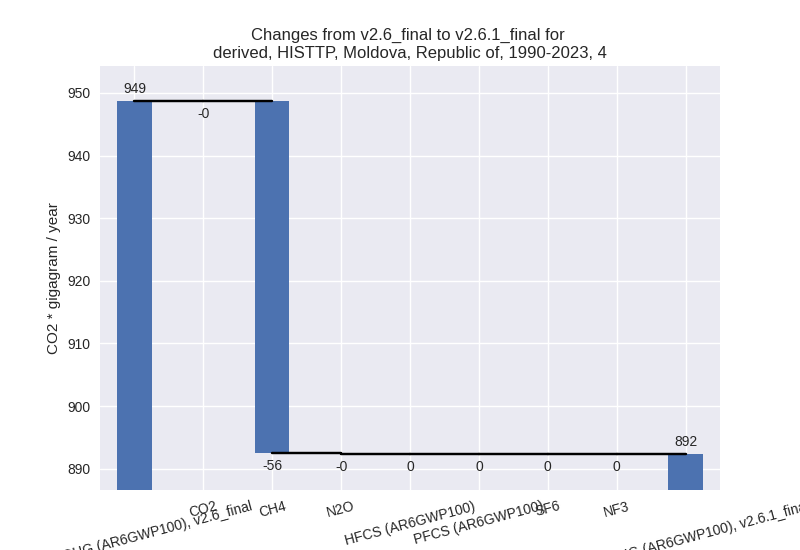
- 4: Total sectoral emissions in 2022 are 1058.44 Gg
CO2 / year which is 11.5% of M.0.EL emissions. 2023 Emissions have
changed by -1.3% (-14.56 Gg CO2 /
year). 1990-2023 Emissions have changed by -5.9% (-56.36 Gg CO2 / year). For
1990-2023 the changes per gas
are:
- 5: Total sectoral emissions in 2022 are 51.45 Gg
CO2 / year which is 0.6% of M.0.EL emissions. 2023 Emissions have
changed by -1.6% (-0.86 Gg CO2 /
year). 1990-2023 Emissions have changed by -6.3% (-3.08 Gg CO2 / year). For 1990-2023
the changes per gas
are: