Changes in PRIMAP-hist v2.6.1_final compared to v2.6_final for Maldives
2025-03-19
Johannes Gütschow
Change analysis for Maldives for PRIMAP-hist v2.6.1_final compared to v2.6_final
Overview over emissions by sector and gas
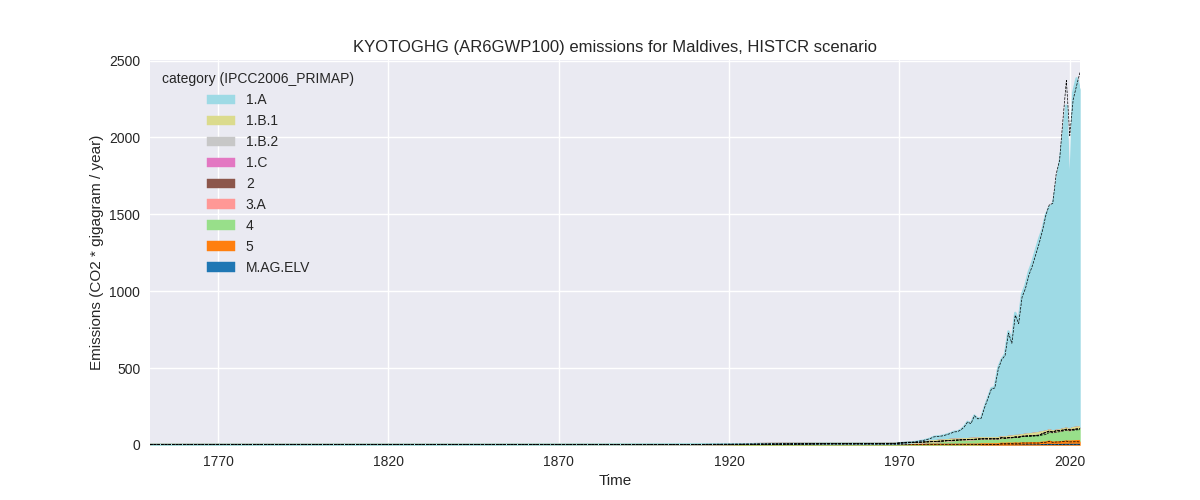
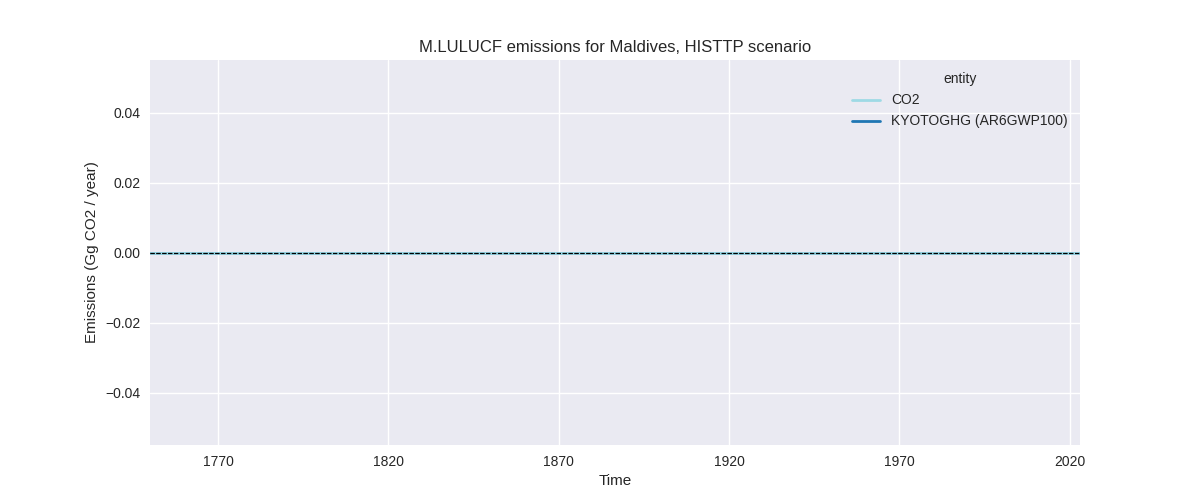
The following figures show the aggregate national total emissions excluding LULUCF AR6GWP100 for the country reported priority scenario. The dotted linesshow the v2.6_final data.
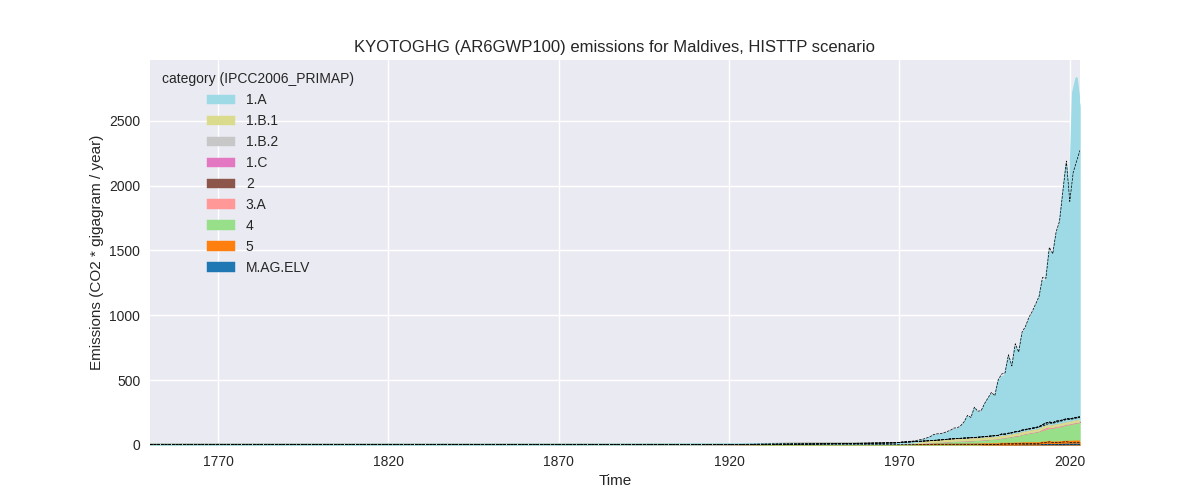
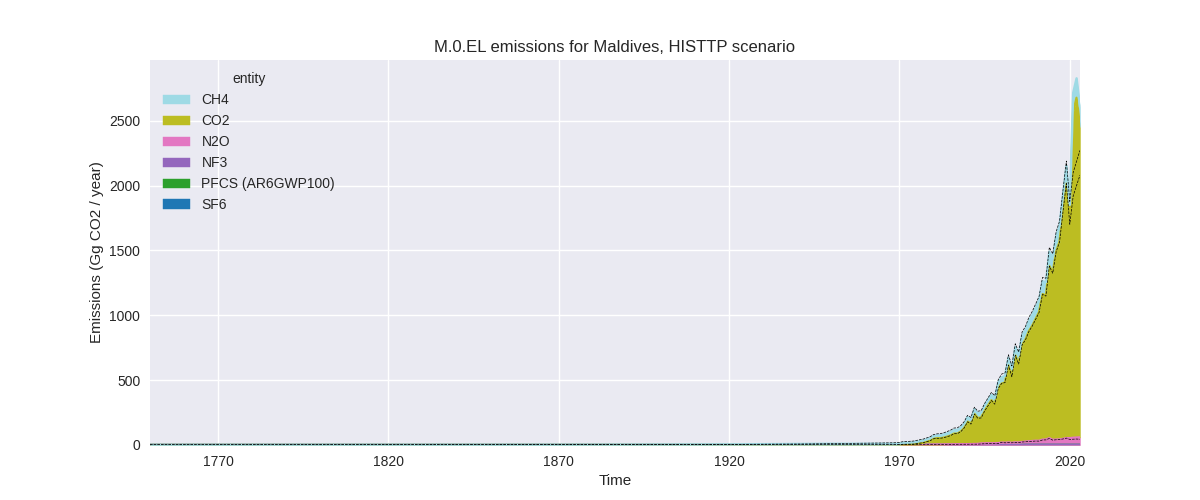
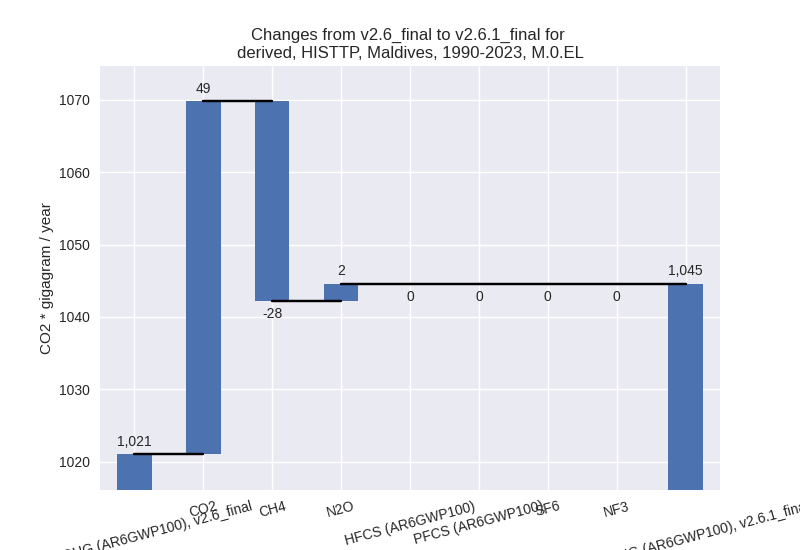
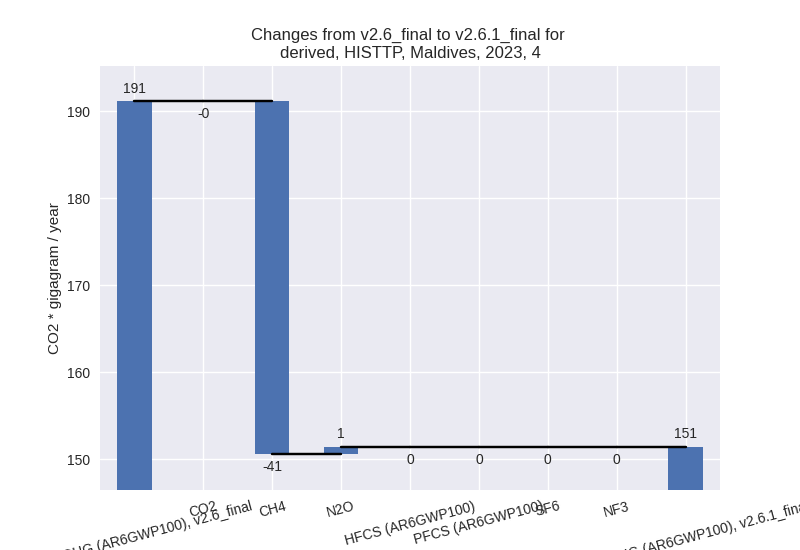
The following figures show the aggregate national total emissions excluding LULUCF AR6GWP100 for the third party priority scenario. The dotted linesshow the v2.6_final data.
Overview over changes
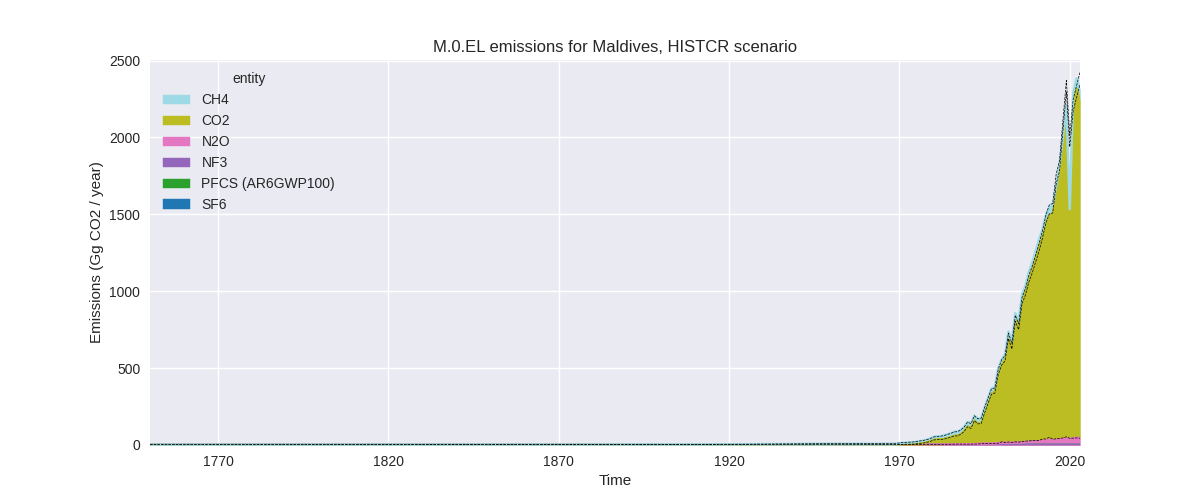
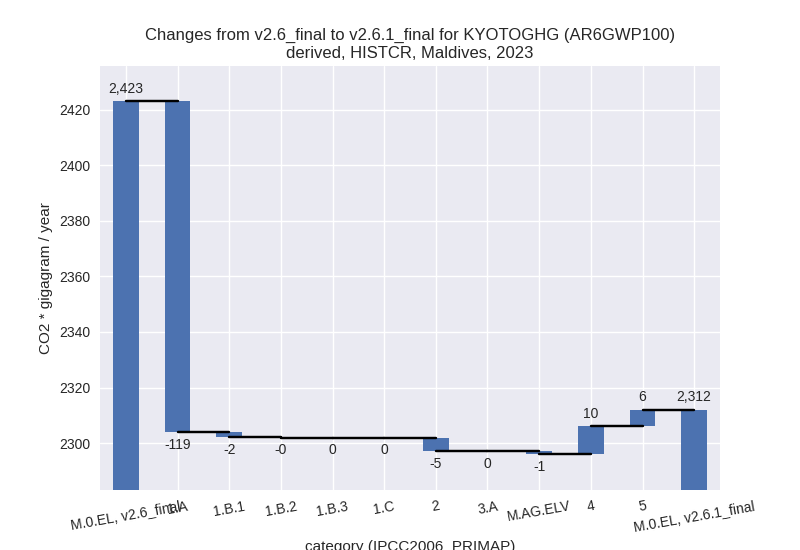
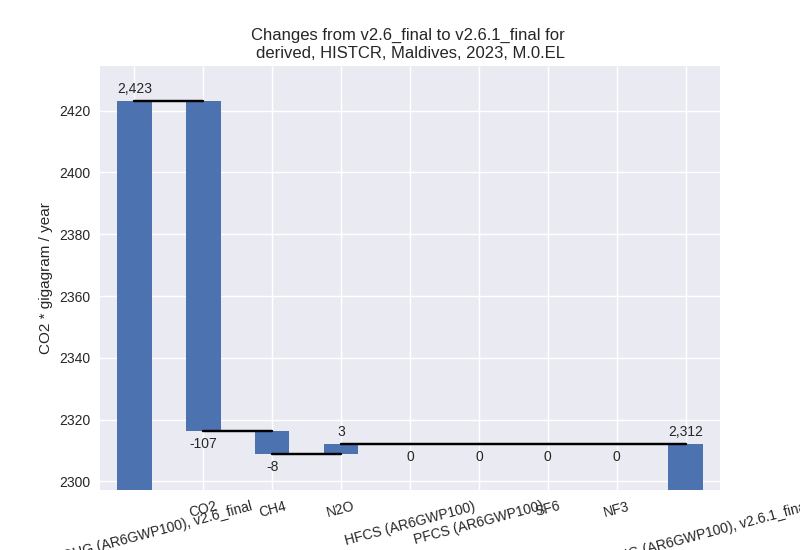
In the country reported priority scenario we have the following changes for aggregate Kyoto GHG and national total emissions excluding LULUCF (M.0.EL):
- Emissions in 2023 have changed by -4.6%% (-111.07 Gg CO2 / year)
- Emissions in 1990-2023 have changed by -1.8%% (-19.25 Gg CO2 / year)
In the third party priority scenario we have the following changes for aggregate Kyoto GHG and national total emissions excluding LULUCF (M.0.EL):
- Emissions in 2023 have changed by 14.7%% (332.93 Gg CO2 / year)
- Emissions in 1990-2023 have changed by 2.3%% (23.51 Gg CO2 / year)
Most important changes per scenario and time frame
In the country reported priority scenario the following sector-gas combinations have the highest absolute impact on national total KyotoGHG (AR6GWP100) emissions in 2023 (top 5):
- 1: 1.A, CO2 with -111.30 Gg CO2 / year (-4.9%)
- 2: 4, CO2 with 9.54 Gg CO2 / year (248.3%)
- 3: 5, N2O with 5.97 Gg CO2 / year (31.6%)
- 4: 2, CO2 with -4.90 Gg CO2 / year (-100.0%)
- 5: 1.A, N2O with -4.02 Gg CO2 / year (-23.4%)
In the country reported priority scenario the following sector-gas combinations have the highest absolute impact on national total KyotoGHG (AR6GWP100) emissions in 1990-2023 (top 5):
- 1: 1.A, CO2 with -15.06 Gg CO2 / year (-1.5%)
- 2: 4, CO2 with 5.60 Gg CO2 / year (260.5%)
- 3: 1.A, N2O with -4.63 Gg CO2 / year (-49.4%)
- 4: 2, CO2 with -3.52 Gg CO2 / year (-100.0%)
- 5: 1.A, CH4 with -3.00 Gg CO2 / year (-56.7%)
In the third party priority scenario the following sector-gas combinations have the highest absolute impact on national total KyotoGHG (AR6GWP100) emissions in 2023 (top 5):
- 1: 1.A, CO2 with 354.62 Gg CO2 / year (17.5%)
- 2: 4, CH4 with -40.57 Gg CO2 / year (-22.5%)
- 3: 1.A, N2O with 7.89 Gg CO2 / year (45.9%)
- 4: 5, N2O with 5.97 Gg CO2 / year (31.6%)
- 5: 1.A, CH4 with 3.78 Gg CO2 / year (43.5%)
In the third party priority scenario the following sector-gas combinations have the highest absolute impact on national total KyotoGHG (AR6GWP100) emissions in 1990-2023 (top 5):
- 1: 1.A, CO2 with 48.71 Gg CO2 / year (5.5%)
- 2: 4, CH4 with -28.61 Gg CO2 / year (-28.0%)
- 3: 4, N2O with 1.33 Gg CO2 / year (27.9%)
- 4: 1.A, N2O with 1.08 Gg CO2 / year (11.5%)
- 5: 1.B.1, CH4 with 0.59 Gg CO2 / year (47.0%)
Notes on data changes
Here we list notes explaining important emissions changes for the country.
- CRT data from BTR1covering 2001-2022 (but 2001-2010 only NO, not used) replaces DI for 2011-2015. DI data is still used for 1994. Many sector have changes because of the new data, but most are not important for total emissions changes which are dominated by energy CO2 where the new CRT data replaces third party growth rates. High relative changes in waste CO2 come from CRT data replacing EDGAR. For the same reason CO2 in 2.D is now zero.
- Changes in the TP time series are partly also due to the new country
reported data as the Maldives are not included in the EI data (not even
in a regional sum)
- The second important change in the TP time series is lower waste CH4 from the new EDGAR data
Changes by sector and gas
For each scenario and time frame the changes are displayed for all individual sectors and all individual gases. In the sector plot we use aggregate Kyoto GHGs in AR6GWP100. In the gas plot we usenational total emissions without LULUCF.
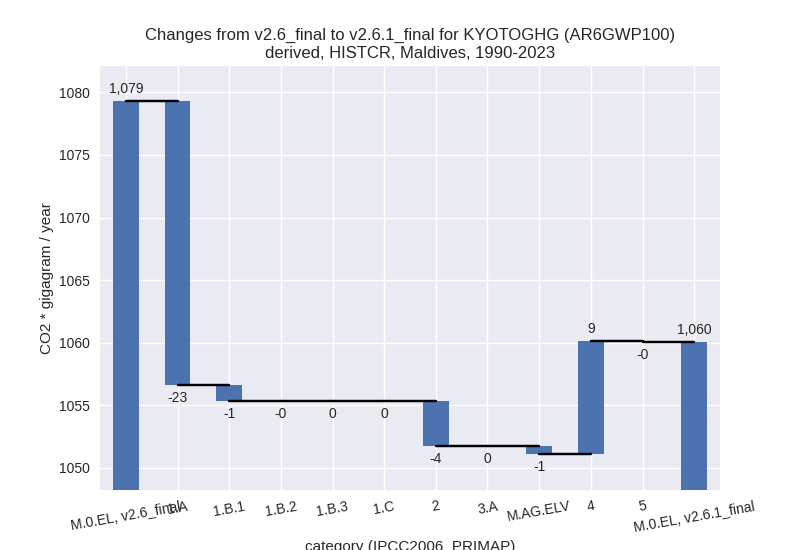
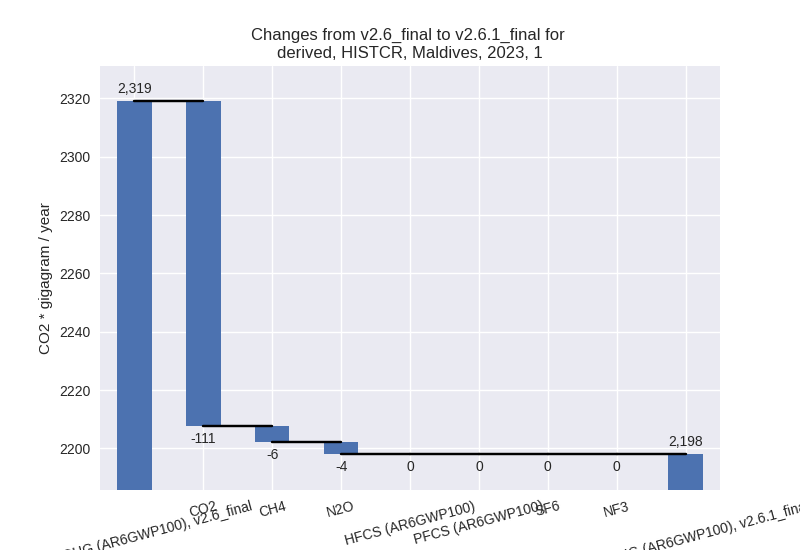
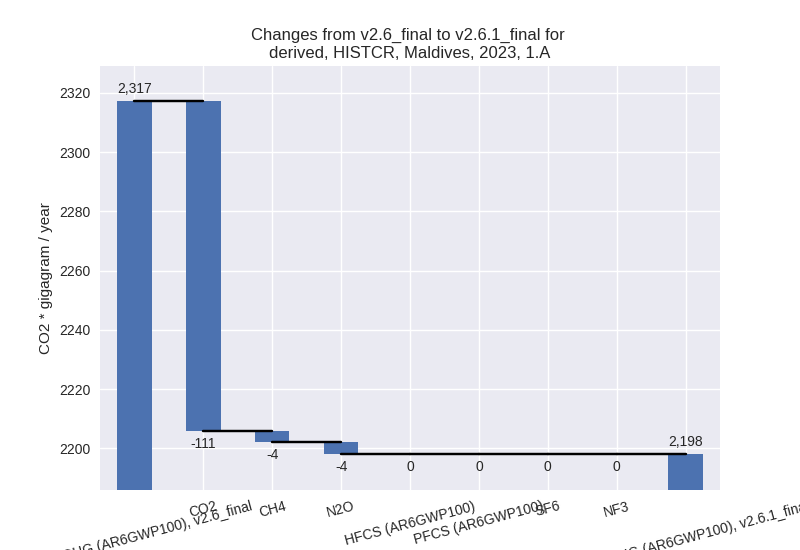
country reported scenario
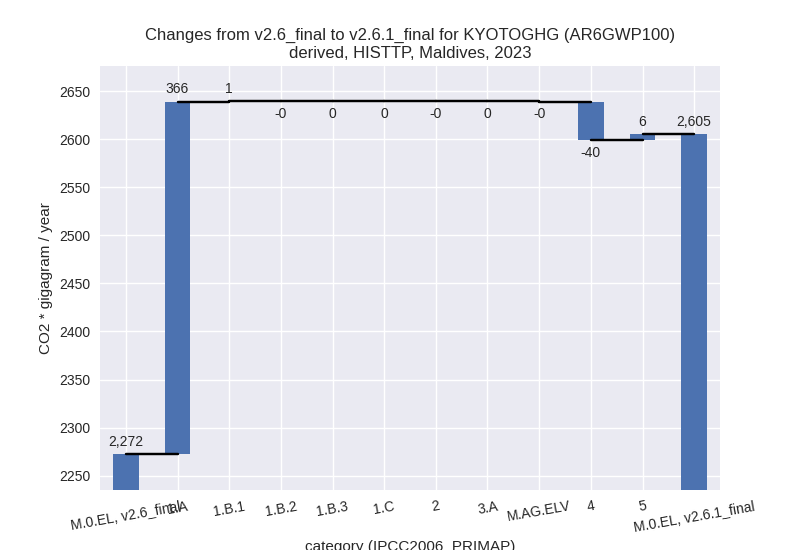
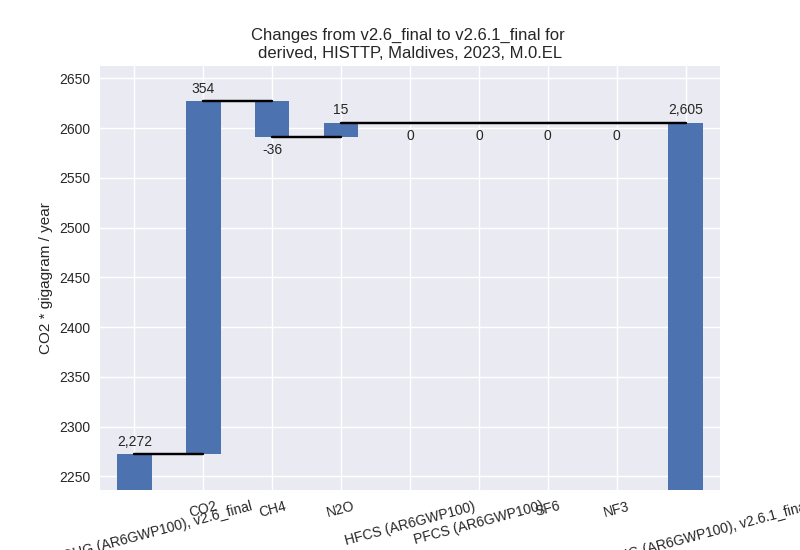
2023
1990-2023

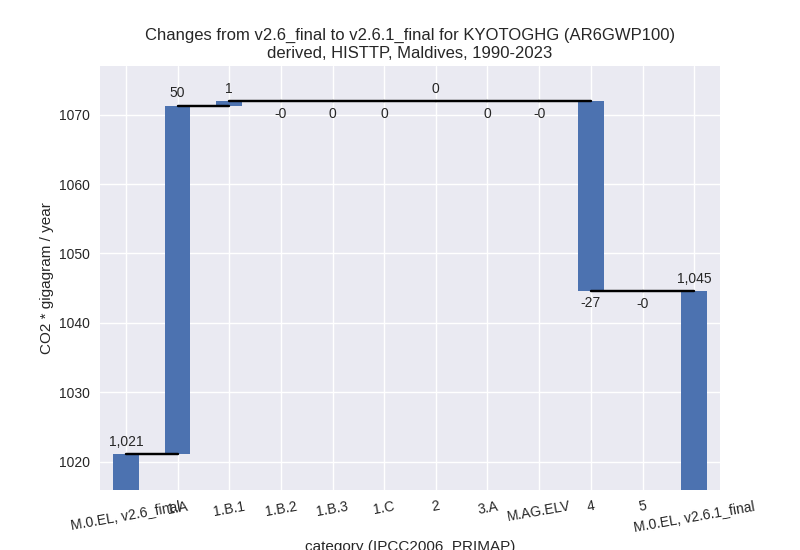
third party scenario
2023
1990-2023
Detailed changes for the scenarios:
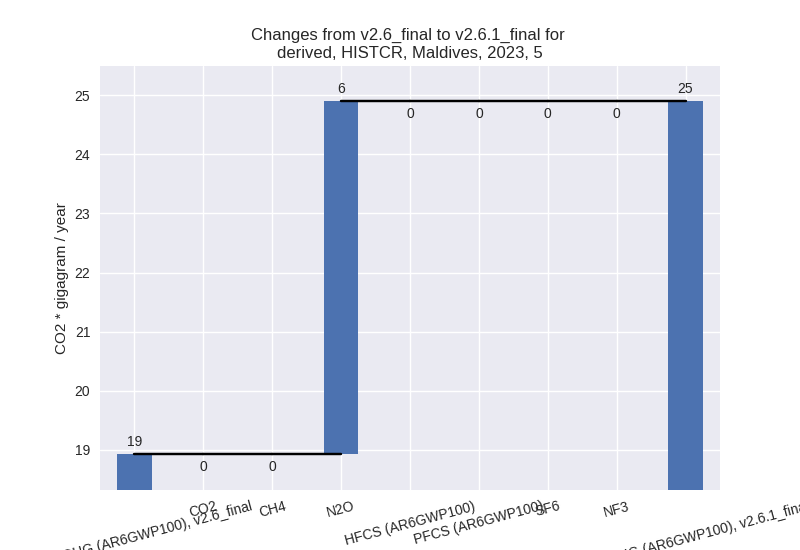
country reported scenario (HISTCR):
Most important changes per time frame
For 2023 the following sector-gas combinations have the highest absolute impact on national total KyotoGHG (AR6GWP100) emissions in 2023 (top 5):
- 1: 1.A, CO2 with -111.30 Gg CO2 / year (-4.9%)
- 2: 4, CO2 with 9.54 Gg CO2 / year (248.3%)
- 3: 5, N2O with 5.97 Gg CO2 / year (31.6%)
- 4: 2, CO2 with -4.90 Gg CO2 / year (-100.0%)
- 5: 1.A, N2O with -4.02 Gg CO2 / year (-23.4%)
For 1990-2023 the following sector-gas combinations have the highest absolute impact on national total KyotoGHG (AR6GWP100) emissions in 1990-2023 (top 5):
- 1: 1.A, CO2 with -15.06 Gg CO2 / year (-1.5%)
- 2: 4, CO2 with 5.60 Gg CO2 / year (260.5%)
- 3: 1.A, N2O with -4.63 Gg CO2 / year (-49.4%)
- 4: 2, CO2 with -3.52 Gg CO2 / year (-100.0%)
- 5: 1.A, CH4 with -3.00 Gg CO2 / year (-56.7%)
Changes in the main sectors for aggregate KyotoGHG (AR6GWP100) are
- 1: Total sectoral emissions in 2022 are 2273.43 Gg
CO2 / year which is 95.3% of M.0.EL emissions. 2023 Emissions have
changed by -5.2% (-121.04 Gg CO2 /
year). 1990-2023 Emissions have changed by -2.4% (-23.97 Gg CO2 / year). For 2023 the
changes per gas
are:
For 1990-2023 the changes per gas are: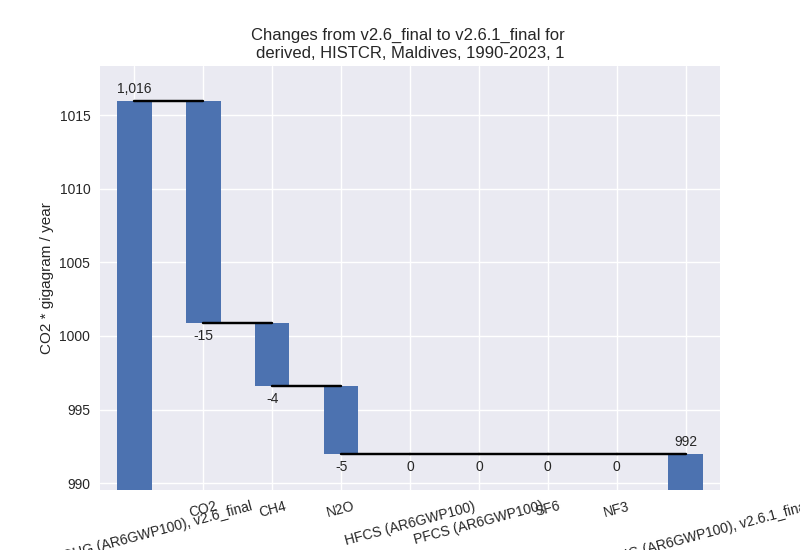
The changes come from the following subsectors:- 1.A: Total sectoral emissions in 2022 are 2273.43
Gg CO2 / year which is 100.0% of category 1 emissions. 2023 Emissions
have changed by -5.1% (-119.18 Gg
CO2 / year). 1990-2023 Emissions have changed by -2.2% (-22.68 Gg CO2 / year). For 2023 the
changes per gas
are:
For 1990-2023 the changes per gas are: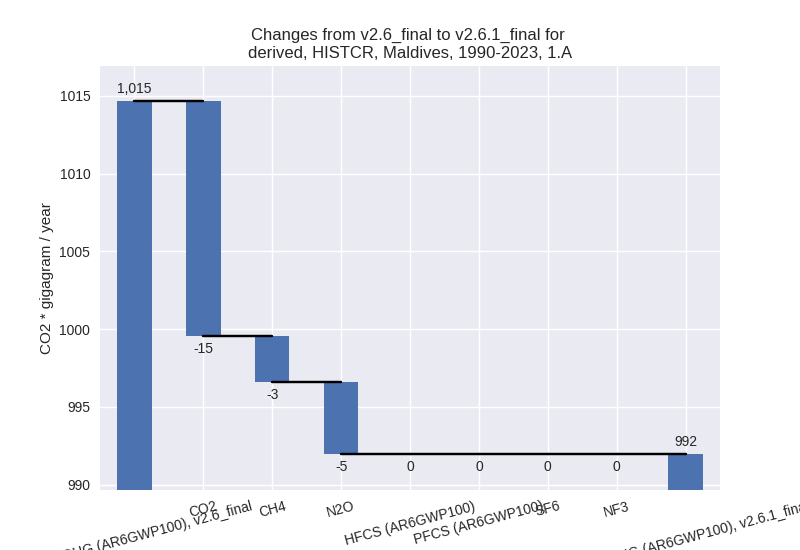
There is no subsector information available in PRIMAP-hist. - 1.B.1: Total sectoral emissions in 2022 are 0.00 Gg
CO2 / year which is 0.0% of category 1 emissions. 2023 Emissions have
changed by -100.0% (-1.81 Gg CO2 /
year). 1990-2023 Emissions have changed by -100.0% (-1.28 Gg CO2 / year). For 2023
the changes per gas
are:

For 1990-2023 the changes per gas are:
There is no subsector information available in PRIMAP-hist. - 1.B.2: Total sectoral emissions in 2022 are 0.00 Gg
CO2 / year which is 0.0% of category 1 emissions. 2023 Emissions have
changed by -100.0% (-0.04 Gg CO2 /
year). 1990-2023 Emissions have changed by -100.0% (-0.01 Gg CO2 / year). For 2023
the changes per gas
are:

For 1990-2023 the changes per gas are: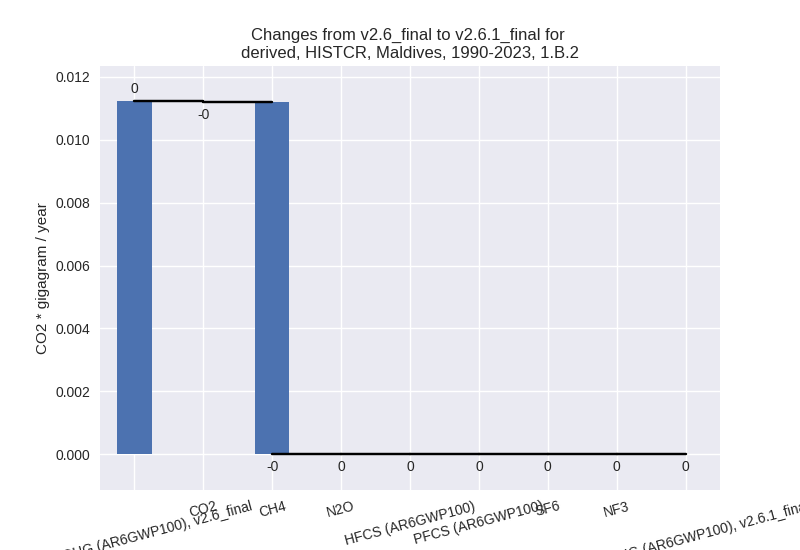
There is no subsector information available in PRIMAP-hist.
- 1.A: Total sectoral emissions in 2022 are 2273.43
Gg CO2 / year which is 100.0% of category 1 emissions. 2023 Emissions
have changed by -5.1% (-119.18 Gg
CO2 / year). 1990-2023 Emissions have changed by -2.2% (-22.68 Gg CO2 / year). For 2023 the
changes per gas
are:
- 2: Total sectoral emissions in 2022 are 0.04 Gg CO2
/ year which is 0.0% of M.0.EL emissions. 2023 Emissions have changed by
-99.2% (-4.90 Gg CO2 / year).
1990-2023 Emissions have changed by -99.2% (-3.52 Gg CO2 / year). For 2023 the
changes per gas
are:
For 1990-2023 the changes per gas are: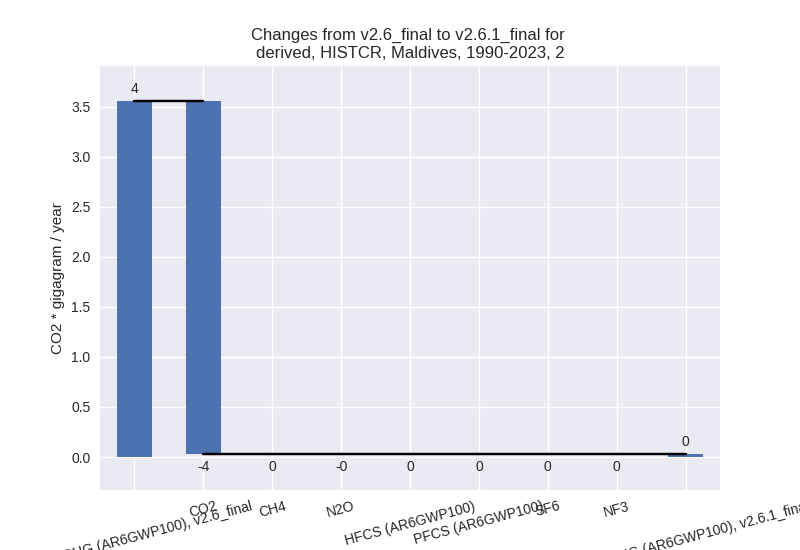
- M.AG: Total sectoral emissions in 2022 are 0.00 Gg
CO2 / year which is 0.0% of M.0.EL emissions. 2023 Emissions have
changed by -100.0% (-1.11 Gg CO2 /
year). 1990-2023 Emissions have changed by -100.0% (-0.69 Gg CO2 / year). For 2023
the changes per gas
are:
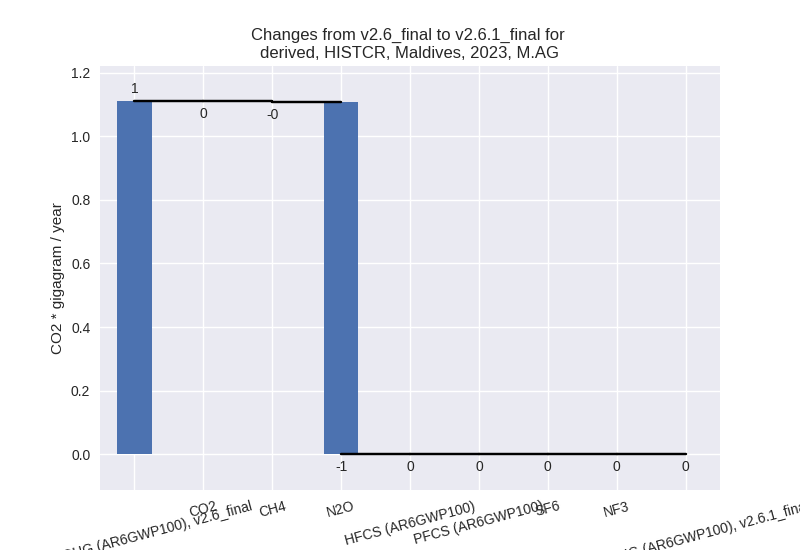
For 1990-2023 the changes per gas are:
The changes come from the following subsectors:- M.AG.ELV: Total sectoral emissions in 2022 are 0.00
Gg CO2 / year which is nan% of category M.AG emissions. 2023 Emissions
have changed by -100.0% (-1.11 Gg
CO2 / year). 1990-2023 Emissions have changed by -100.0% (-0.69 Gg CO2 / year). For 2023
the changes per gas
are:

For 1990-2023 the changes per gas are:
There is no subsector information available in PRIMAP-hist.
- M.AG.ELV: Total sectoral emissions in 2022 are 0.00
Gg CO2 / year which is nan% of category M.AG emissions. 2023 Emissions
have changed by -100.0% (-1.11 Gg
CO2 / year). 1990-2023 Emissions have changed by -100.0% (-0.69 Gg CO2 / year). For 2023
the changes per gas
are:
- 4: Total sectoral emissions in 2022 are 86.68 Gg
CO2 / year which is 3.6% of M.0.EL emissions. 2023 Emissions have
changed by 12.7% (10.00 Gg CO2 /
year). 1990-2023 Emissions have changed by 18.9% (9.03 Gg CO2 / year). For 2023 the
changes per gas
are:
For 1990-2023 the changes per gas are: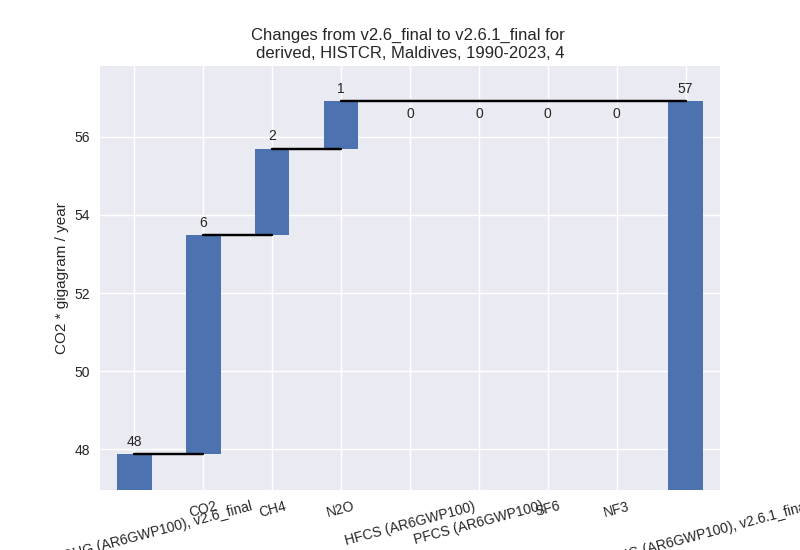
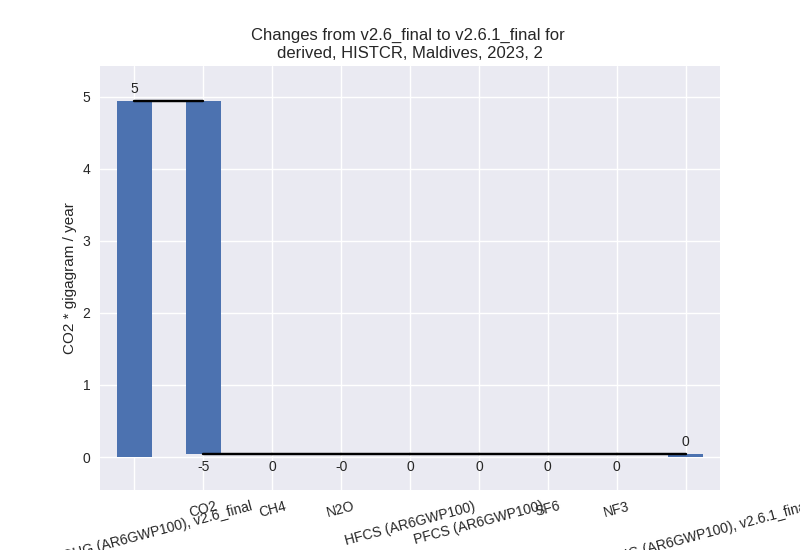
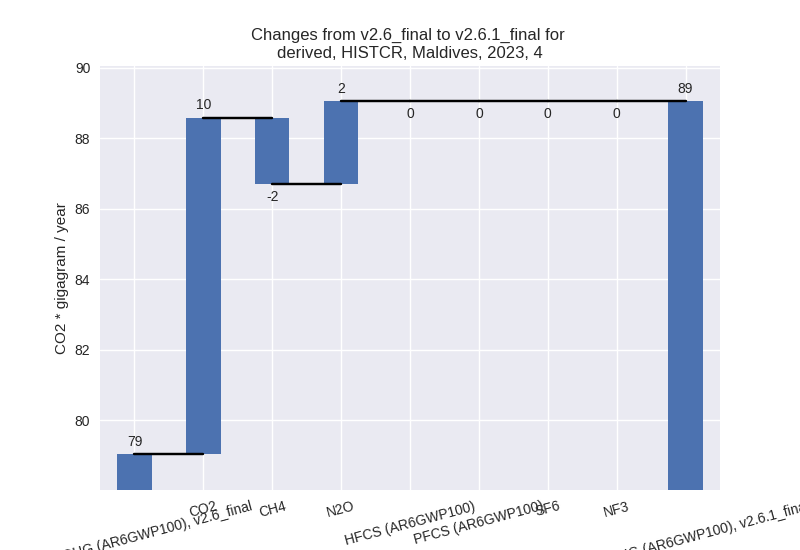
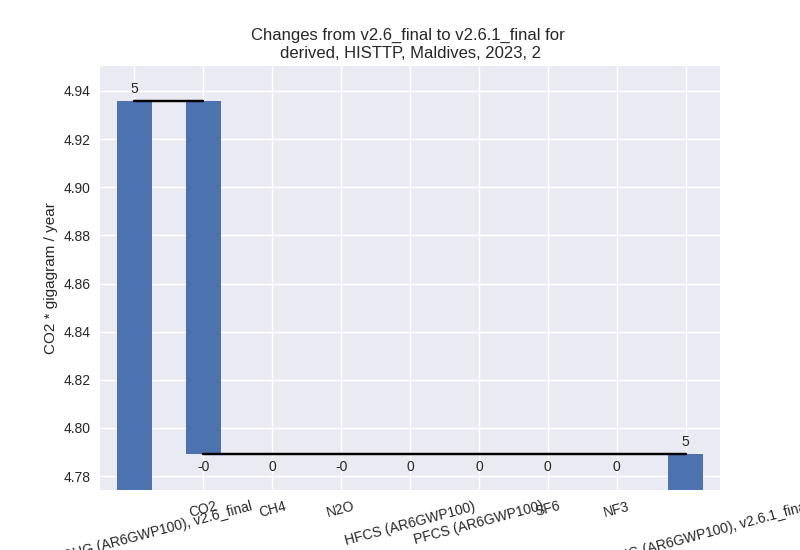
- 5: Total sectoral emissions in 2022 are 24.29 Gg
CO2 / year which is 1.0% of M.0.EL emissions. 2023 Emissions have
changed by 31.6% (5.97 Gg CO2 /
year). 1990-2023 Emissions have changed by -0.8% (-0.09 Gg CO2 / year). For 2023 the
changes per gas
are:
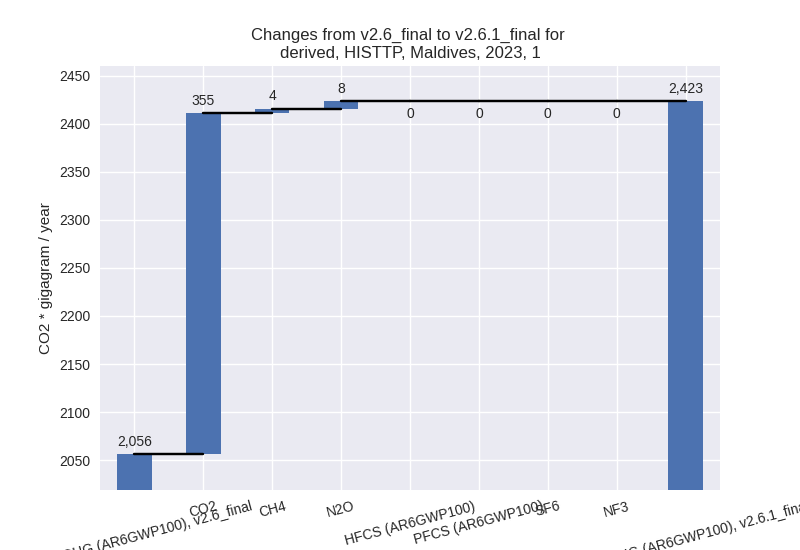
third party scenario (HISTTP):
Most important changes per time frame
For 2023 the following sector-gas combinations have the highest absolute impact on national total KyotoGHG (AR6GWP100) emissions in 2023 (top 5):
- 1: 1.A, CO2 with 354.62 Gg CO2 / year (17.5%)
- 2: 4, CH4 with -40.57 Gg CO2 / year (-22.5%)
- 3: 1.A, N2O with 7.89 Gg CO2 / year (45.9%)
- 4: 5, N2O with 5.97 Gg CO2 / year (31.6%)
- 5: 1.A, CH4 with 3.78 Gg CO2 / year (43.5%)
For 1990-2023 the following sector-gas combinations have the highest absolute impact on national total KyotoGHG (AR6GWP100) emissions in 1990-2023 (top 5):
- 1: 1.A, CO2 with 48.71 Gg CO2 / year (5.5%)
- 2: 4, CH4 with -28.61 Gg CO2 / year (-28.0%)
- 3: 4, N2O with 1.33 Gg CO2 / year (27.9%)
- 4: 1.A, N2O with 1.08 Gg CO2 / year (11.5%)
- 5: 1.B.1, CH4 with 0.59 Gg CO2 / year (47.0%)
Changes in the main sectors for aggregate KyotoGHG (AR6GWP100) are
- 1: Total sectoral emissions in 2022 are 2649.85 Gg
CO2 / year which is 93.7% of M.0.EL emissions. 2023 Emissions have
changed by 17.8% (366.97 Gg CO2 /
year). 1990-2023 Emissions have changed by 5.7% (50.87 Gg CO2 / year). For 2023 the
changes per gas
are:
For 1990-2023 the changes per gas are: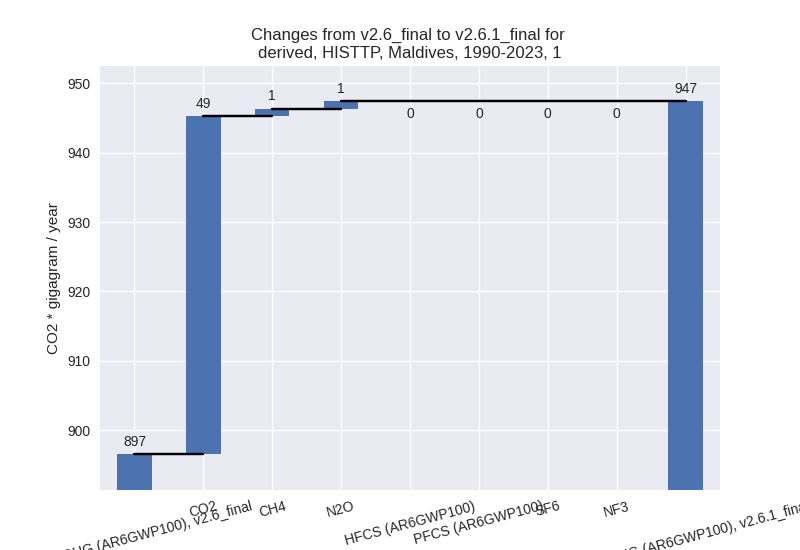
The changes come from the following subsectors:- 1.A: Total sectoral emissions in 2022 are 2647.31
Gg CO2 / year which is 99.9% of category 1 emissions. 2023 Emissions
have changed by 17.8% (366.29 Gg CO2
/ year). 1990-2023 Emissions have changed by 5.6% (50.27 Gg CO2 / year). For 2023 the
changes per gas
are:

For 1990-2023 the changes per gas are: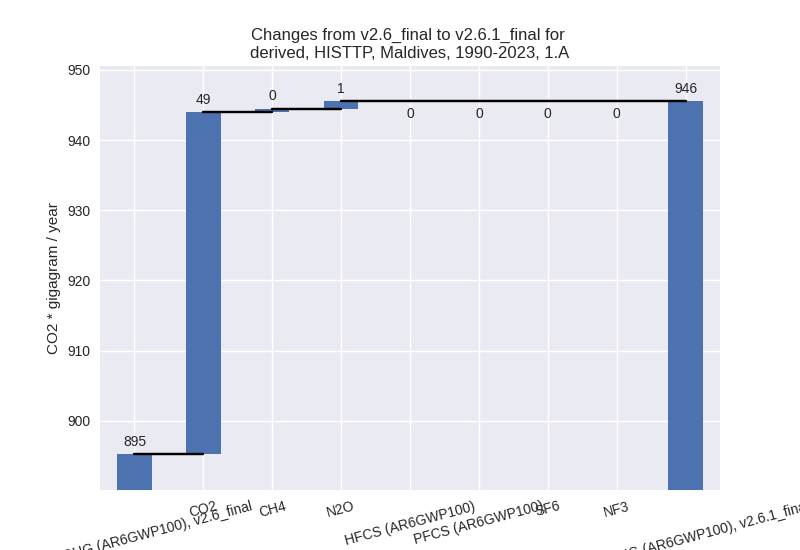
There is no subsector information available in PRIMAP-hist. - 1.B.1: Total sectoral emissions in 2022 are 2.51 Gg
CO2 / year which is 0.1% of category 1 emissions. 2023 Emissions have
changed by 38.2% (0.69 Gg CO2 /
year). 1990-2023 Emissions have changed by 47.0% (0.60 Gg CO2 / year). For 2023 the
changes per gas
are:
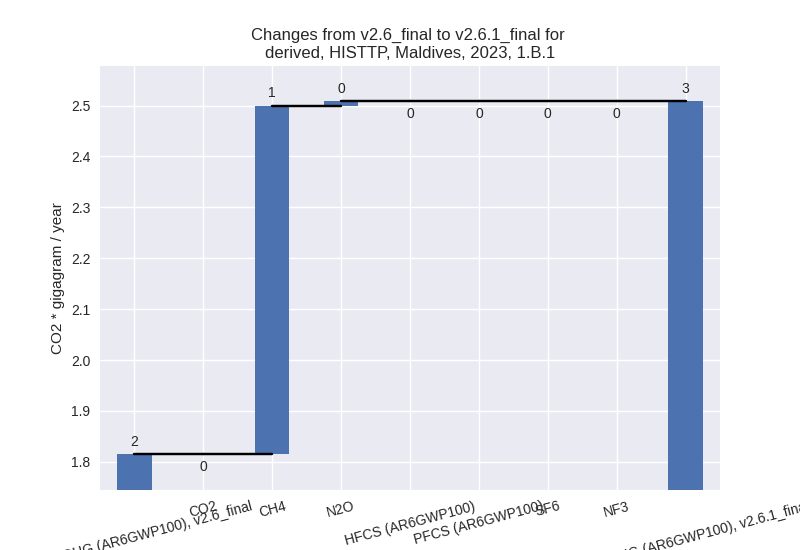
For 1990-2023 the changes per gas are:
There is no subsector information available in PRIMAP-hist. - 1.B.2: Total sectoral emissions in 2022 are 0.03 Gg
CO2 / year which is 0.0% of category 1 emissions. 2023 Emissions have
changed by -24.8% (-0.01 Gg CO2 /
year). 1990-2023 Emissions have changed by -8.1% (-0.00 Gg CO2 / year). For 2023 the
changes per gas
are:

For 1990-2023 the changes per gas are: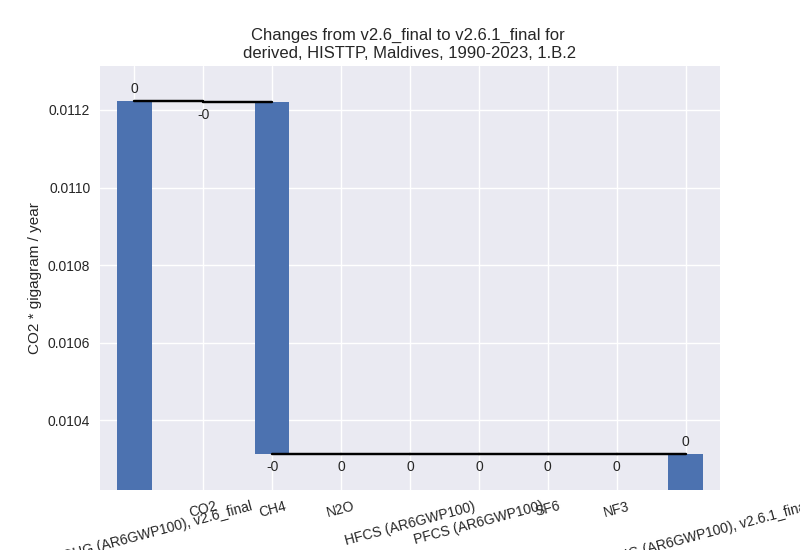
There is no subsector information available in PRIMAP-hist.
- 1.A: Total sectoral emissions in 2022 are 2647.31
Gg CO2 / year which is 99.9% of category 1 emissions. 2023 Emissions
have changed by 17.8% (366.29 Gg CO2
/ year). 1990-2023 Emissions have changed by 5.6% (50.27 Gg CO2 / year). For 2023 the
changes per gas
are:
- 2: Total sectoral emissions in 2022 are 5.28 Gg CO2
/ year which is 0.2% of M.0.EL emissions. 2023 Emissions have changed by
-3.0% (-0.15 Gg CO2 / year).
1990-2023 Emissions have changed by 0.6% (0.02 Gg CO2 / year). For 2023 the
changes per gas
are:
- M.AG: Total sectoral emissions in 2022 are 0.99 Gg
CO2 / year which is 0.0% of M.0.EL emissions. 2023 Emissions have
changed by -10.8% (-0.12 Gg CO2 /
year). 1990-2023 Emissions have changed by -2.8% (-0.02 Gg CO2 / year). For 2023 the
changes per gas
are:

For 1990-2023 the changes per gas are: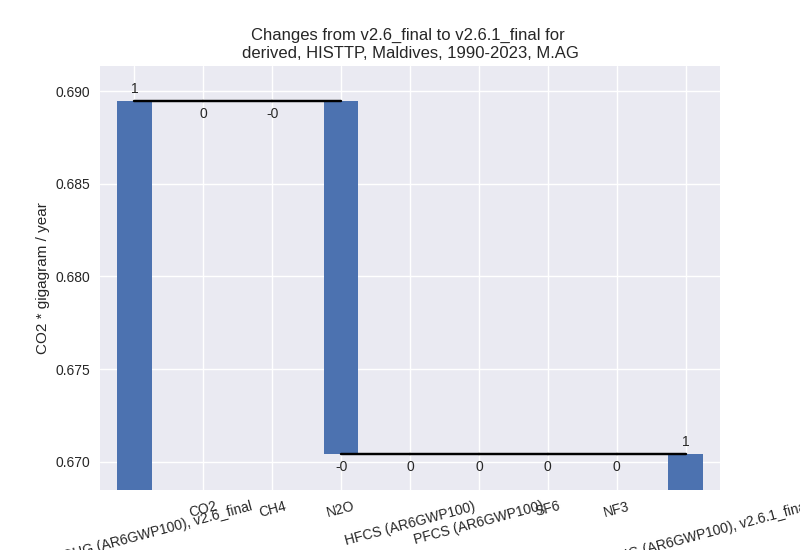
The changes come from the following subsectors:- M.AG.ELV: Total sectoral emissions in 2022 are 0.99
Gg CO2 / year which is 100.0% of category M.AG emissions. 2023 Emissions
have changed by -10.8% (-0.12 Gg CO2
/ year). 1990-2023 Emissions have changed by -2.8% (-0.02 Gg CO2 / year). For 2023 the
changes per gas
are:

For 1990-2023 the changes per gas are:
There is no subsector information available in PRIMAP-hist.
- M.AG.ELV: Total sectoral emissions in 2022 are 0.99
Gg CO2 / year which is 100.0% of category M.AG emissions. 2023 Emissions
have changed by -10.8% (-0.12 Gg CO2
/ year). 1990-2023 Emissions have changed by -2.8% (-0.02 Gg CO2 / year). For 2023 the
changes per gas
are:
- 4: Total sectoral emissions in 2022 are 147.03 Gg
CO2 / year which is 5.2% of M.0.EL emissions. 2023 Emissions have
changed by -20.8% (-39.75 Gg CO2 /
year). 1990-2023 Emissions have changed by -25.0% (-27.28 Gg CO2 / year). For 2023
the changes per gas
are:
For 1990-2023 the changes per gas are: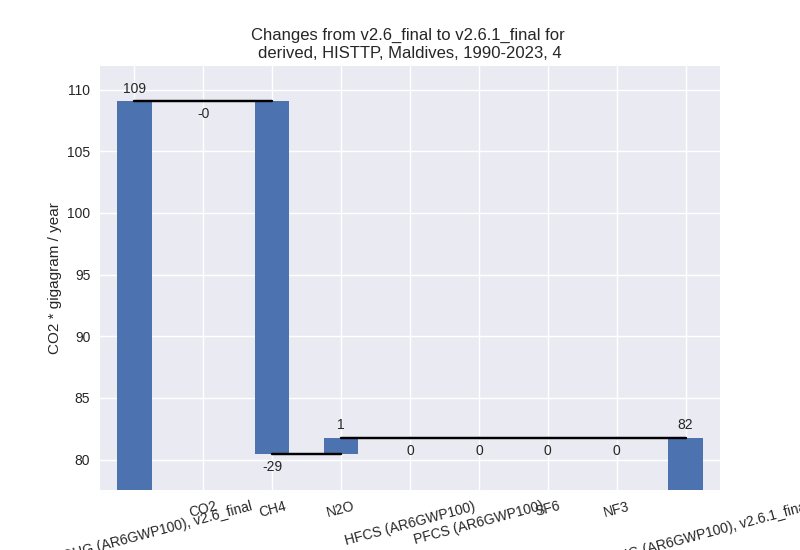
- 5: Total sectoral emissions in 2022 are 24.29 Gg
CO2 / year which is 0.9% of M.0.EL emissions. 2023 Emissions have
changed by 31.6% (5.97 Gg CO2 /
year). 1990-2023 Emissions have changed by -0.8% (-0.09 Gg CO2 / year). For 2023 the
changes per gas
are:
