Changes in PRIMAP-hist v2.6.1_final compared to v2.6_final for Mexico
2025-03-19
Johannes Gütschow
Change analysis for Mexico for PRIMAP-hist v2.6.1_final compared to v2.6_final
Overview over emissions by sector and gas
The following figures show the aggregate national total emissions excluding LULUCF AR6GWP100 for the country reported priority scenario. The dotted linesshow the v2.6_final data.
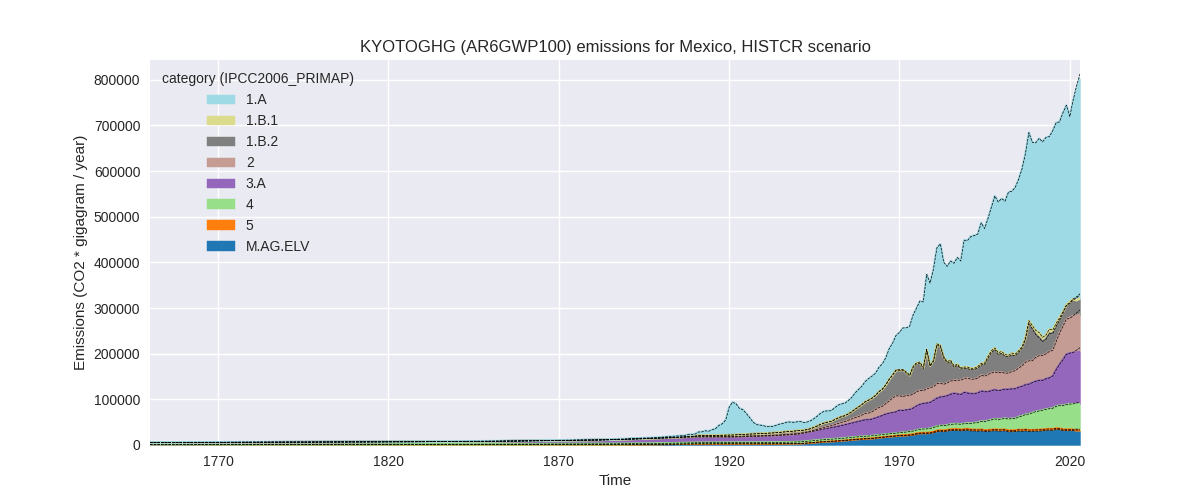
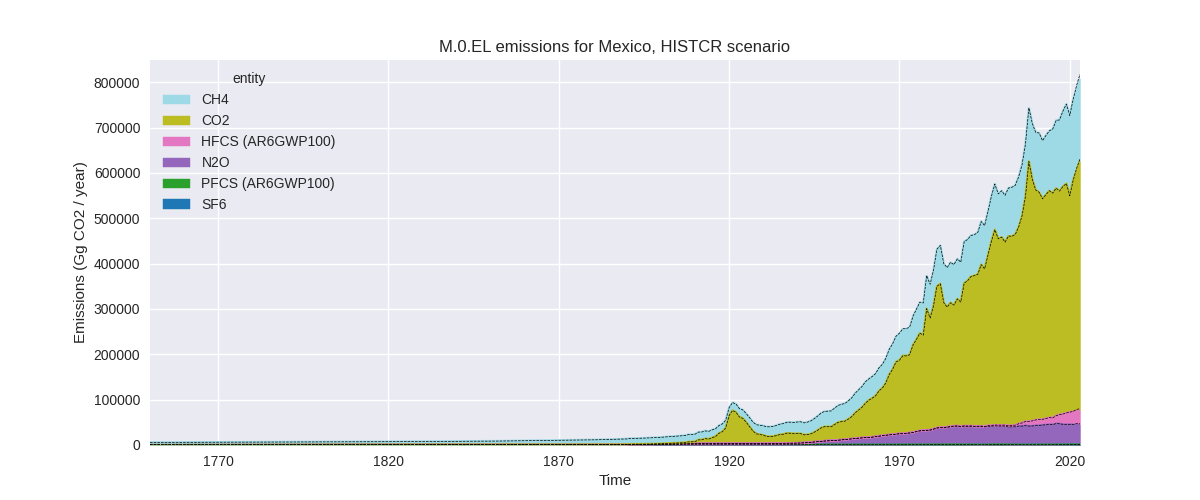
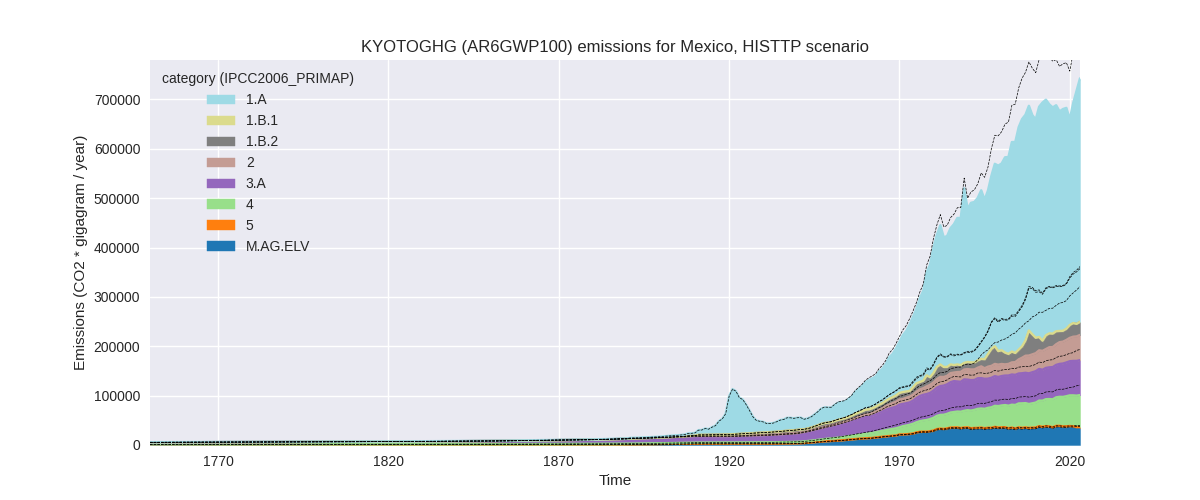
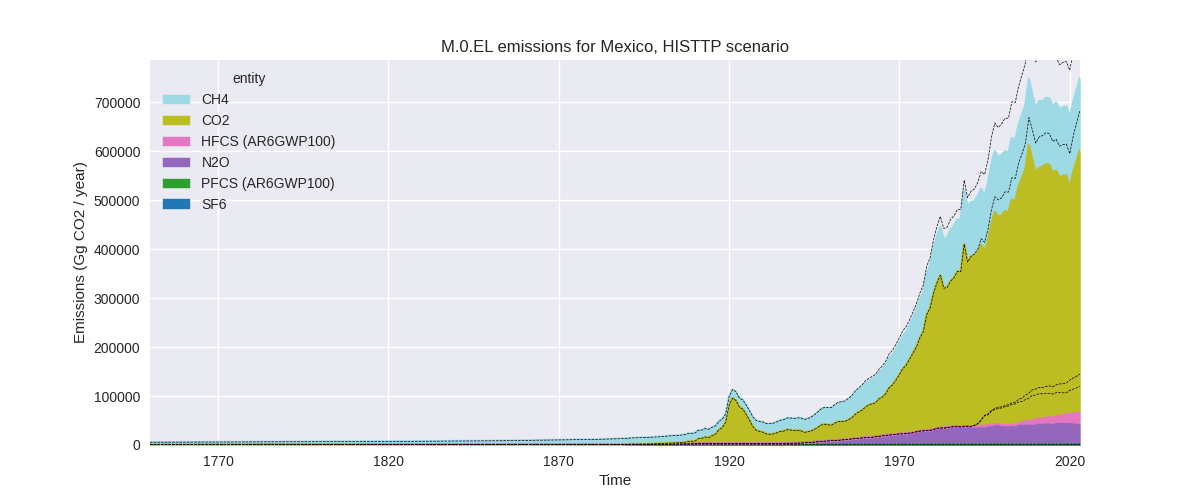
The following figures show the aggregate national total emissions excluding LULUCF AR6GWP100 for the third party priority scenario. The dotted linesshow the v2.6_final data.
Overview over changes
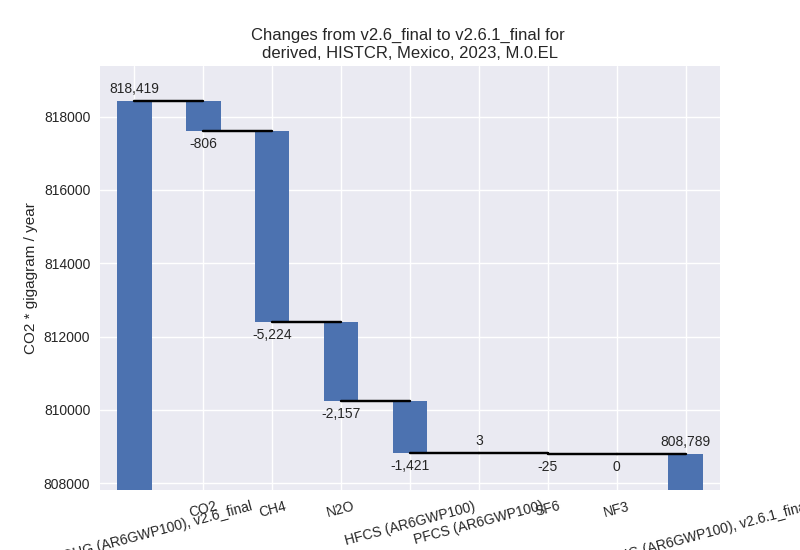
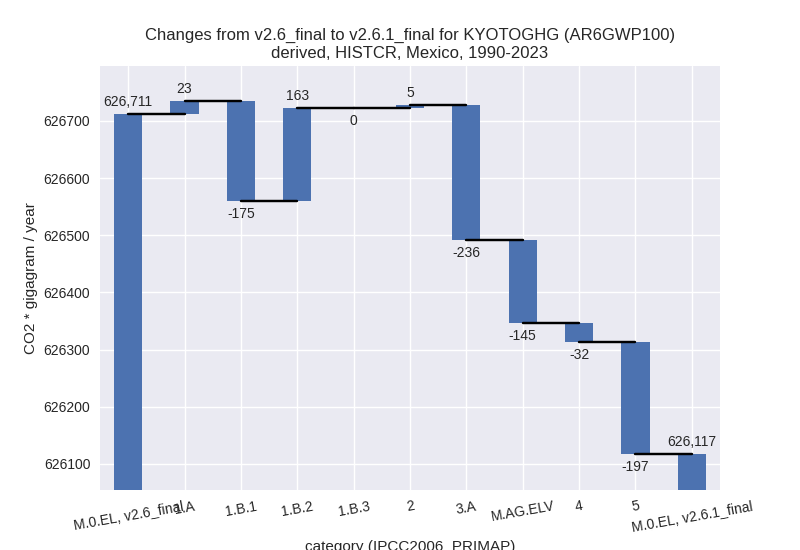
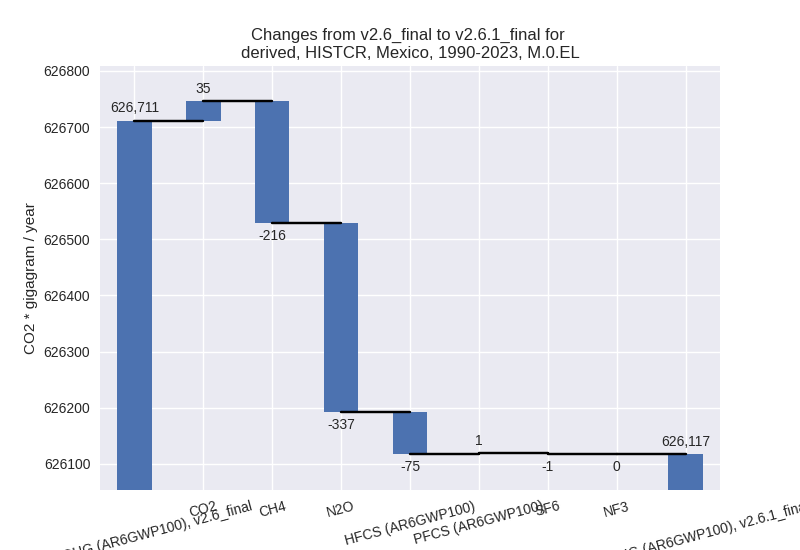
In the country reported priority scenario we have the following changes for aggregate Kyoto GHG and national total emissions excluding LULUCF (M.0.EL):
- Emissions in 2023 have changed by -1.2%% (-9629.80 Gg CO2 / year)
- Emissions in 1990-2023 have changed by -0.1%% (-594.27 Gg CO2 / year)
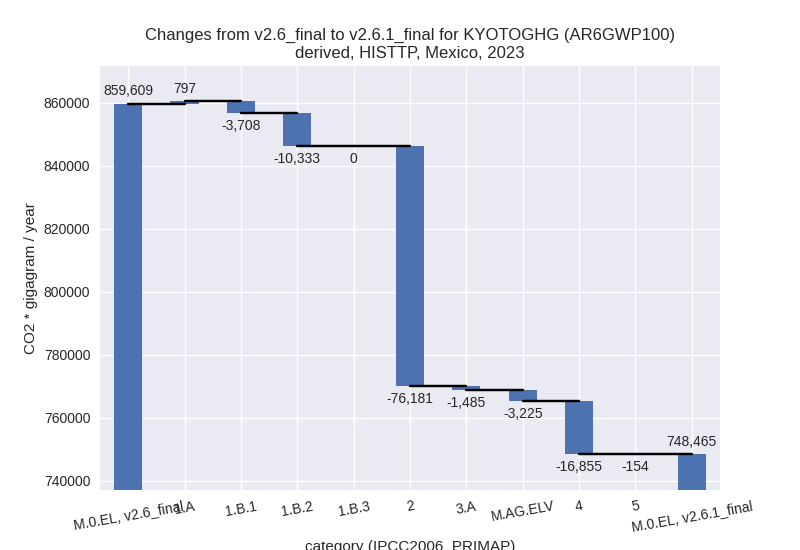
In the third party priority scenario we have the following changes for aggregate Kyoto GHG and national total emissions excluding LULUCF (M.0.EL):
- Emissions in 2023 have changed by -12.9%% (-111144.40 Gg CO2 / year)
- Emissions in 1990-2023 have changed by -10.5%% (-74834.82 Gg CO2 / year)
Most important changes per scenario and time frame
In the country reported priority scenario the following sector-gas combinations have the highest absolute impact on national total KyotoGHG (AR6GWP100) emissions in 2023 (top 5):
- 1: 3.A, CH4 with -5392.90 Gg CO2 / year (-4.9%)
- 2: 1.B.2, CH4 with 1995.02 Gg CO2 / year (12.1%)
- 3: M.AG.ELV, N2O with -1990.73 Gg CO2 / year (-6.8%)
- 4: 2, HFCS (AR6GWP100) with -1421.36 Gg CO2 / year (-4.2%)
- 5: 1.B.1, CH4 with -1397.23 Gg CO2 / year (-85.4%)
In the country reported priority scenario the following sector-gas combinations have the highest absolute impact on national total KyotoGHG (AR6GWP100) emissions in 1990-2023 (top 5):
- 1: 3.A, CH4 with -219.64 Gg CO2 / year (-0.3%)
- 2: 5, N2O with -196.72 Gg CO2 / year (-7.7%)
- 3: 1.B.2, CH4 with 163.22 Gg CO2 / year (1.1%)
- 4: 1.B.1, CH4 with -144.18 Gg CO2 / year (-3.2%)
- 5: M.AG.ELV, N2O with -127.03 Gg CO2 / year (-0.4%)
In the third party priority scenario the following sector-gas combinations have the highest absolute impact on national total KyotoGHG (AR6GWP100) emissions in 2023 (top 5):
- 1: 2, N2O with -75827.17 Gg CO2 / year (-99.1%)
- 2: 4, CH4 with -16895.25 Gg CO2 / year (-21.4%)
- 3: 1.B.2, CH4 with -10322.72 Gg CO2 / year (-46.7%)
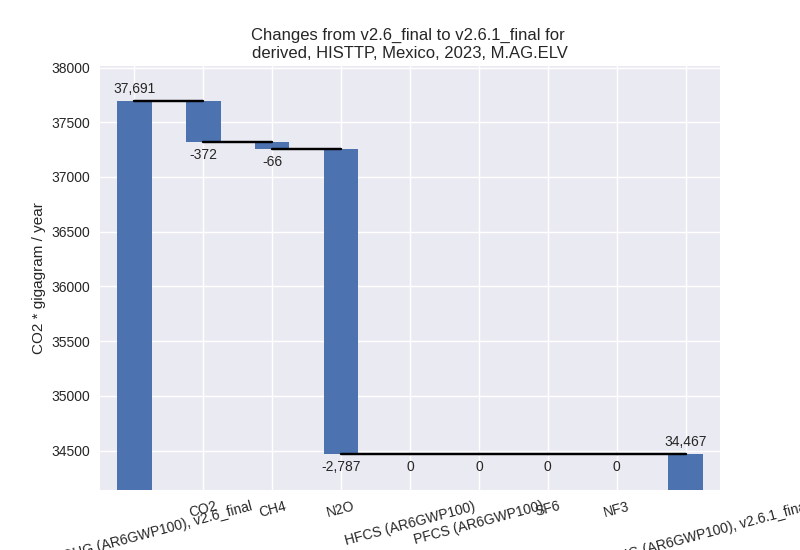
- 4: M.AG.ELV, N2O with -2786.69 Gg CO2 / year (-8.3%)
- 5: 1.B.1, CO2 with -2406.30 Gg CO2 / year (-90.3%)
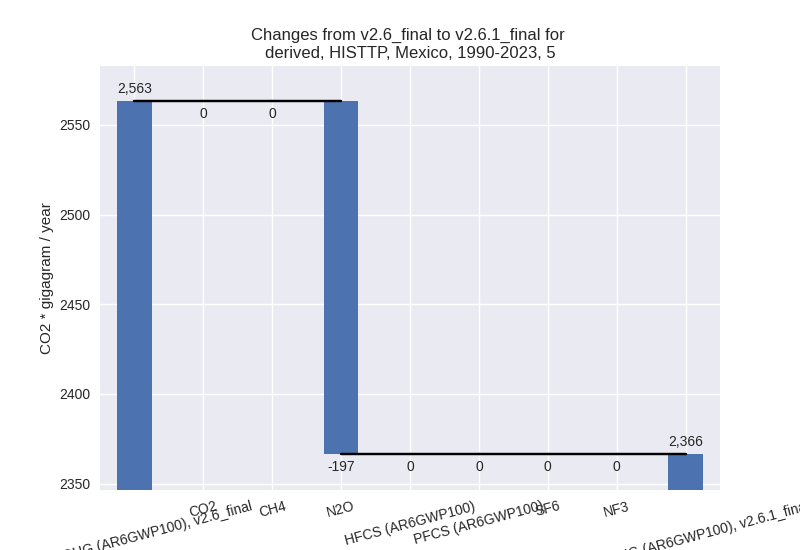
In the third party priority scenario the following sector-gas combinations have the highest absolute impact on national total KyotoGHG (AR6GWP100) emissions in 1990-2023 (top 5):
- 1: 2, N2O with -46062.80 Gg CO2 / year (-98.0%)
- 2: 1.B.2, CH4 with -14867.09 Gg CO2 / year (-51.8%)
- 3: 4, CH4 with -13159.99 Gg CO2 / year (-21.7%)
- 4: 1.B.1, CO2 with -203.59 Gg CO2 / year (-25.8%)
- 5: 5, N2O with -196.72 Gg CO2 / year (-7.7%)
Notes on data changes
Here we list notes explaining important emissions changes for the country.
- No new country reported data has been included. Changes in the CR time-series are small and come from updated third party data (EDGAR, FAO) which is used to extrapolate the country reported data.
- The main change in the TP time-series is a 98% reduction in N2O from
chemical industry. This comes directly from EDGAR data. New EDGAR data
is in line with country reported data while old EDGAR data was higher by
a factor of roughly 50.
- Further high changes come from EDGAR as well: fugitive and waste CH4
- Lower N2O in M.AG.ELV come from a decline in emission for 2022 in FAO data.
Changes by sector and gas
For each scenario and time frame the changes are displayed for all individual sectors and all individual gases. In the sector plot we use aggregate Kyoto GHGs in AR6GWP100. In the gas plot we usenational total emissions without LULUCF.
country reported scenario
2023
1990-2023
third party scenario
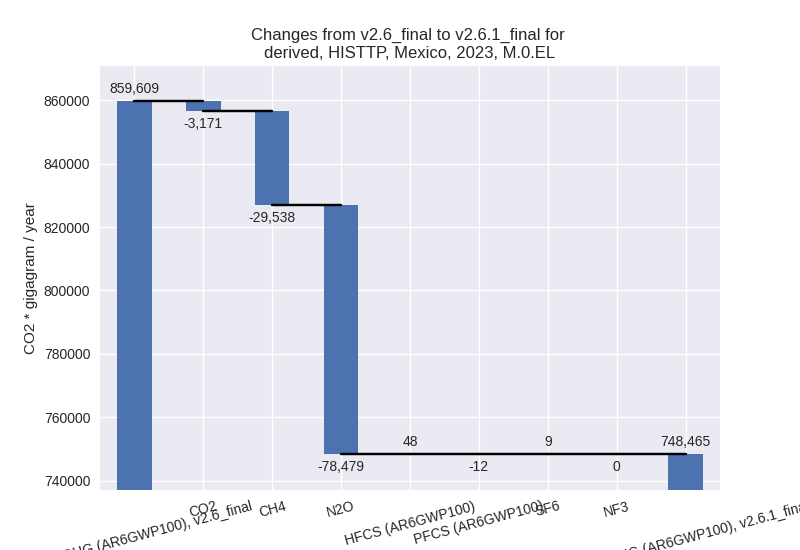
2023
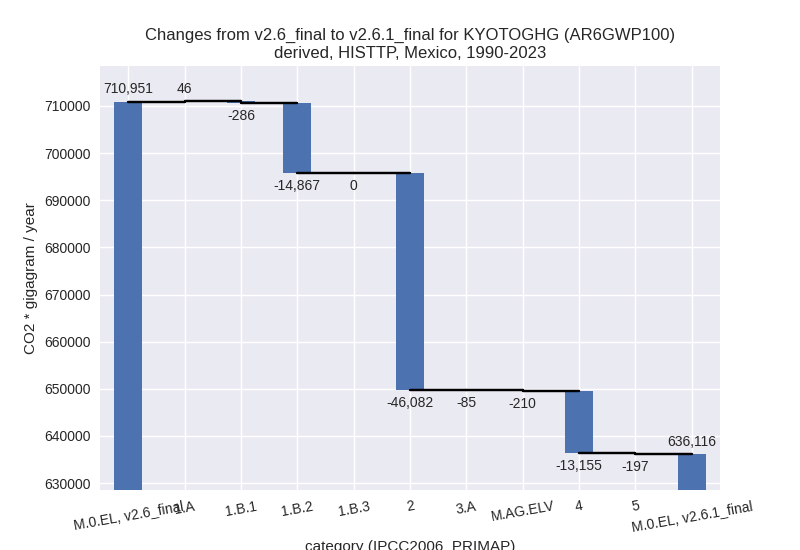
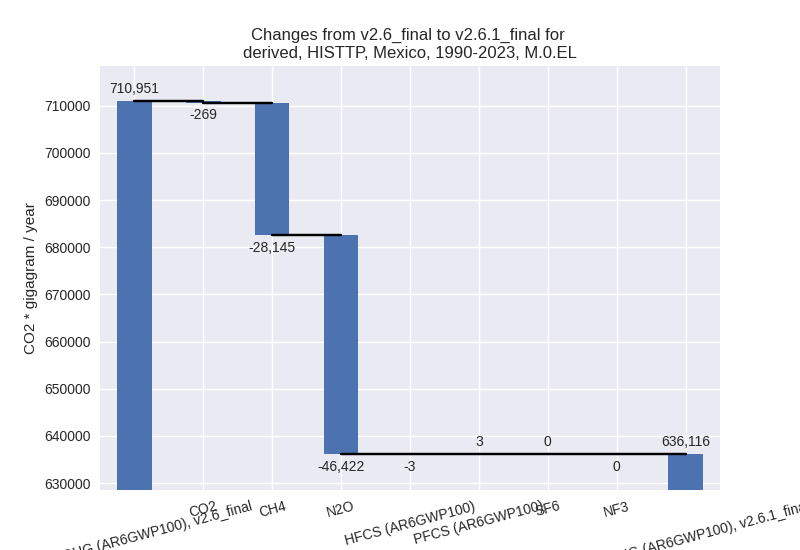
1990-2023
Detailed changes for the scenarios:
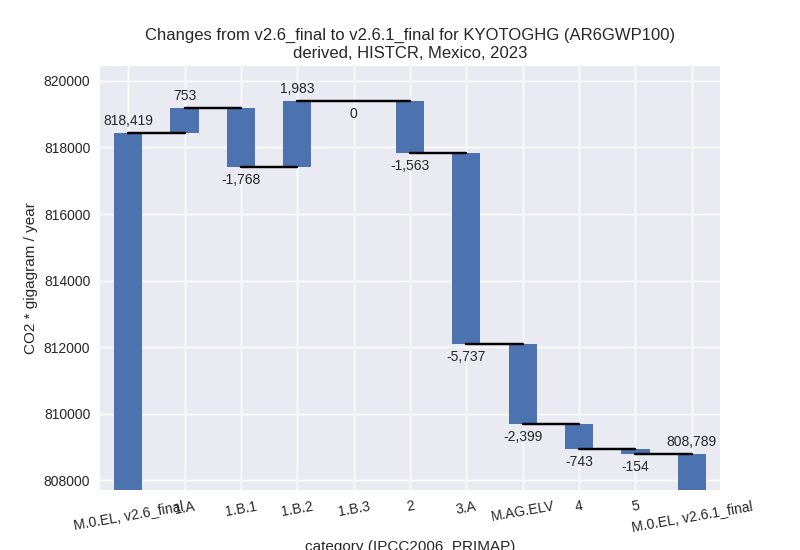
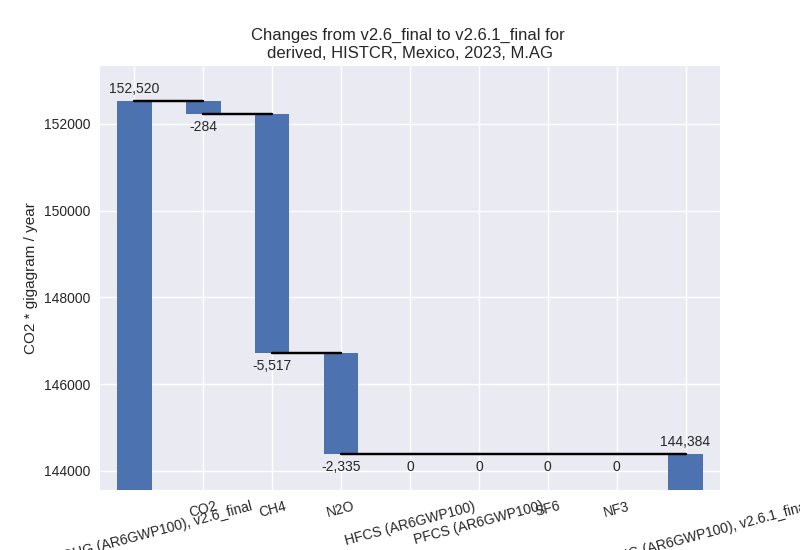
country reported scenario (HISTCR):
Most important changes per time frame
For 2023 the following sector-gas combinations have the highest absolute impact on national total KyotoGHG (AR6GWP100) emissions in 2023 (top 5):
- 1: 3.A, CH4 with -5392.90 Gg CO2 / year (-4.9%)
- 2: 1.B.2, CH4 with 1995.02 Gg CO2 / year (12.1%)
- 3: M.AG.ELV, N2O with -1990.73 Gg CO2 / year (-6.8%)
- 4: 2, HFCS (AR6GWP100) with -1421.36 Gg CO2 / year (-4.2%)
- 5: 1.B.1, CH4 with -1397.23 Gg CO2 / year (-85.4%)
For 1990-2023 the following sector-gas combinations have the highest absolute impact on national total KyotoGHG (AR6GWP100) emissions in 1990-2023 (top 5):
- 1: 3.A, CH4 with -219.64 Gg CO2 / year (-0.3%)
- 2: 5, N2O with -196.72 Gg CO2 / year (-7.7%)
- 3: 1.B.2, CH4 with 163.22 Gg CO2 / year (1.1%)
- 4: 1.B.1, CH4 with -144.18 Gg CO2 / year (-3.2%)
- 5: M.AG.ELV, N2O with -127.03 Gg CO2 / year (-0.4%)
Changes in the main sectors for aggregate KyotoGHG (AR6GWP100) are
- 1: Total sectoral emissions in 2022 are 502363.24 Gg CO2 / year which is 64.0% of M.0.EL emissions. 2023 Emissions have changed by 0.2% (966.78 Gg CO2 / year). 1990-2023 Emissions have changed by 0.0% (10.74 Gg CO2 / year).
- 2: Total sectoral emissions in 2022 are 80750.37 Gg CO2 / year which is 10.3% of M.0.EL emissions. 2023 Emissions have changed by -1.9% (-1563.40 Gg CO2 / year). 1990-2023 Emissions have changed by 0.0% (4.97 Gg CO2 / year).
- M.AG: Total sectoral emissions in 2022 are
143600.91 Gg CO2 / year which is 18.3% of M.0.EL emissions. 2023
Emissions have changed by -5.3%
(-8135.95 Gg CO2 / year). 1990-2023 Emissions have changed by -0.4% (-381.21 Gg CO2 / year). For 2023
the changes per gas
are:
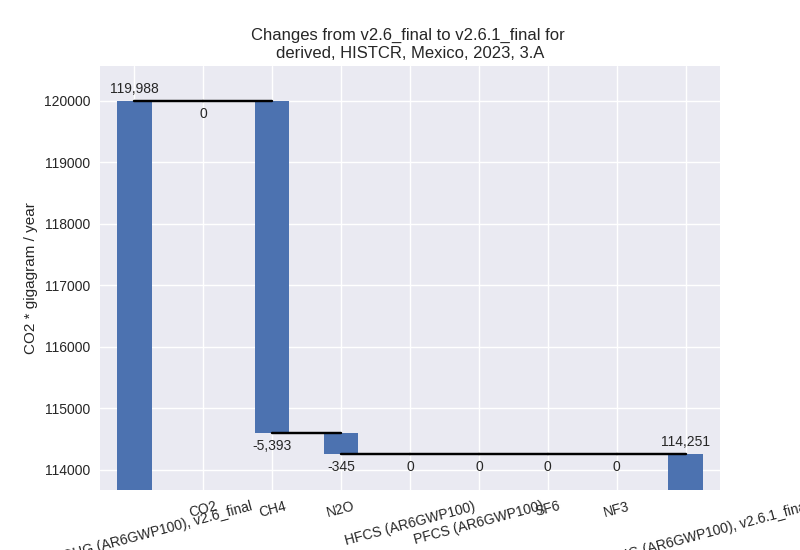
The changes come from the following subsectors:- 3.A: Total sectoral emissions in 2022 are 113467.29
Gg CO2 / year which is 79.0% of category M.AG emissions. 2023 Emissions
have changed by -4.8% (-5737.44 Gg
CO2 / year). 1990-2023 Emissions have changed by -0.3% (-235.88 Gg CO2 / year). For 2023
the changes per gas
are:
There is no subsector information available in PRIMAP-hist. - M.AG.ELV: Total sectoral emissions in 2022 are
30133.63 Gg CO2 / year which is 21.0% of category M.AG emissions. 2023
Emissions have changed by -7.4%
(-2398.51 Gg CO2 / year). 1990-2023 Emissions have changed by -0.5% (-145.33 Gg CO2 / year). For 2023
the changes per gas
are:

There is no subsector information available in PRIMAP-hist.
- 3.A: Total sectoral emissions in 2022 are 113467.29
Gg CO2 / year which is 79.0% of category M.AG emissions. 2023 Emissions
have changed by -4.8% (-5737.44 Gg
CO2 / year). 1990-2023 Emissions have changed by -0.3% (-235.88 Gg CO2 / year). For 2023
the changes per gas
are:
- 4: Total sectoral emissions in 2022 are 57010.30 Gg CO2 / year which is 7.3% of M.0.EL emissions. 2023 Emissions have changed by -1.3% (-743.44 Gg CO2 / year). 1990-2023 Emissions have changed by -0.1% (-32.05 Gg CO2 / year).
- 5: Total sectoral emissions in 2022 are 1760.22 Gg
CO2 / year which is 0.2% of M.0.EL emissions. 2023 Emissions have
changed by -7.7% (-153.80 Gg CO2 /
year). 1990-2023 Emissions have changed by -7.7% (-196.72 Gg CO2 / year). For 2023
the changes per gas
are:

For 1990-2023 the changes per gas are:
third party scenario (HISTTP):
Most important changes per time frame
For 2023 the following sector-gas combinations have the highest absolute impact on national total KyotoGHG (AR6GWP100) emissions in 2023 (top 5):
- 1: 2, N2O with -75827.17 Gg CO2 / year (-99.1%)
- 2: 4, CH4 with -16895.25 Gg CO2 / year (-21.4%)
- 3: 1.B.2, CH4 with -10322.72 Gg CO2 / year (-46.7%)
- 4: M.AG.ELV, N2O with -2786.69 Gg CO2 / year (-8.3%)
- 5: 1.B.1, CO2 with -2406.30 Gg CO2 / year (-90.3%)
For 1990-2023 the following sector-gas combinations have the highest absolute impact on national total KyotoGHG (AR6GWP100) emissions in 1990-2023 (top 5):
- 1: 2, N2O with -46062.80 Gg CO2 / year (-98.0%)
- 2: 1.B.2, CH4 with -14867.09 Gg CO2 / year (-51.8%)
- 3: 4, CH4 with -13159.99 Gg CO2 / year (-21.7%)
- 4: 1.B.1, CO2 with -203.59 Gg CO2 / year (-25.8%)
- 5: 5, N2O with -196.72 Gg CO2 / year (-7.7%)
Changes in the main sectors for aggregate KyotoGHG (AR6GWP100) are
- 1: Total sectoral emissions in 2022 are 504391.69
Gg CO2 / year which is 69.6% of M.0.EL emissions. 2023 Emissions have
changed by -2.5% (-13244.90 Gg CO2 /
year). 1990-2023 Emissions have changed by -3.2% (-15107.11 Gg CO2 / year). For 2023
the changes per gas
are:
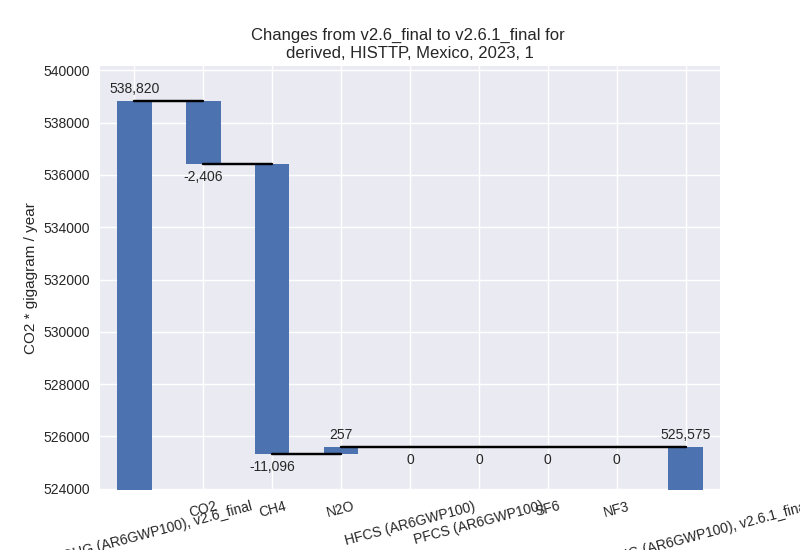
For 1990-2023 the changes per gas are:
The changes come from the following subsectors:- 1.A: Total sectoral emissions in 2022 are 472528.48 Gg CO2 / year which is 94.9% of category 1 emissions. 2023 Emissions have changed by 0.2% (796.80 Gg CO2 / year). 1990-2023 Emissions have changed by 0.0% (45.86 Gg CO2 / year).
- 1.B.1: Total sectoral emissions in 2022 are 378.97
Gg CO2 / year which is 0.1% of category 1 emissions. 2023 Emissions have
changed by -89.7% (-3708.37 Gg CO2 /
year). 1990-2023 Emissions have changed by -12.6% (-285.67 Gg CO2 / year). For 2023
the changes per gas
are:
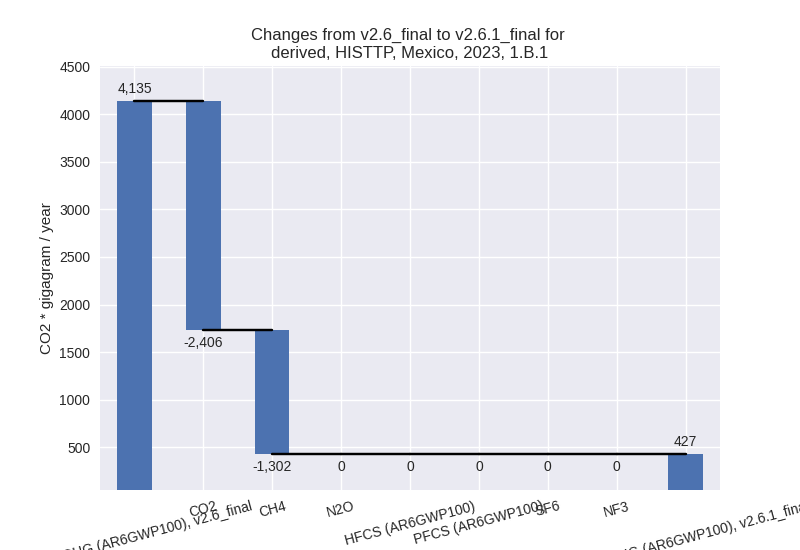
For 1990-2023 the changes per gas are: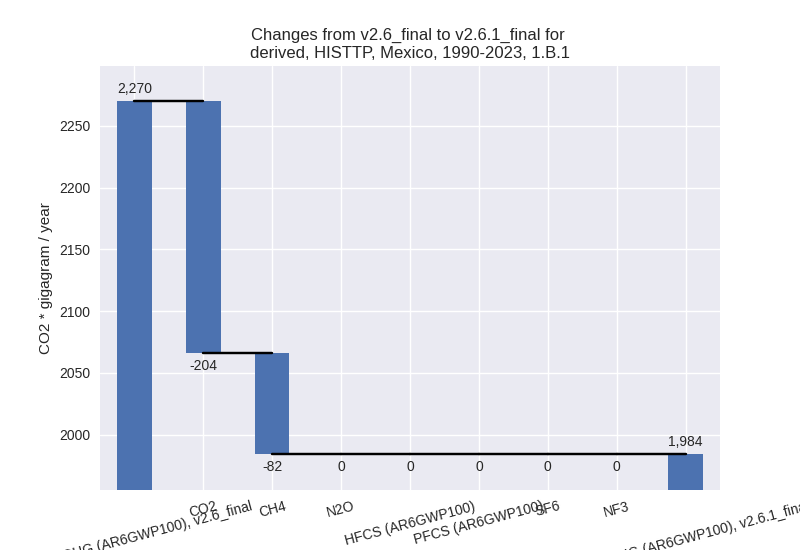
There is no subsector information available in PRIMAP-hist. - 1.B.2: Total sectoral emissions in 2022 are
25103.20 Gg CO2 / year which is 5.0% of category 1 emissions. 2023
Emissions have changed by -28.2%
(-10333.32 Gg CO2 / year). 1990-2023 Emissions have changed by -39.1% (-14867.30 Gg CO2 / year). For 2023
the changes per gas
are:

For 1990-2023 the changes per gas are: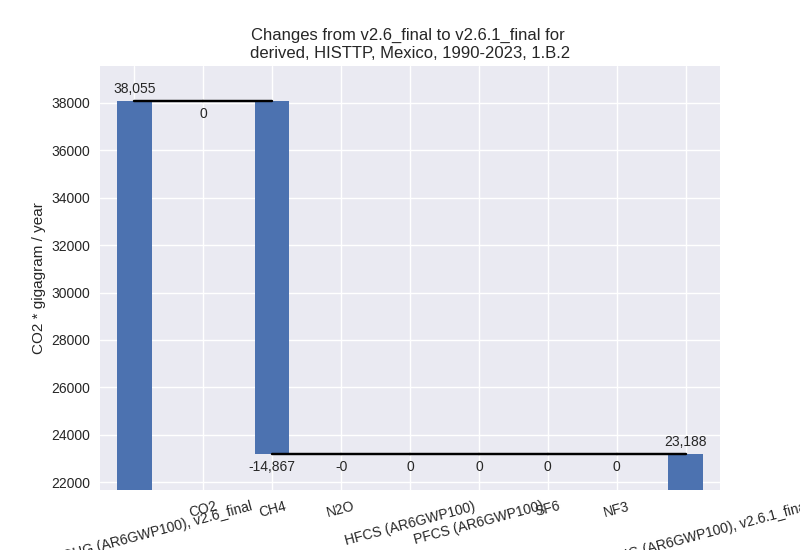
There is no subsector information available in PRIMAP-hist.
- 2: Total sectoral emissions in 2022 are 49645.34 Gg
CO2 / year which is 6.9% of M.0.EL emissions. 2023 Emissions have
changed by -59.8% (-76180.84 Gg CO2
/ year). 1990-2023 Emissions have changed by -58.3% (-46081.56 Gg CO2 / year). For 2023
the changes per gas
are:

For 1990-2023 the changes per gas are:
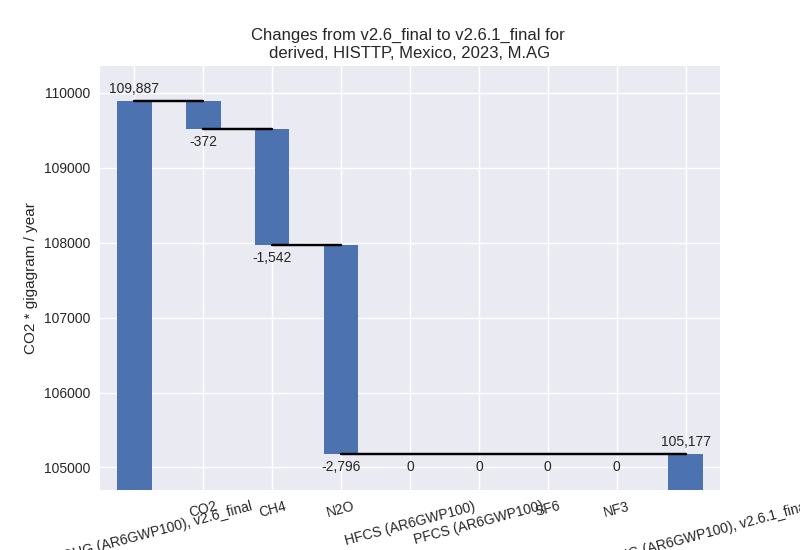
- M.AG: Total sectoral emissions in 2022 are
104798.93 Gg CO2 / year which is 14.5% of M.0.EL emissions. 2023
Emissions have changed by -4.3%
(-4709.94 Gg CO2 / year). 1990-2023 Emissions have changed by -0.3% (-294.38 Gg CO2 / year). For 2023
the changes per gas
are:
The changes come from the following subsectors:- 3.A: Total sectoral emissions in 2022 are 70331.08
Gg CO2 / year which is 67.1% of category M.AG emissions. 2023 Emissions
have changed by -2.1% (-1485.23 Gg
CO2 / year). 1990-2023 Emissions have changed by -0.1% (-84.62 Gg CO2 / year). For 2023 the
changes per gas
are:

There is no subsector information available in PRIMAP-hist. - M.AG.ELV: Total sectoral emissions in 2022 are
34467.85 Gg CO2 / year which is 32.9% of category M.AG emissions. 2023
Emissions have changed by -8.6%
(-3224.71 Gg CO2 / year). 1990-2023 Emissions have changed by -0.6% (-209.76 Gg CO2 / year). For 2023
the changes per gas
are:
There is no subsector information available in PRIMAP-hist.
- 3.A: Total sectoral emissions in 2022 are 70331.08
Gg CO2 / year which is 67.1% of category M.AG emissions. 2023 Emissions
have changed by -2.1% (-1485.23 Gg
CO2 / year). 1990-2023 Emissions have changed by -0.1% (-84.62 Gg CO2 / year). For 2023 the
changes per gas
are:
- 4: Total sectoral emissions in 2022 are 63676.68 Gg
CO2 / year which is 8.8% of M.0.EL emissions. 2023 Emissions have
changed by -20.7% (-16854.93 Gg CO2
/ year). 1990-2023 Emissions have changed by -21.1% (-13155.04 Gg CO2 / year). For 2023
the changes per gas
are:

For 1990-2023 the changes per gas are: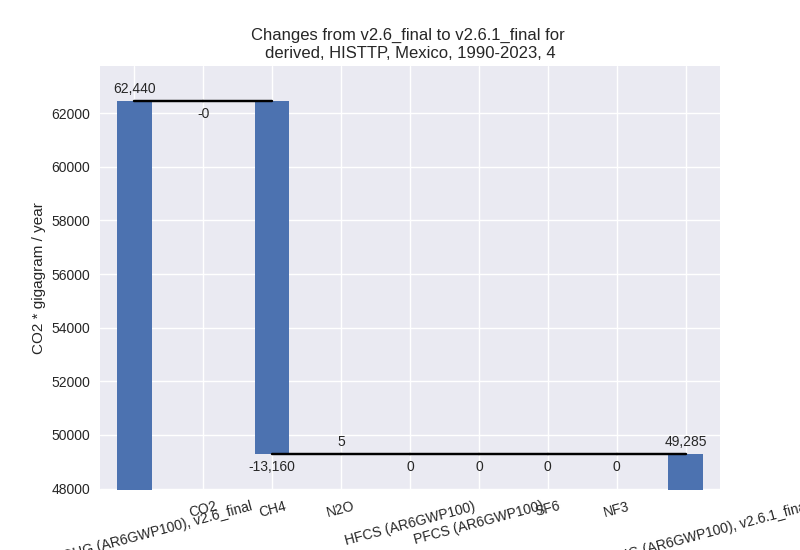
- 5: Total sectoral emissions in 2022 are 1760.22 Gg
CO2 / year which is 0.2% of M.0.EL emissions. 2023 Emissions have
changed by -7.7% (-153.80 Gg CO2 /
year). 1990-2023 Emissions have changed by -7.7% (-196.72 Gg CO2 / year). For 2023
the changes per gas
are:

For 1990-2023 the changes per gas are: