Changes in PRIMAP-hist v2.6.1_final compared to v2.6_final for Marshall Islands
2025-03-19
Johannes Gütschow
Change analysis for Marshall Islands for PRIMAP-hist v2.6.1_final compared to v2.6_final
Overview over emissions by sector and gas
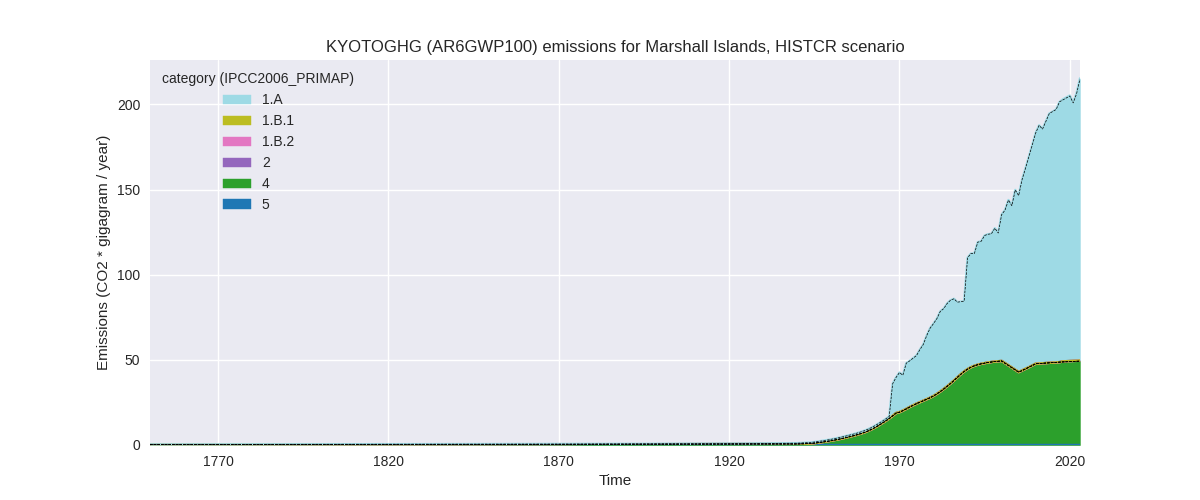
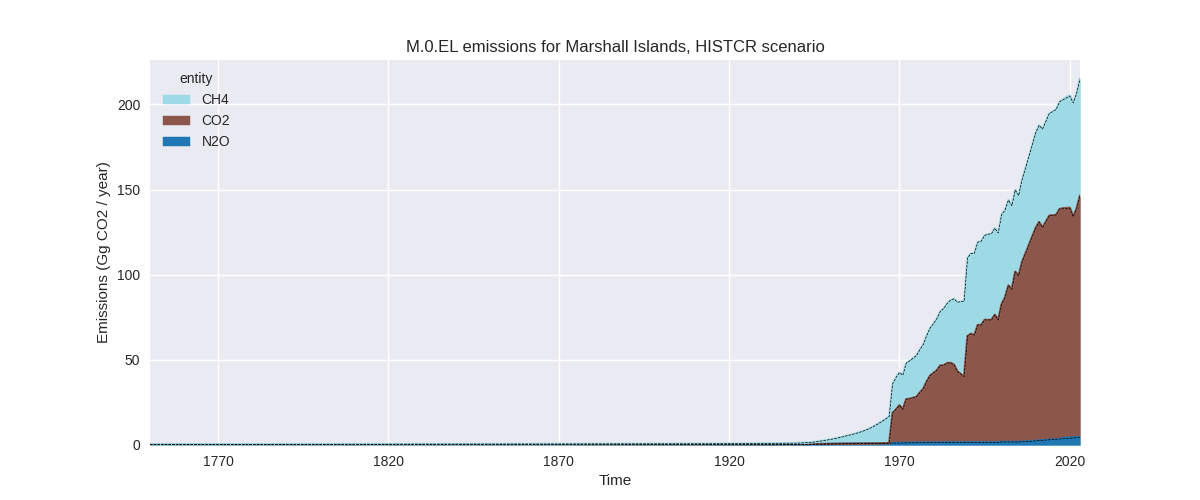
The following figures show the aggregate national total emissions excluding LULUCF AR6GWP100 for the country reported priority scenario. The dotted linesshow the v2.6_final data.
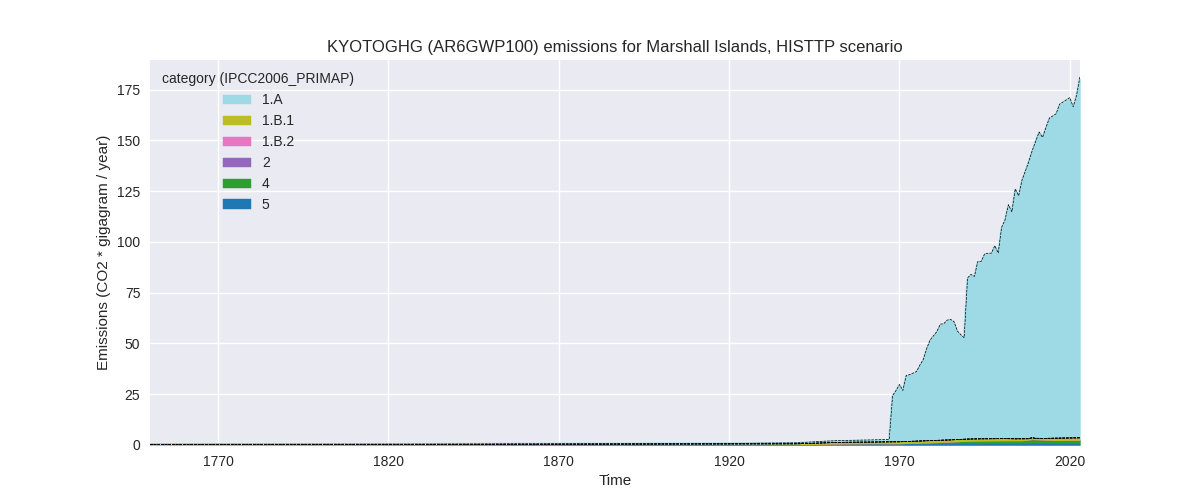
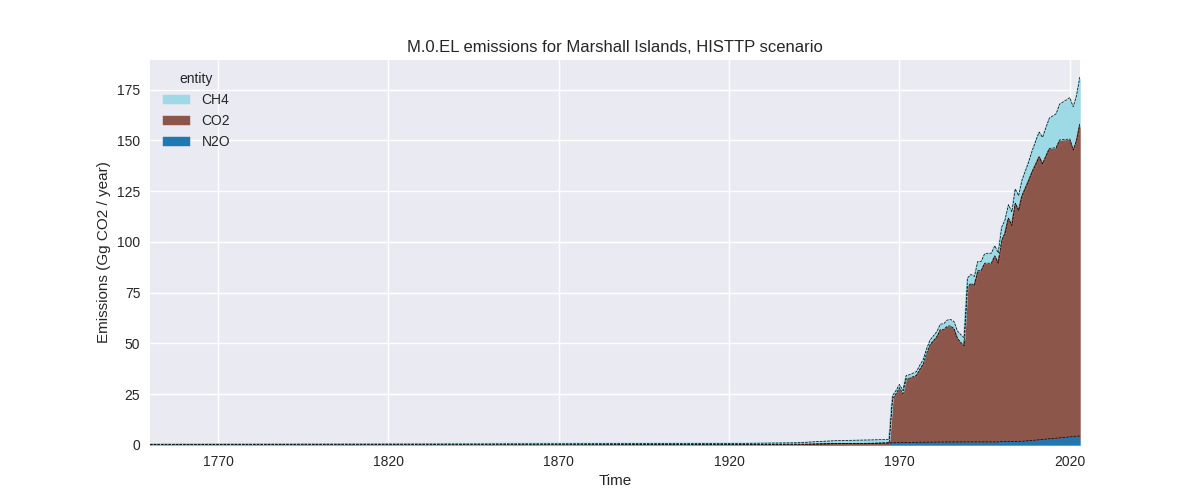
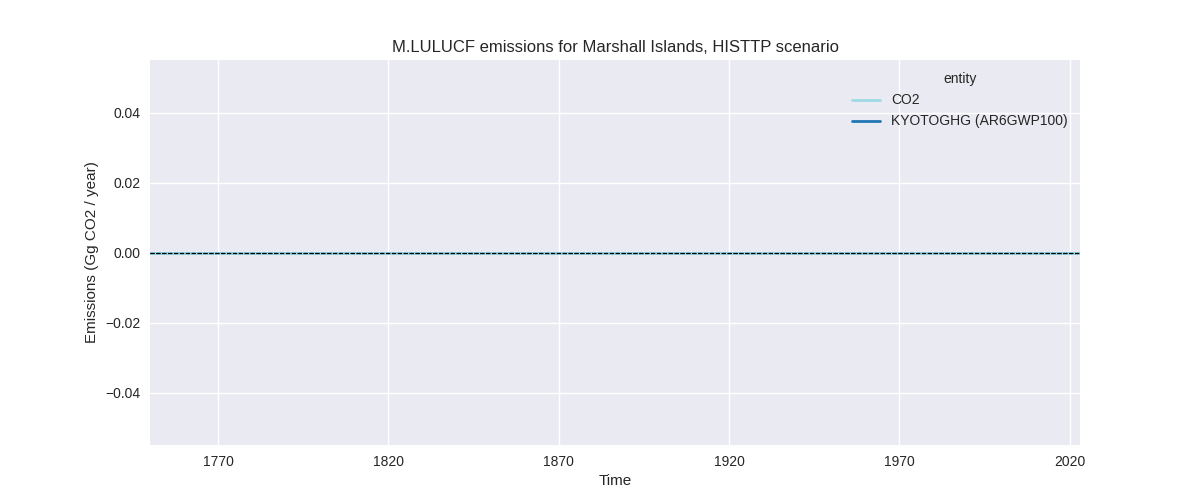
The following figures show the aggregate national total emissions excluding LULUCF AR6GWP100 for the third party priority scenario. The dotted linesshow the v2.6_final data.
Overview over changes
In the country reported priority scenario we have the following changes for aggregate Kyoto GHG and national total emissions excluding LULUCF (M.0.EL):
- Emissions in 2023 have changed by 0.2%% (0.38 Gg CO2 / year)
- Emissions in 1990-2023 have changed by 0.0%% (0.04 Gg CO2 / year)
In the third party priority scenario we have the following changes for aggregate Kyoto GHG and national total emissions excluding LULUCF (M.0.EL):
- Emissions in 2023 have changed by -0.5%% (-0.90 Gg CO2 / year)
- Emissions in 1990-2023 have changed by -0.5%% (-0.66 Gg CO2 / year)
Most important changes per scenario and time frame
In the country reported priority scenario the following sector-gas combinations have the highest absolute impact on national total KyotoGHG (AR6GWP100) emissions in 2023 (top 5):
- 1: 4, N2O with 0.36 Gg CO2 / year (26.5%)
- 2: 4, CH4 with 0.02 Gg CO2 / year (0.0%)
- 3: 1.A, CH4 with 0.00 Gg CO2 / year (0.0%)
- 4: 1.A, CO2 with 0.00 Gg CO2 / year (0.0%)
- 5: 1.A, N2O with 0.00 Gg CO2 / year (0.0%)
In the country reported priority scenario the following sector-gas combinations have the highest absolute impact on national total KyotoGHG (AR6GWP100) emissions in 1990-2023 (top 5):
- 1: 4, N2O with 0.04 Gg CO2 / year (4.0%)
- 2: 4, CH4 with 0.00 Gg CO2 / year (0.0%)
- 3: 1.A, CH4 with 0.00 Gg CO2 / year (0.0%)
- 4: 1.A, CO2 with 0.00 Gg CO2 / year (0.0%)
- 5: 1.A, N2O with 0.00 Gg CO2 / year (0.0%)
In the third party priority scenario the following sector-gas combinations have the highest absolute impact on national total KyotoGHG (AR6GWP100) emissions in 2023 (top 5):
- 1: 4, N2O with -1.12 Gg CO2 / year (-83.3%)
- 2: 4, CH4 with 0.22 Gg CO2 / year (10.0%)
- 3: 2, CO2 with 0.00 Gg CO2 / year (0.1%)
- 4: 1.A, CH4 with 0.00 Gg CO2 / year (0.0%)
- 5: 1.A, CO2 with 0.00 Gg CO2 / year (0.0%)
In the third party priority scenario the following sector-gas combinations have the highest absolute impact on national total KyotoGHG (AR6GWP100) emissions in 1990-2023 (top 5):
- 1: 4, N2O with -0.92 Gg CO2 / year (-87.1%)
- 2: 4, CH4 with 0.21 Gg CO2 / year (10.0%)
- 3: 2, CO2 with 0.05 Gg CO2 / year (261.8%)
- 4: 1.A, CH4 with 0.00 Gg CO2 / year (0.0%)
- 5: 1.A, CO2 with 0.00 Gg CO2 / year (0.0%)
Notes on data changes
Here we list notes explaining important emissions changes for the country.
- No new country reported data has been included.
- The only noteworthy change in the CR time-series is for waste N2O where EDGAR data is available for the first time replacing numerical extrapolation of the sparse country reported data.
- In the TP scenario the main changes are for waste emissions as well
(EDGAR replaces country reported data)
- Cumulative emissions for CO2 in 2.D are higher because of a change in EDGAR.
Changes by sector and gas
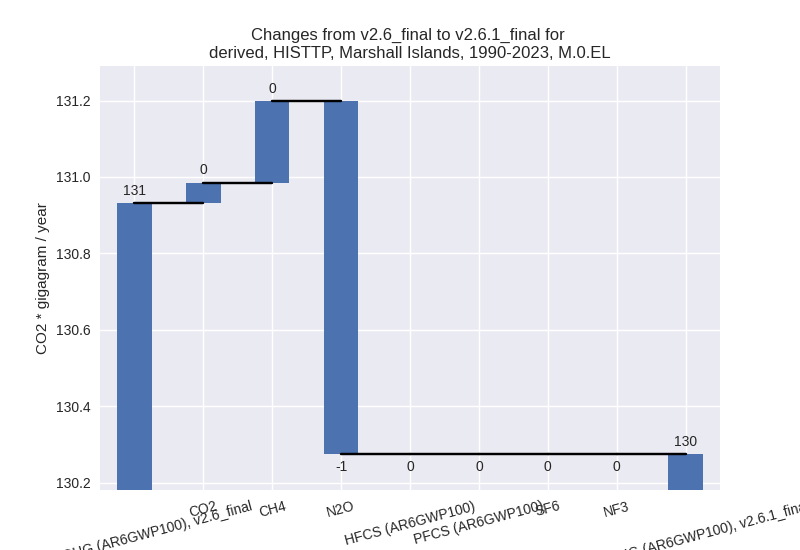
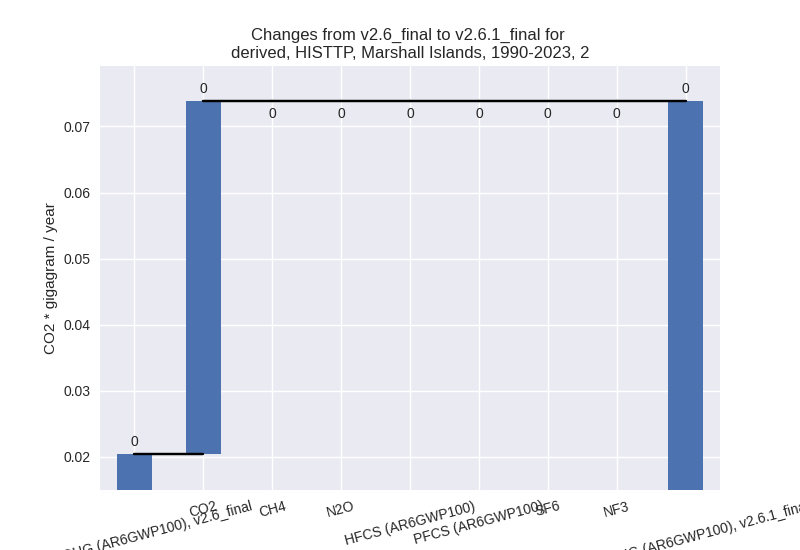
For each scenario and time frame the changes are displayed for all individual sectors and all individual gases. In the sector plot we use aggregate Kyoto GHGs in AR6GWP100. In the gas plot we usenational total emissions without LULUCF.
country reported scenario
2023

1990-2023

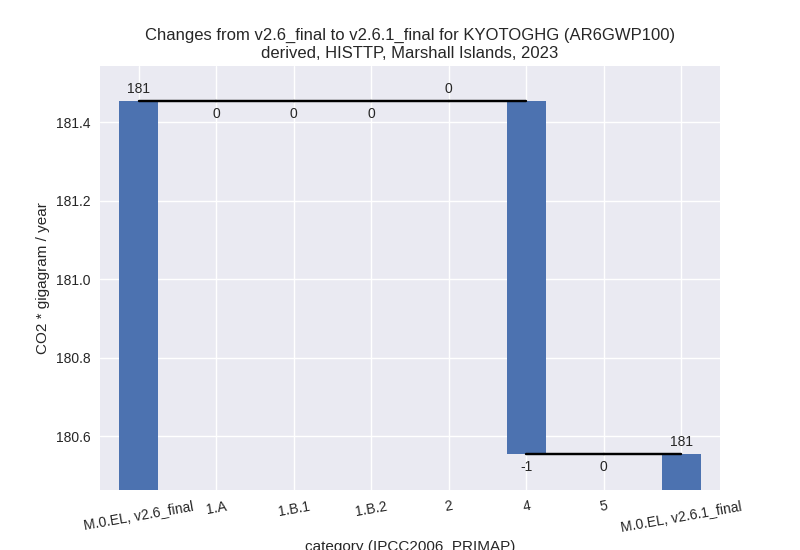
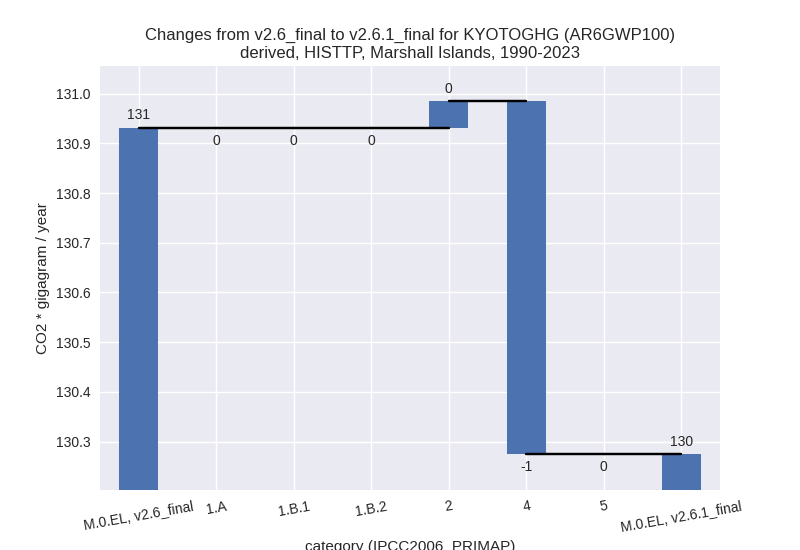
third party scenario
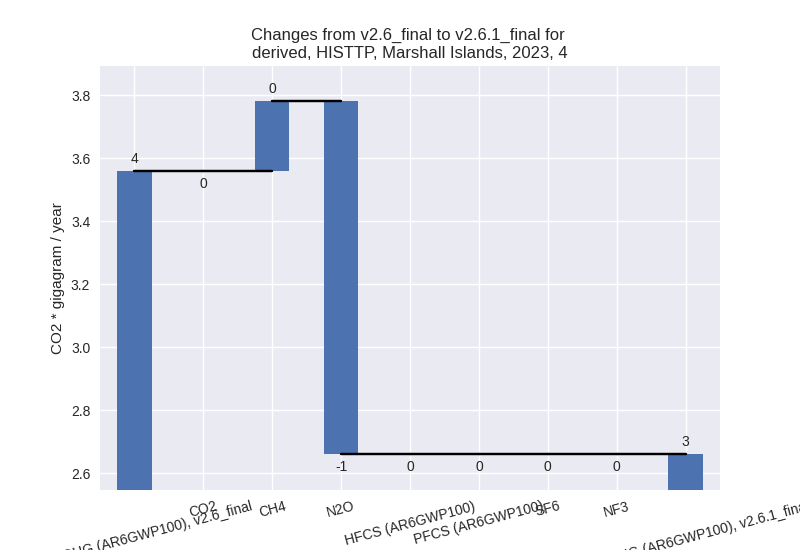
2023

1990-2023
Detailed changes for the scenarios:
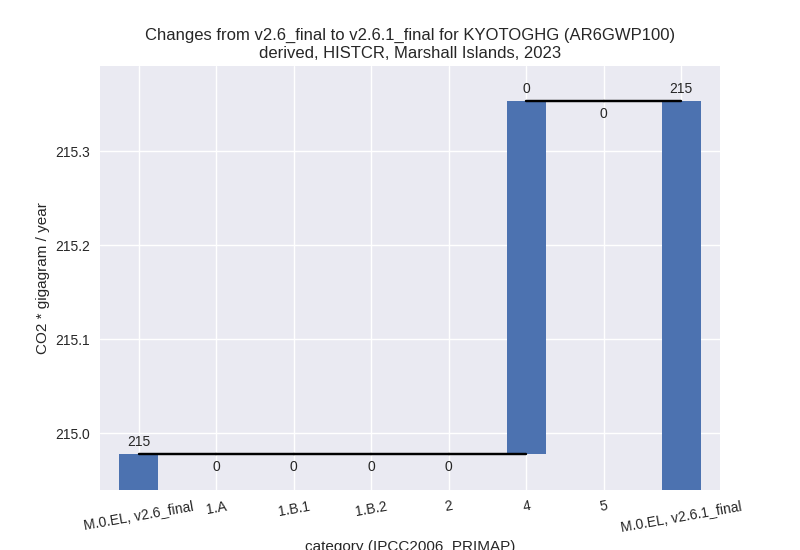
country reported scenario (HISTCR):
Most important changes per time frame
For 2023 the following sector-gas combinations have the highest absolute impact on national total KyotoGHG (AR6GWP100) emissions in 2023 (top 5):
- 1: 4, N2O with 0.36 Gg CO2 / year (26.5%)
- 2: 4, CH4 with 0.02 Gg CO2 / year (0.0%)
- 3: 1.A, CH4 with 0.00 Gg CO2 / year (0.0%)
- 4: 1.A, CO2 with 0.00 Gg CO2 / year (0.0%)
- 5: 1.A, N2O with 0.00 Gg CO2 / year (0.0%)
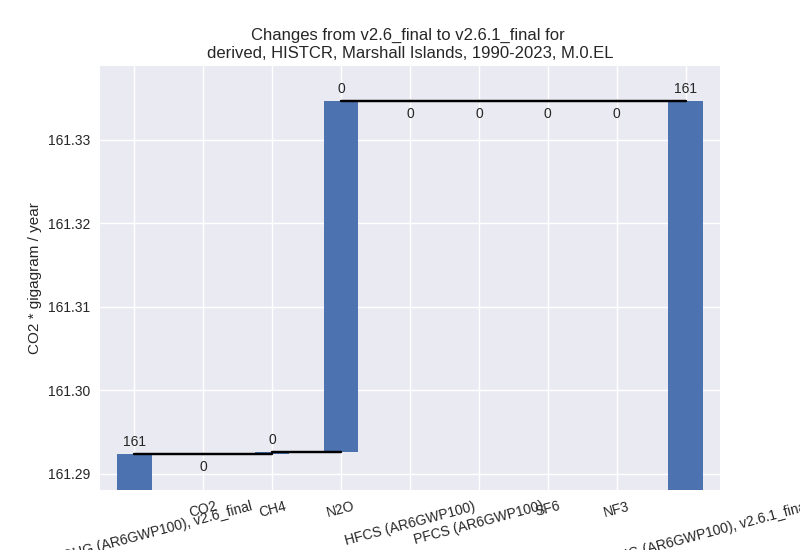
For 1990-2023 the following sector-gas combinations have the highest absolute impact on national total KyotoGHG (AR6GWP100) emissions in 1990-2023 (top 5):
- 1: 4, N2O with 0.04 Gg CO2 / year (4.0%)
- 2: 4, CH4 with 0.00 Gg CO2 / year (0.0%)
- 3: 1.A, CH4 with 0.00 Gg CO2 / year (0.0%)
- 4: 1.A, CO2 with 0.00 Gg CO2 / year (0.0%)
- 5: 1.A, N2O with 0.00 Gg CO2 / year (0.0%)
Changes in the main sectors for aggregate KyotoGHG (AR6GWP100) are
1: Total sectoral emissions in 2022 are 157.16 Gg CO2 / year which is 76.1% of M.0.EL emissions. 2023 Emissions have changed by 0.0% (0.00 Gg CO2 / year). 1990-2023 Emissions have changed by 0.0% (0.00 Gg CO2 / year).
2: No data
M.AG: No data
4: Total sectoral emissions in 2022 are 49.46 Gg CO2 / year which is 23.9% of M.0.EL emissions. 2023 Emissions have changed by 0.8% (0.38 Gg CO2 / year). 1990-2023 Emissions have changed by 0.1% (0.04 Gg CO2 / year).
5: No data
third party scenario (HISTTP):
Most important changes per time frame
For 2023 the following sector-gas combinations have the highest absolute impact on national total KyotoGHG (AR6GWP100) emissions in 2023 (top 5):
- 1: 4, N2O with -1.12 Gg CO2 / year (-83.3%)
- 2: 4, CH4 with 0.22 Gg CO2 / year (10.0%)
- 3: 2, CO2 with 0.00 Gg CO2 / year (0.1%)
- 4: 1.A, CH4 with 0.00 Gg CO2 / year (0.0%)
- 5: 1.A, CO2 with 0.00 Gg CO2 / year (0.0%)
For 1990-2023 the following sector-gas combinations have the highest absolute impact on national total KyotoGHG (AR6GWP100) emissions in 1990-2023 (top 5):
- 1: 4, N2O with -0.92 Gg CO2 / year (-87.1%)
- 2: 4, CH4 with 0.21 Gg CO2 / year (10.0%)
- 3: 2, CO2 with 0.05 Gg CO2 / year (261.8%)
- 4: 1.A, CH4 with 0.00 Gg CO2 / year (0.0%)
- 5: 1.A, CO2 with 0.00 Gg CO2 / year (0.0%)
Changes in the main sectors for aggregate KyotoGHG (AR6GWP100) are
1: Total sectoral emissions in 2022 are 168.69 Gg CO2 / year which is 98.5% of M.0.EL emissions. 2023 Emissions have changed by 0.0% (0.00 Gg CO2 / year). 1990-2023 Emissions have changed by 0.0% (0.00 Gg CO2 / year).
2: Total sectoral emissions in 2022 are 0.00 Gg CO2 / year which is 0.0% of M.0.EL emissions. 2023 Emissions have changed by 0.1% (0.00 Gg CO2 / year). 1990-2023 Emissions have changed by 261.8% (0.05 Gg CO2 / year). For 1990-2023 the changes per gas are:
M.AG: No data
4: Total sectoral emissions in 2022 are 2.64 Gg CO2 / year which is 1.5% of M.0.EL emissions. 2023 Emissions have changed by -25.3% (-0.90 Gg CO2 / year). 1990-2023 Emissions have changed by -22.2% (-0.71 Gg CO2 / year). For 2023 the changes per gas are:
For 1990-2023 the changes per gas are: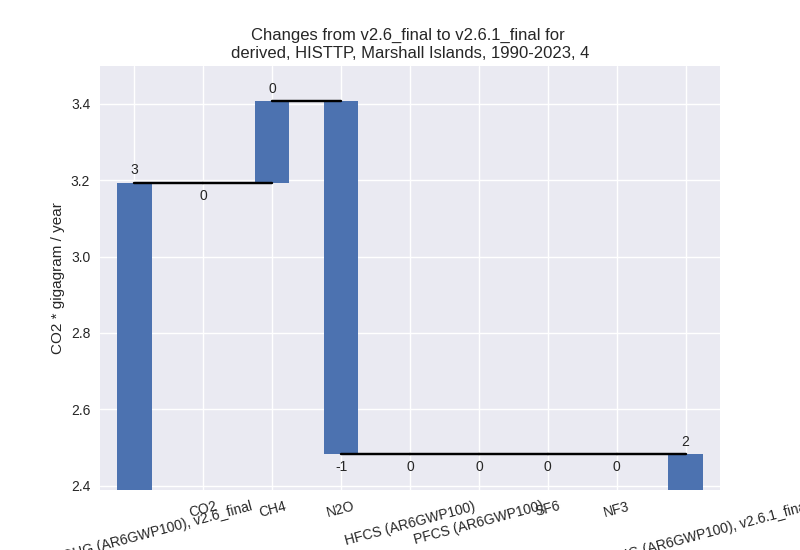
5: No data