Changes in PRIMAP-hist v2.6.1_final compared to v2.6_final for North Macedonia
2025-03-19
Johannes Gütschow
Change analysis for North Macedonia for PRIMAP-hist v2.6.1_final compared to v2.6_final
Overview over emissions by sector and gas
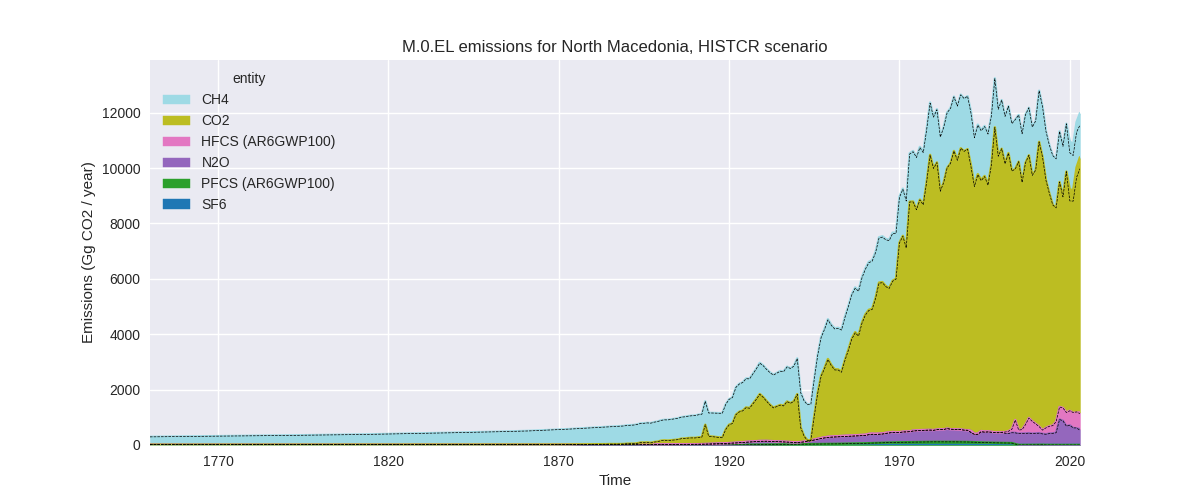
The following figures show the aggregate national total emissions excluding LULUCF AR6GWP100 for the country reported priority scenario. The dotted linesshow the v2.6_final data.
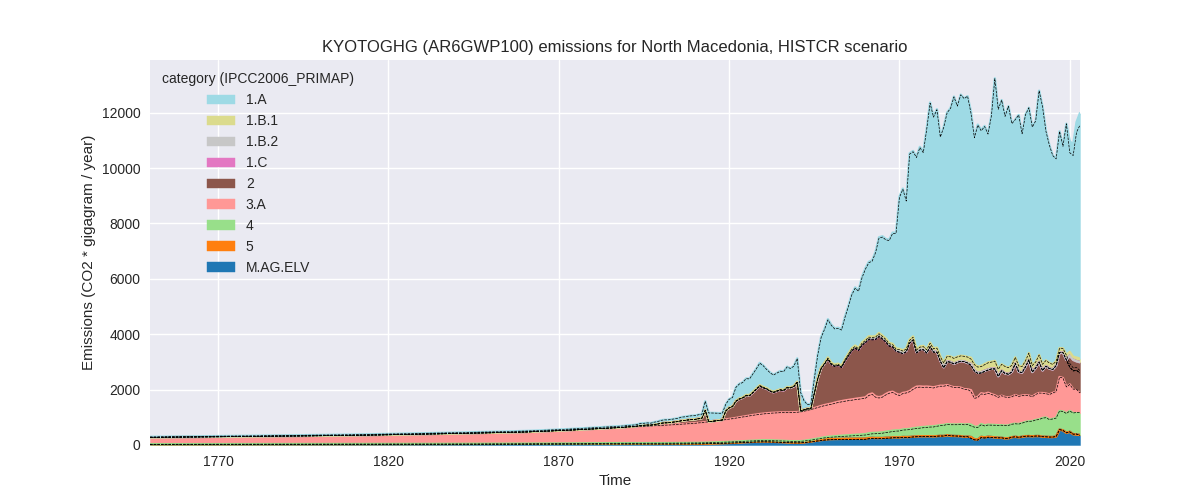
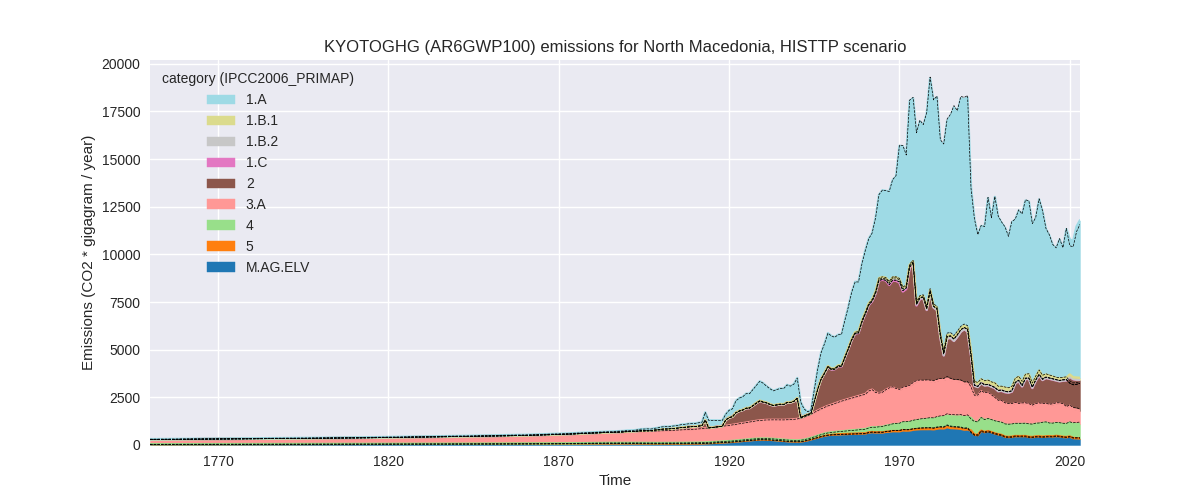
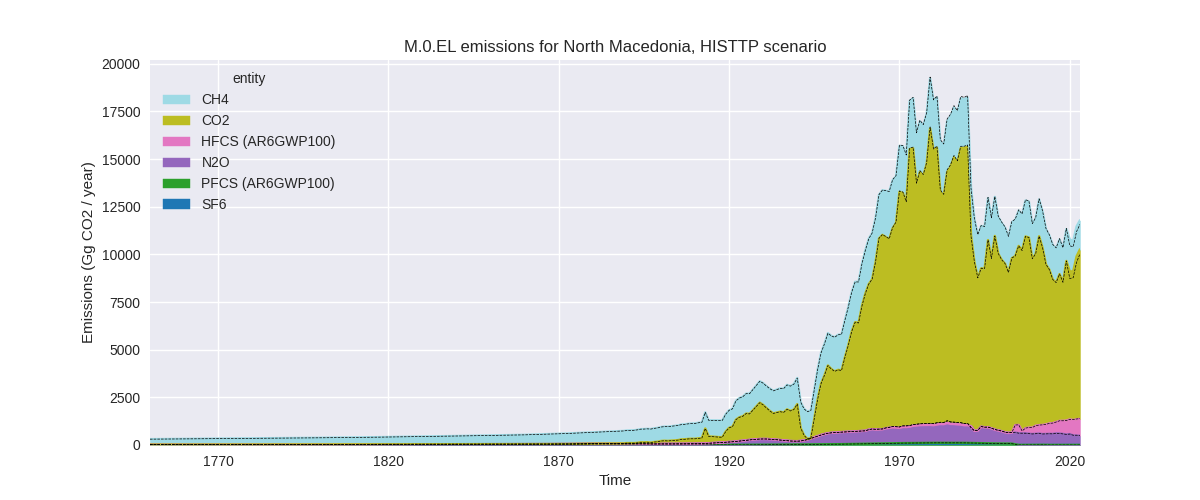
The following figures show the aggregate national total emissions excluding LULUCF AR6GWP100 for the third party priority scenario. The dotted linesshow the v2.6_final data.
Overview over changes
In the country reported priority scenario we have the following changes for aggregate Kyoto GHG and national total emissions excluding LULUCF (M.0.EL):
- Emissions in 2023 have changed by 3.7%% (431.01 Gg CO2 / year)
- Emissions in 1990-2023 have changed by 0.5%% (52.27 Gg CO2 / year)
In the third party priority scenario we have the following changes for aggregate Kyoto GHG and national total emissions excluding LULUCF (M.0.EL):
- Emissions in 2023 have changed by 1.8%% (211.61 Gg CO2 / year)
- Emissions in 1990-2023 have changed by -0.0%% (-0.22 Gg CO2 / year)
Most important changes per scenario and time frame
In the country reported priority scenario the following sector-gas combinations have the highest absolute impact on national total KyotoGHG (AR6GWP100) emissions in 2023 (top 5):
- 1: 2, CO2 with 370.43 Gg CO2 / year (319.5%)
- 2: 1.B.1, CH4 with 39.76 Gg CO2 / year (47.9%)
- 3: 3.A, N2O with 29.66 Gg CO2 / year (31.0%)
- 4: 4, CH4 with -27.06 Gg CO2 / year (-3.5%)
- 5: M.AG.ELV, N2O with 13.73 Gg CO2 / year (4.2%)
In the country reported priority scenario the following sector-gas combinations have the highest absolute impact on national total KyotoGHG (AR6GWP100) emissions in 1990-2023 (top 5):
- 1: 2, CO2 with 46.49 Gg CO2 / year (7.4%)
- 2: M.AG.ELV, N2O with 5.06 Gg CO2 / year (1.8%)
- 3: 1.B.1, CH4 with 2.00 Gg CO2 / year (1.0%)
- 4: 4, CH4 with -1.12 Gg CO2 / year (-0.2%)
- 5: 3.A, N2O with 0.73 Gg CO2 / year (0.9%)
In the third party priority scenario the following sector-gas combinations have the highest absolute impact on national total KyotoGHG (AR6GWP100) emissions in 2023 (top 5):
- 1: 2, CO2 with 272.82 Gg CO2 / year (61.8%)
- 2: 4, CH4 with -61.21 Gg CO2 / year (-8.6%)
- 3: 1.B.1, CH4 with 33.92 Gg CO2 / year (50.1%)
- 4: M.AG.ELV, CO2 with -28.50 Gg CO2 / year (-57.5%)
- 5: M.AG.ELV, N2O with -6.11 Gg CO2 / year (-2.2%)
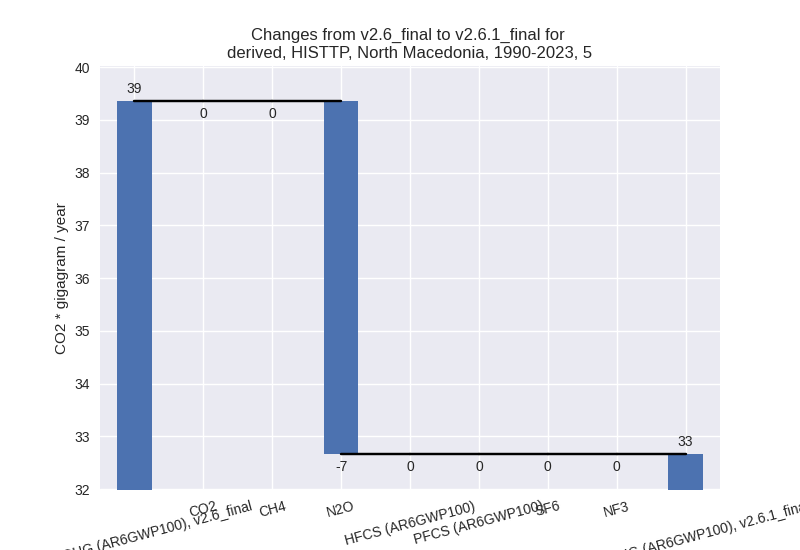
In the third party priority scenario the following sector-gas combinations have the highest absolute impact on national total KyotoGHG (AR6GWP100) emissions in 1990-2023 (top 5):
- 1: 2, CO2 with 40.11 Gg CO2 / year (6.0%)
- 2: 4, CH4 with -31.74 Gg CO2 / year (-5.3%)
- 3: 5, N2O with -6.69 Gg CO2 / year (-17.0%)
- 4: M.AG.ELV, CO2 with -2.28 Gg CO2 / year (-8.5%)
- 5: 1.B.1, CH4 with 1.68 Gg CO2 / year (0.9%)
Notes on data changes
Here we list notes explaining important emissions changes for the country.
- No new country reported data has been included. Changes in the CR time-series are limited to the latest years and come from updated third party data (EDGAR, FAO) which is used to extrapolate the country reported data.
- The lower CO2 emissions in 2.C (2023) in the TP scenario come from
EDGAR emissions replacing numerical extrapolation.
- Lower CO2 in M.AG.ELV and CH4 in the waste sector come directly from updated EDGAR emissions.
- Higher CH4 in 1.B.1 come from an update to EDGAR emissions for 2022.
Changes by sector and gas
For each scenario and time frame the changes are displayed for all individual sectors and all individual gases. In the sector plot we use aggregate Kyoto GHGs in AR6GWP100. In the gas plot we usenational total emissions without LULUCF.
country reported scenario
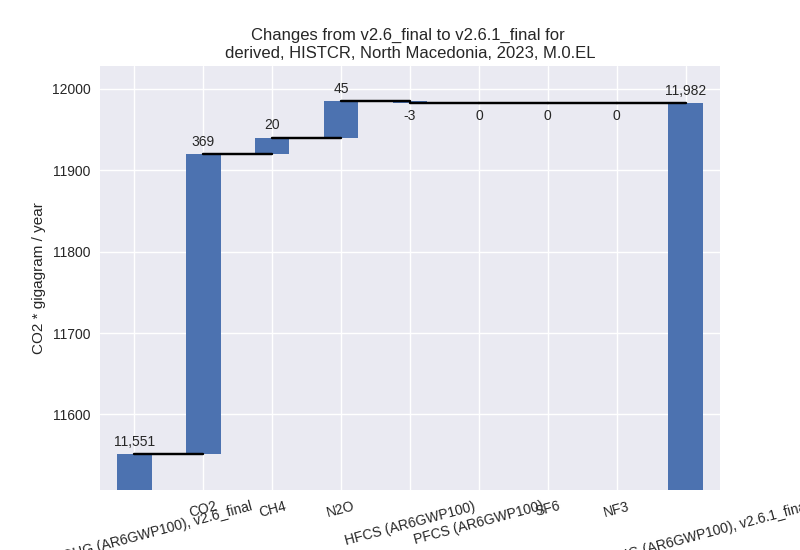
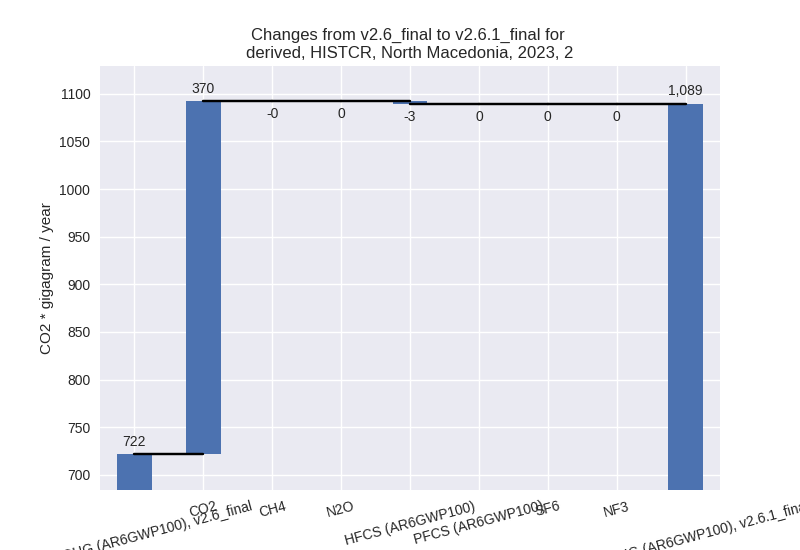
2023
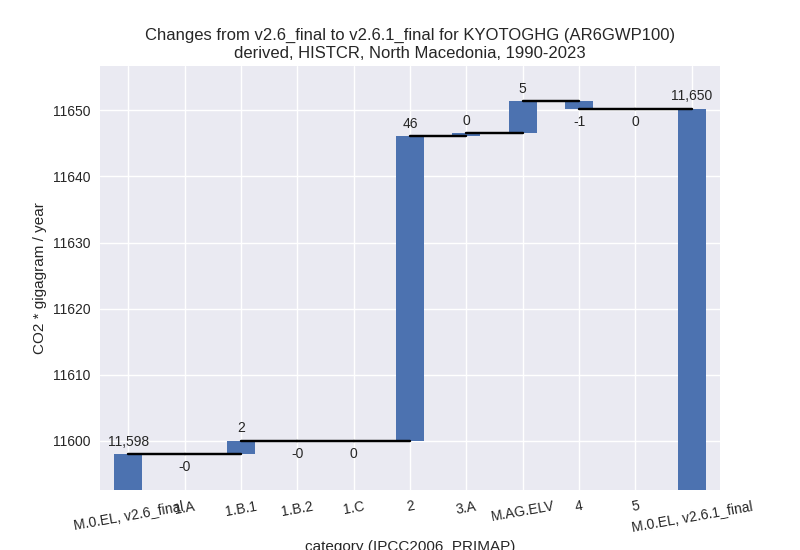
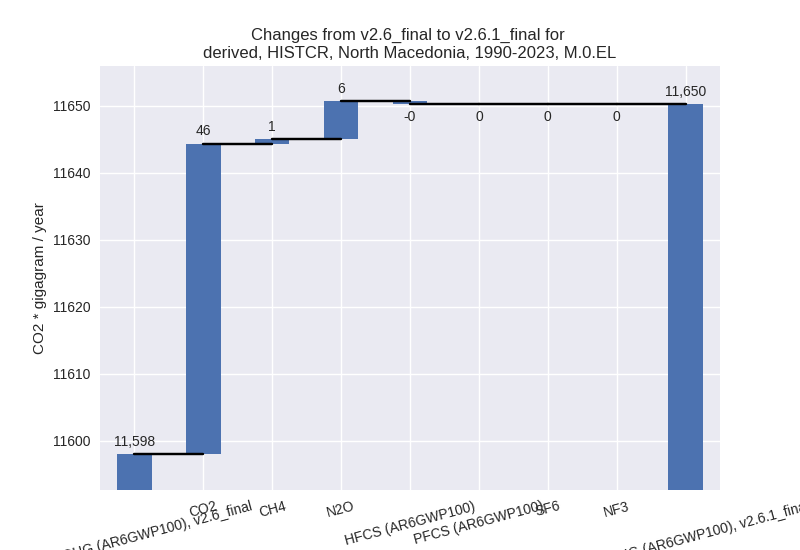
1990-2023
third party scenario
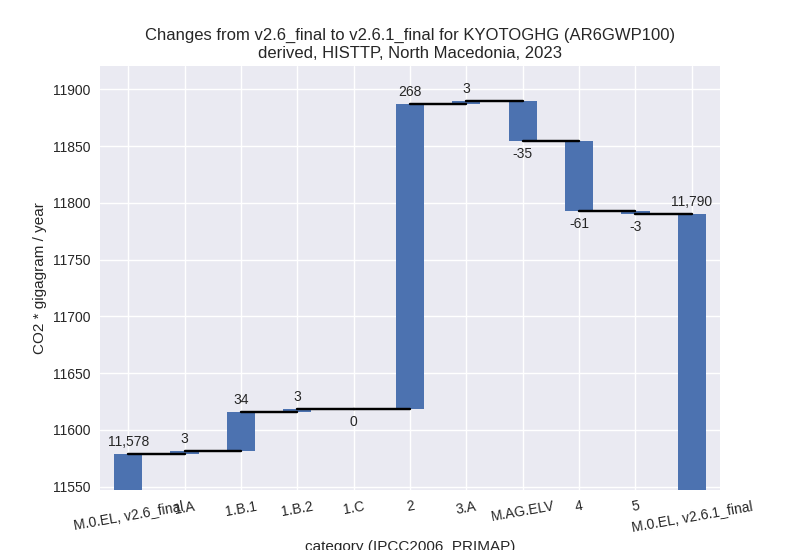
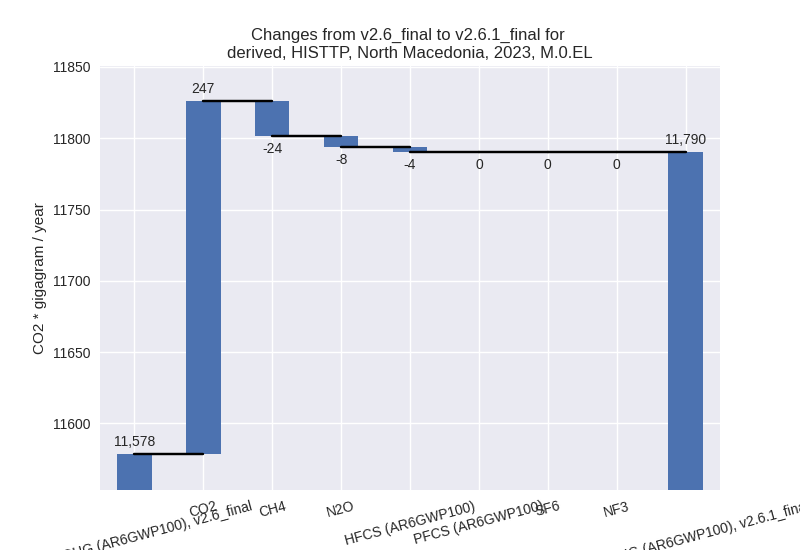
2023
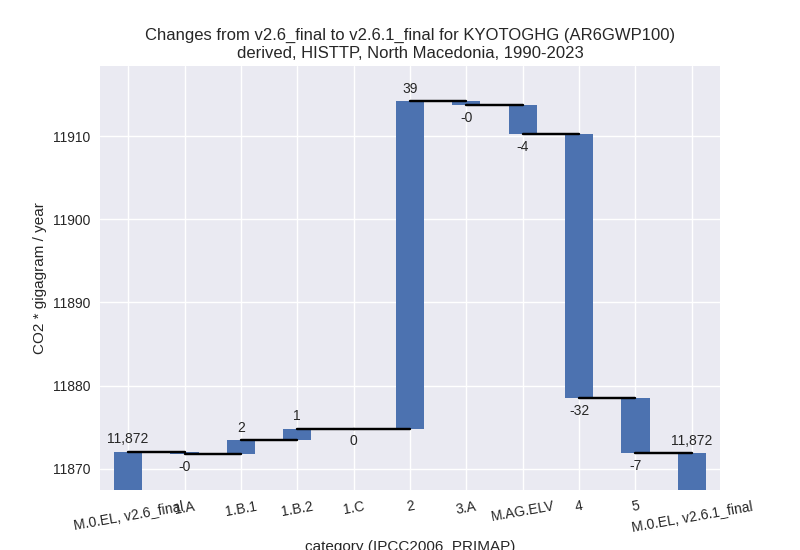
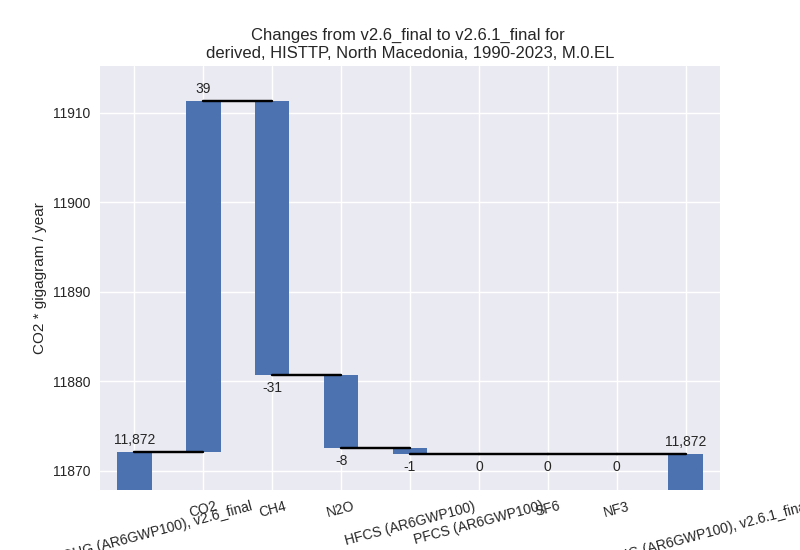
1990-2023
Detailed changes for the scenarios:
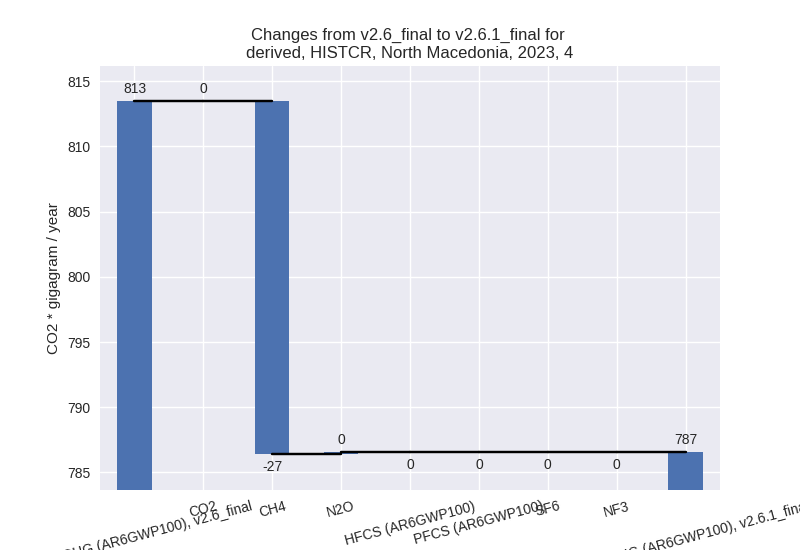
country reported scenario (HISTCR):
Most important changes per time frame
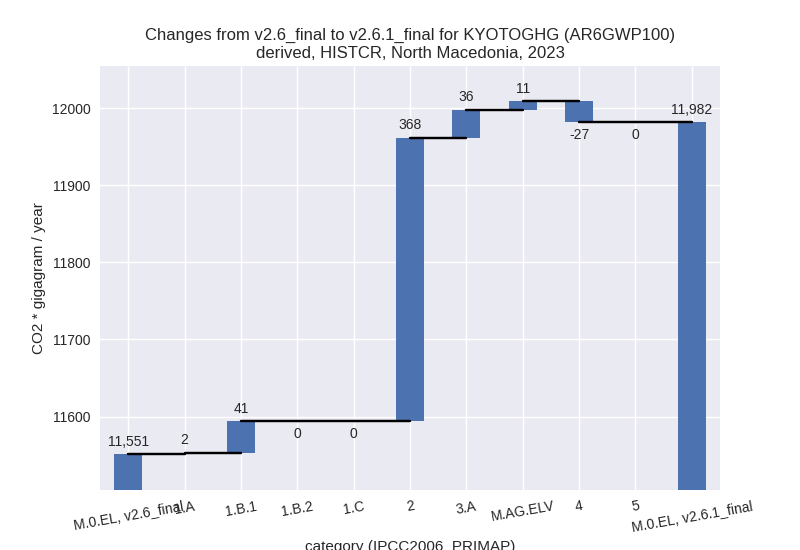
For 2023 the following sector-gas combinations have the highest absolute impact on national total KyotoGHG (AR6GWP100) emissions in 2023 (top 5):
- 1: 2, CO2 with 370.43 Gg CO2 / year (319.5%)
- 2: 1.B.1, CH4 with 39.76 Gg CO2 / year (47.9%)
- 3: 3.A, N2O with 29.66 Gg CO2 / year (31.0%)
- 4: 4, CH4 with -27.06 Gg CO2 / year (-3.5%)
- 5: M.AG.ELV, N2O with 13.73 Gg CO2 / year (4.2%)
For 1990-2023 the following sector-gas combinations have the highest absolute impact on national total KyotoGHG (AR6GWP100) emissions in 1990-2023 (top 5):
- 1: 2, CO2 with 46.49 Gg CO2 / year (7.4%)
- 2: M.AG.ELV, N2O with 5.06 Gg CO2 / year (1.8%)
- 3: 1.B.1, CH4 with 2.00 Gg CO2 / year (1.0%)
- 4: 4, CH4 with -1.12 Gg CO2 / year (-0.2%)
- 5: 3.A, N2O with 0.73 Gg CO2 / year (0.9%)
Changes in the main sectors for aggregate KyotoGHG (AR6GWP100) are
- 1: Total sectoral emissions in 2022 are 8638.01 Gg CO2 / year which is 74.1% of M.0.EL emissions. 2023 Emissions have changed by 0.5% (42.89 Gg CO2 / year). 1990-2023 Emissions have changed by 0.0% (2.03 Gg CO2 / year).
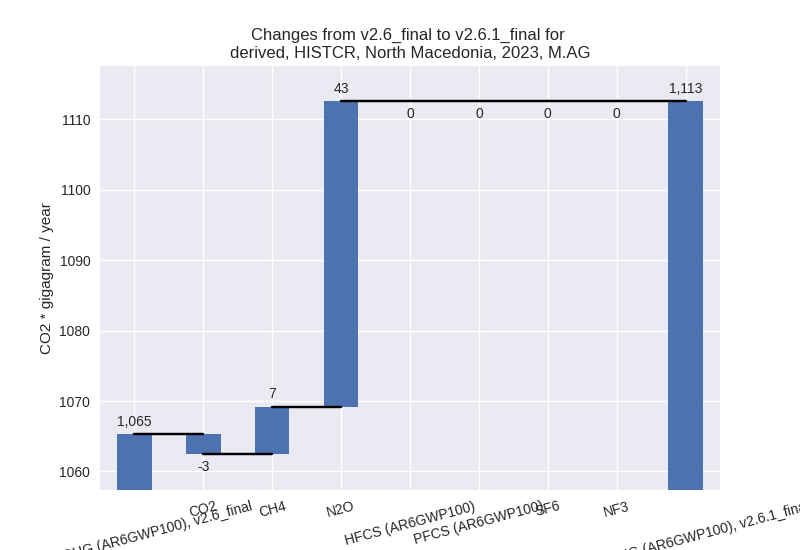
- 2: Total sectoral emissions in 2022 are 1061.42 Gg
CO2 / year which is 9.1% of M.0.EL emissions. 2023 Emissions have
changed by 51.0% (367.69 Gg CO2 /
year). 1990-2023 Emissions have changed by 5.1% (46.07 Gg CO2 / year). For 2023 the
changes per gas
are:
For 1990-2023 the changes per gas are: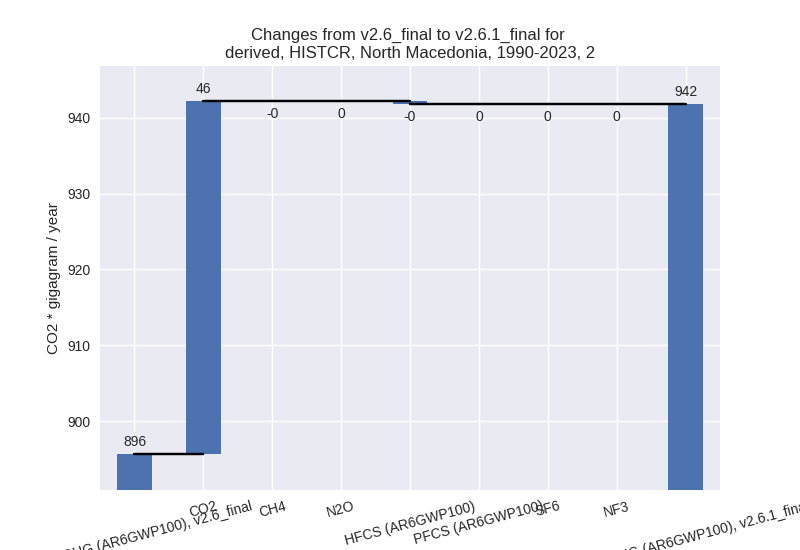
- M.AG: Total sectoral emissions in 2022 are 1191.15
Gg CO2 / year which is 10.2% of M.0.EL emissions. 2023 Emissions have
changed by 4.4% (47.31 Gg CO2 /
year). 1990-2023 Emissions have changed by 0.4% (5.29 Gg CO2 / year). For 2023 the
changes per gas
are:
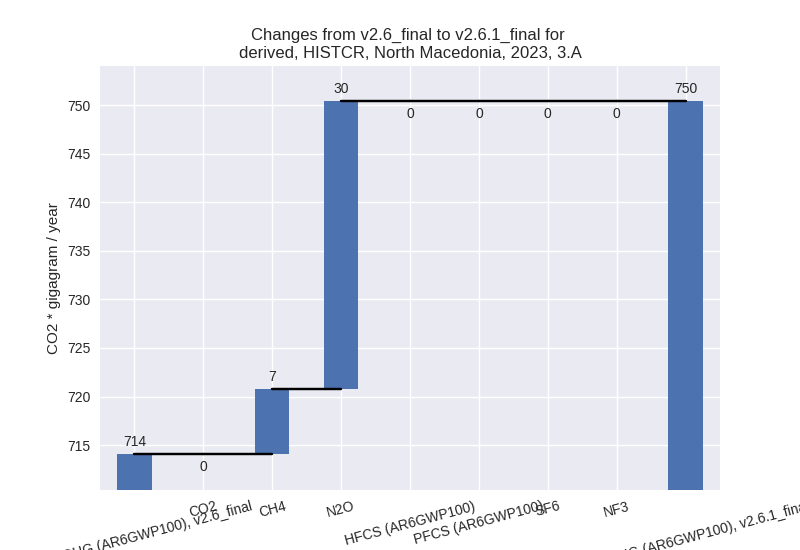
The changes come from the following subsectors:- 3.A: Total sectoral emissions in 2022 are 815.50 Gg
CO2 / year which is 68.5% of category M.AG emissions. 2023 Emissions
have changed by 5.1% (36.34 Gg CO2 /
year). 1990-2023 Emissions have changed by 0.0% (0.45 Gg CO2 / year). For 2023 the
changes per gas
are:
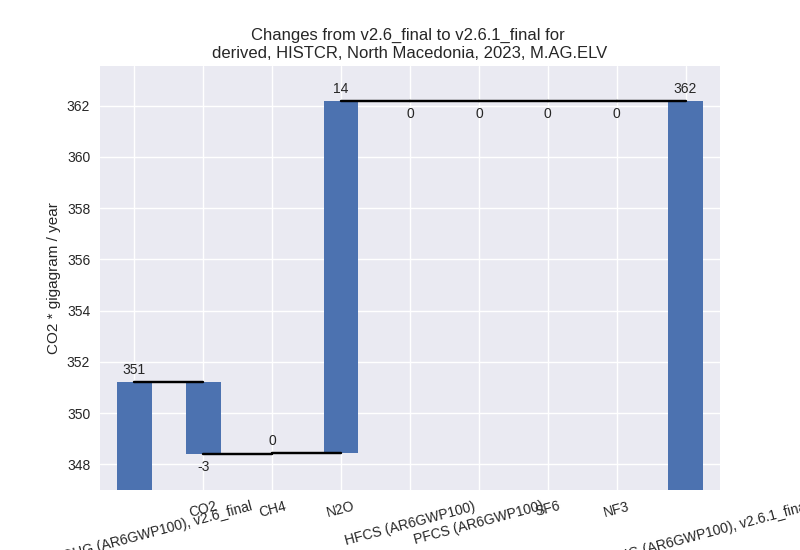
There is no subsector information available in PRIMAP-hist. - M.AG.ELV: Total sectoral emissions in 2022 are
375.65 Gg CO2 / year which is 31.5% of category M.AG emissions. 2023
Emissions have changed by 3.1%
(10.97 Gg CO2 / year). 1990-2023 Emissions have changed by 1.6% (4.84 Gg CO2 / year). For 2023 the
changes per gas
are:
There is no subsector information available in PRIMAP-hist.
- 3.A: Total sectoral emissions in 2022 are 815.50 Gg
CO2 / year which is 68.5% of category M.AG emissions. 2023 Emissions
have changed by 5.1% (36.34 Gg CO2 /
year). 1990-2023 Emissions have changed by 0.0% (0.45 Gg CO2 / year). For 2023 the
changes per gas
are:
- 4: Total sectoral emissions in 2022 are 768.58 Gg
CO2 / year which is 6.6% of M.0.EL emissions. 2023 Emissions have
changed by -3.3% (-26.88 Gg CO2 /
year). 1990-2023 Emissions have changed by -0.2% (-1.12 Gg CO2 / year). For 2023 the
changes per gas
are:
- 5: No data
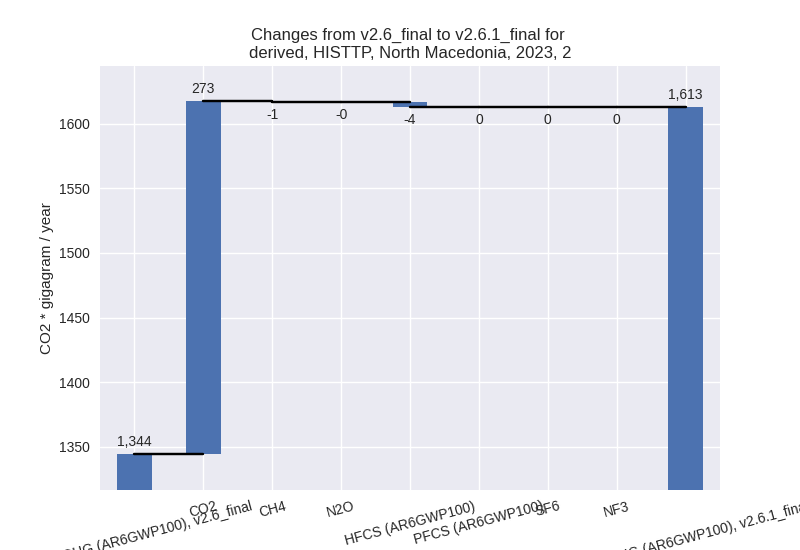
third party scenario (HISTTP):
Most important changes per time frame
For 2023 the following sector-gas combinations have the highest absolute impact on national total KyotoGHG (AR6GWP100) emissions in 2023 (top 5):
- 1: 2, CO2 with 272.82 Gg CO2 / year (61.8%)
- 2: 4, CH4 with -61.21 Gg CO2 / year (-8.6%)
- 3: 1.B.1, CH4 with 33.92 Gg CO2 / year (50.1%)
- 4: M.AG.ELV, CO2 with -28.50 Gg CO2 / year (-57.5%)
- 5: M.AG.ELV, N2O with -6.11 Gg CO2 / year (-2.2%)
For 1990-2023 the following sector-gas combinations have the highest absolute impact on national total KyotoGHG (AR6GWP100) emissions in 1990-2023 (top 5):
- 1: 2, CO2 with 40.11 Gg CO2 / year (6.0%)
- 2: 4, CH4 with -31.74 Gg CO2 / year (-5.3%)
- 3: 5, N2O with -6.69 Gg CO2 / year (-17.0%)
- 4: M.AG.ELV, CO2 with -2.28 Gg CO2 / year (-8.5%)
- 5: 1.B.1, CH4 with 1.68 Gg CO2 / year (0.9%)
Changes in the main sectors for aggregate KyotoGHG (AR6GWP100) are
- 1: Total sectoral emissions in 2022 are 8049.52 Gg CO2 / year which is 70.2% of M.0.EL emissions. 2023 Emissions have changed by 0.5% (39.82 Gg CO2 / year). 1990-2023 Emissions have changed by 0.0% (2.78 Gg CO2 / year).
- 2: Total sectoral emissions in 2022 are 1569.95 Gg
CO2 / year which is 13.7% of M.0.EL emissions. 2023 Emissions have
changed by 20.0% (268.42 Gg CO2 /
year). 1990-2023 Emissions have changed by 3.8% (39.38 Gg CO2 / year). For 2023 the
changes per gas
are:
For 1990-2023 the changes per gas are: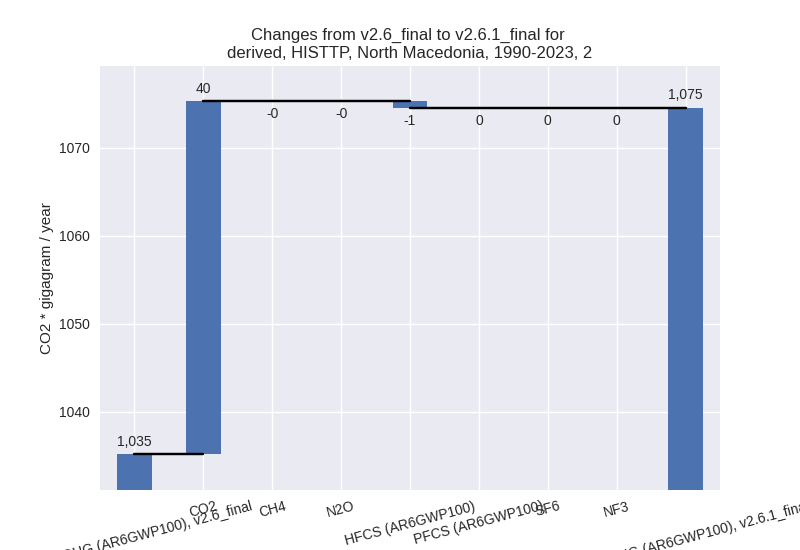
- M.AG: Total sectoral emissions in 2022 are 1078.89
Gg CO2 / year which is 9.4% of M.0.EL emissions. 2023 Emissions have
changed by -3.1% (-32.48 Gg CO2 /
year). 1990-2023 Emissions have changed by -0.3% (-3.99 Gg CO2 / year). For 2023 the
changes per gas
are:
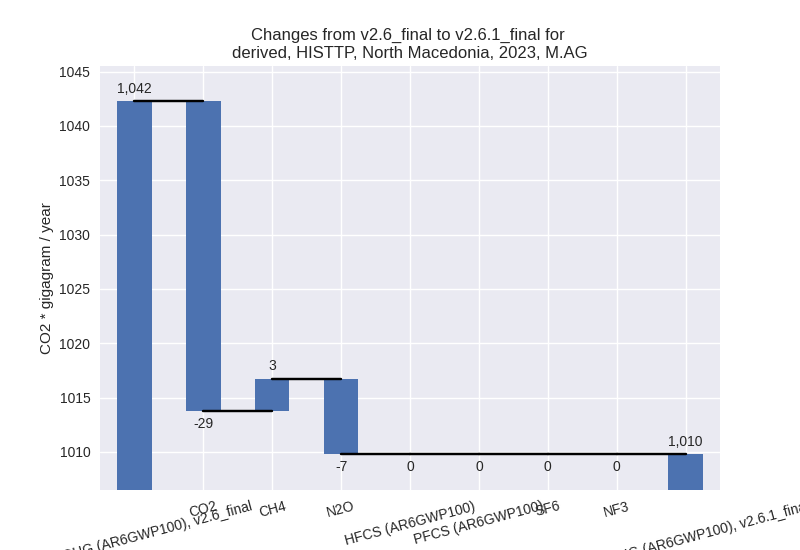
The changes come from the following subsectors:- 3.A: Total sectoral emissions in 2022 are 750.37 Gg CO2 / year which is 69.6% of category M.AG emissions. 2023 Emissions have changed by 0.4% (2.74 Gg CO2 / year). 1990-2023 Emissions have changed by -0.0% (-0.47 Gg CO2 / year).
- M.AG.ELV: Total sectoral emissions in 2022 are
328.52 Gg CO2 / year which is 30.4% of category M.AG emissions. 2023
Emissions have changed by -10.0%
(-35.22 Gg CO2 / year). 1990-2023 Emissions have changed by -0.7% (-3.52 Gg CO2 / year). For 2023 the
changes per gas
are:
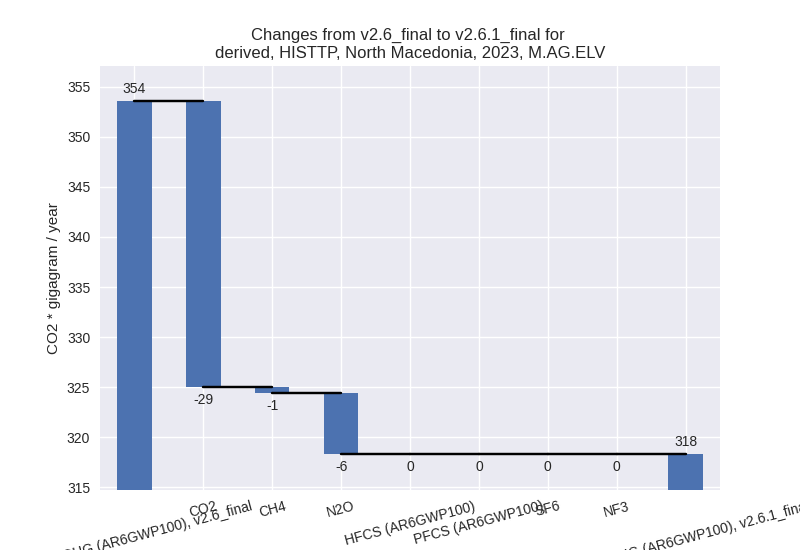
There is no subsector information available in PRIMAP-hist.
- 4: Total sectoral emissions in 2022 are 741.40 Gg
CO2 / year which is 6.5% of M.0.EL emissions. 2023 Emissions have
changed by -7.5% (-61.13 Gg CO2 /
year). 1990-2023 Emissions have changed by -4.6% (-31.70 Gg CO2 / year). For 2023 the
changes per gas
are:

For 1990-2023 the changes per gas are:
- 5: Total sectoral emissions in 2022 are 27.01 Gg
CO2 / year which is 0.2% of M.0.EL emissions. 2023 Emissions have
changed by -10.0% (-3.02 Gg CO2 /
year). 1990-2023 Emissions have changed by -17.0% (-6.69 Gg CO2 / year). For 2023 the
changes per gas
are:

For 1990-2023 the changes per gas are: