Changes in PRIMAP-hist v2.6.1_final compared to v2.6_final for Myanmar
2025-03-19
Johannes Gütschow
Change analysis for Myanmar for PRIMAP-hist v2.6.1_final compared to v2.6_final
Overview over emissions by sector and gas
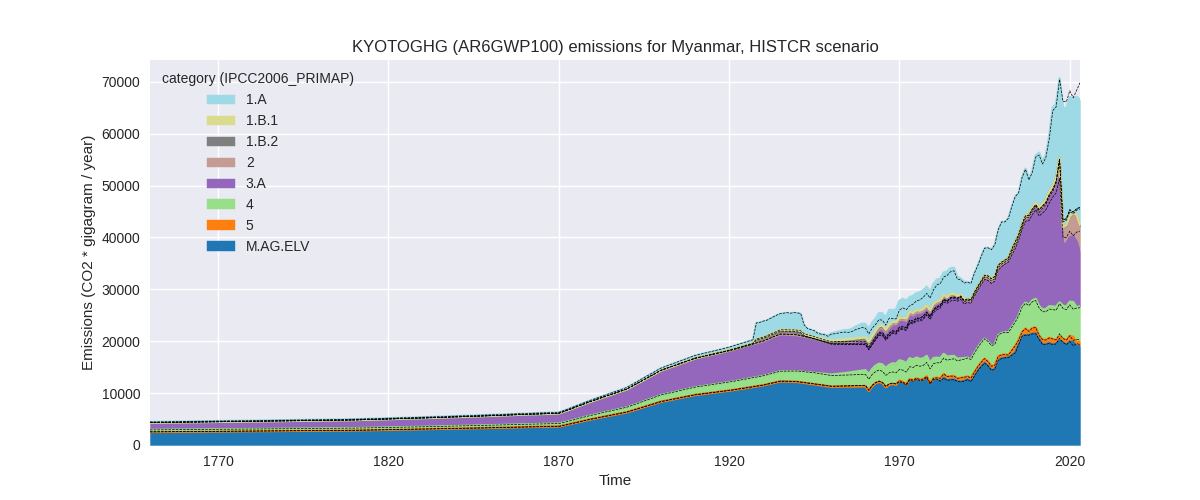
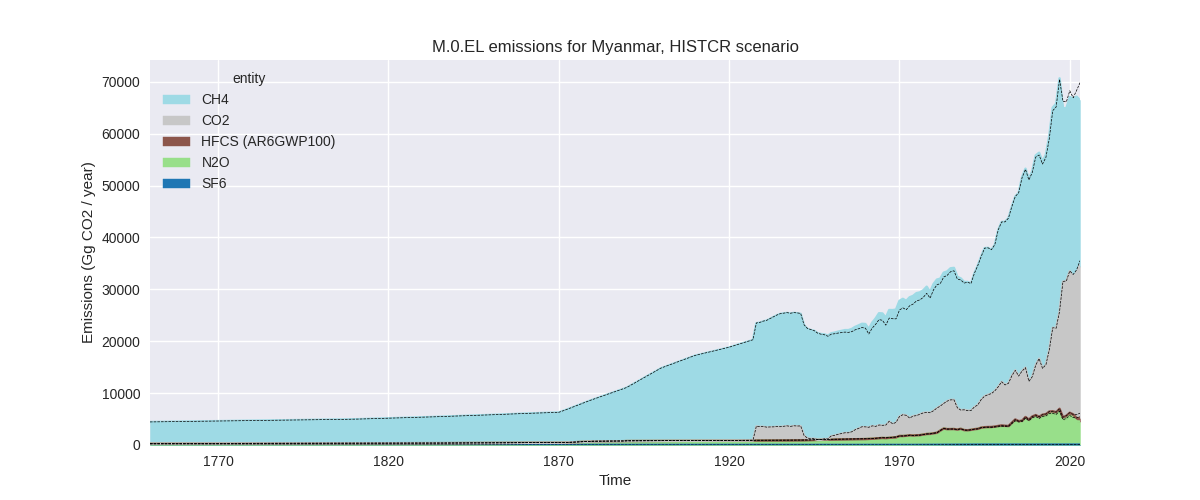
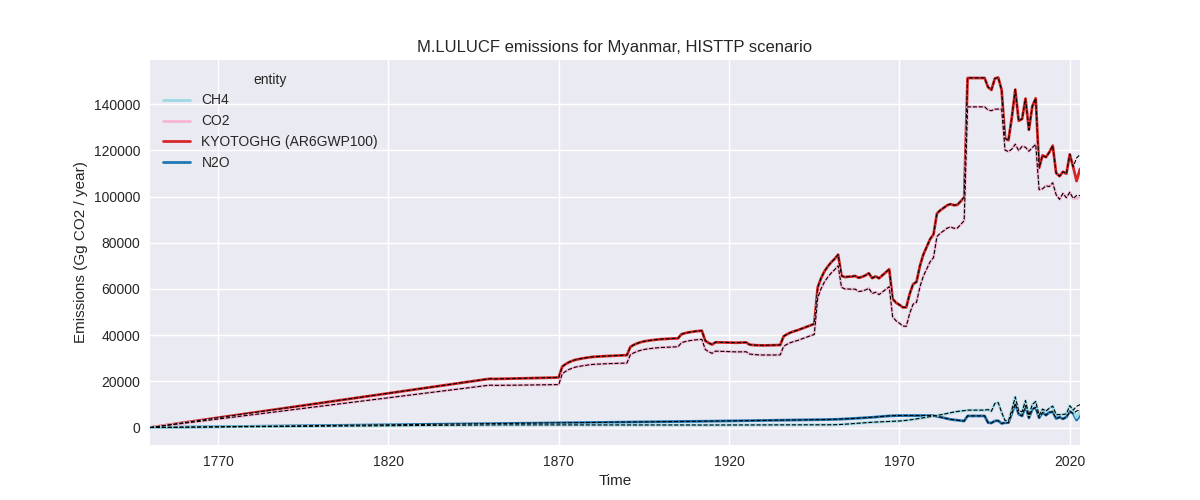
The following figures show the aggregate national total emissions excluding LULUCF AR6GWP100 for the country reported priority scenario. The dotted linesshow the v2.6_final data.
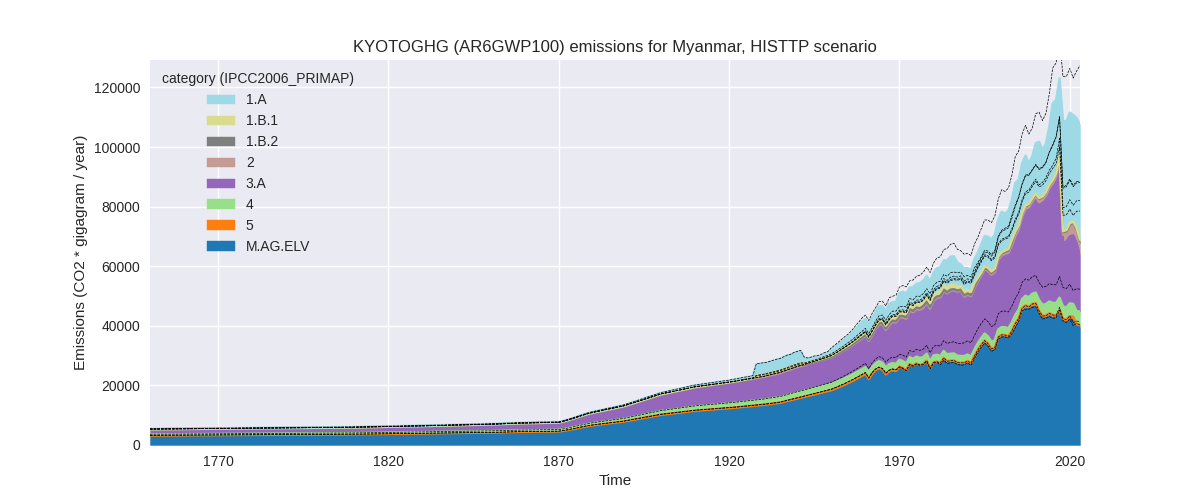
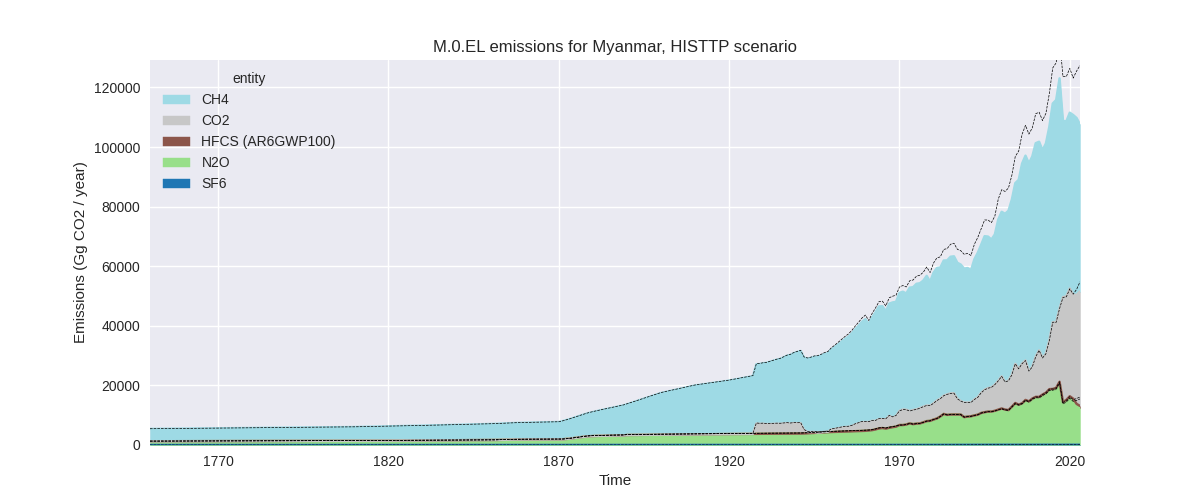
The following figures show the aggregate national total emissions excluding LULUCF AR6GWP100 for the third party priority scenario. The dotted linesshow the v2.6_final data.
Overview over changes
In the country reported priority scenario we have the following changes for aggregate Kyoto GHG and national total emissions excluding LULUCF (M.0.EL):
- Emissions in 2023 have changed by -4.9%% (-3395.63 Gg CO2 / year)
- Emissions in 1990-2023 have changed by -0.2%% (-122.60 Gg CO2 / year)
In the third party priority scenario we have the following changes for aggregate Kyoto GHG and national total emissions excluding LULUCF (M.0.EL):
- Emissions in 2023 have changed by -15.6%% (-19842.43 Gg CO2 / year)
- Emissions in 1990-2023 have changed by -9.6%% (-9570.39 Gg CO2 / year)
Most important changes per scenario and time frame
In the country reported priority scenario the following sector-gas combinations have the highest absolute impact on national total KyotoGHG (AR6GWP100) emissions in 2023 (top 5):
- 1: 3.A, CH4 with -4326.28 Gg CO2 / year (-29.4%)
- 2: M.AG.ELV, CH4 with 1230.72 Gg CO2 / year (8.7%)
- 3: M.AG.ELV, N2O with -874.28 Gg CO2 / year (-26.5%)
- 4: 2, CO2 with 705.23 Gg CO2 / year (20.0%)
- 5: M.AG.ELV, CO2 with -695.49 Gg CO2 / year (-36.8%)
In the country reported priority scenario the following sector-gas combinations have the highest absolute impact on national total KyotoGHG (AR6GWP100) emissions in 1990-2023 (top 5):
- 1: 3.A, CH4 with -387.71 Gg CO2 / year (-2.6%)
- 2: 4, CH4 with 247.17 Gg CO2 / year (5.9%)
- 3: M.AG.ELV, CH4 with 77.92 Gg CO2 / year (0.5%)
- 4: M.AG.ELV, CO2 with -51.81 Gg CO2 / year (-13.5%)
- 5: M.AG.ELV, N2O with -46.08 Gg CO2 / year (-1.6%)
In the third party priority scenario the following sector-gas combinations have the highest absolute impact on national total KyotoGHG (AR6GWP100) emissions in 2023 (top 5):
- 1: 3.A, CH4 with -7064.26 Gg CO2 / year (-29.4%)
- 2: 4, CH4 with -6521.32 Gg CO2 / year (-65.5%)
- 3: 1.B.2, CH4 with -5307.91 Gg CO2 / year (-89.1%)
- 4: M.AG.ELV, N2O with -2655.60 Gg CO2 / year (-26.4%)
- 5: M.AG.ELV, CH4 with 2461.93 Gg CO2 / year (8.7%)
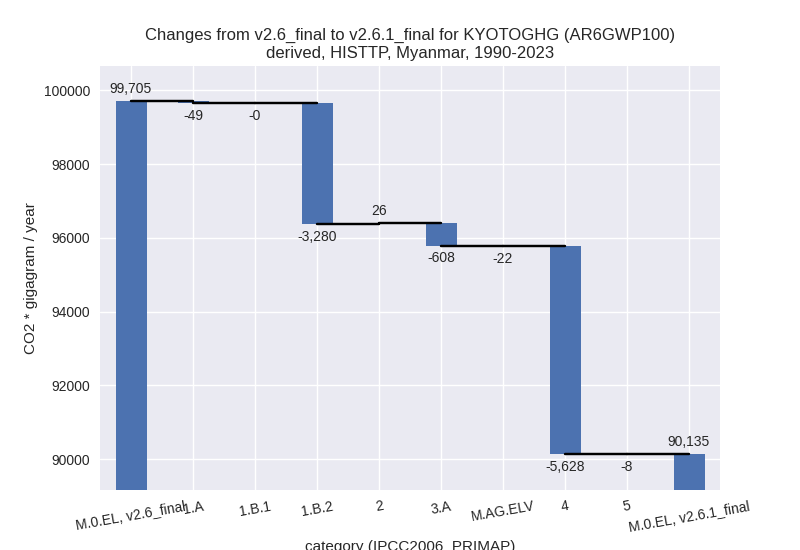
In the third party priority scenario the following sector-gas combinations have the highest absolute impact on national total KyotoGHG (AR6GWP100) emissions in 1990-2023 (top 5):
- 1: 4, CH4 with -5628.67 Gg CO2 / year (-68.5%)
- 2: 1.B.2, CH4 with -3280.60 Gg CO2 / year (-86.5%)
- 3: 3.A, CH4 with -633.08 Gg CO2 / year (-2.6%)
- 4: M.AG.ELV, CH4 with 153.43 Gg CO2 / year (0.5%)
- 5: M.AG.ELV, N2O with -123.53 Gg CO2 / year (-1.4%)
Notes on data changes
Here we list notes explaining important emissions changes for the country.
- No new country reported data has been included. Country reported data only covers a very short period of time and therefore changes in third party data (EDGAR, FAO) greatly affect emissions in the CR time-series. FAO data changes are limited to the latest years while for EDGAR fill time-series have changed.
- Changes int he TP scenario come from the same sectors and the same input data sources.
Changes by sector and gas
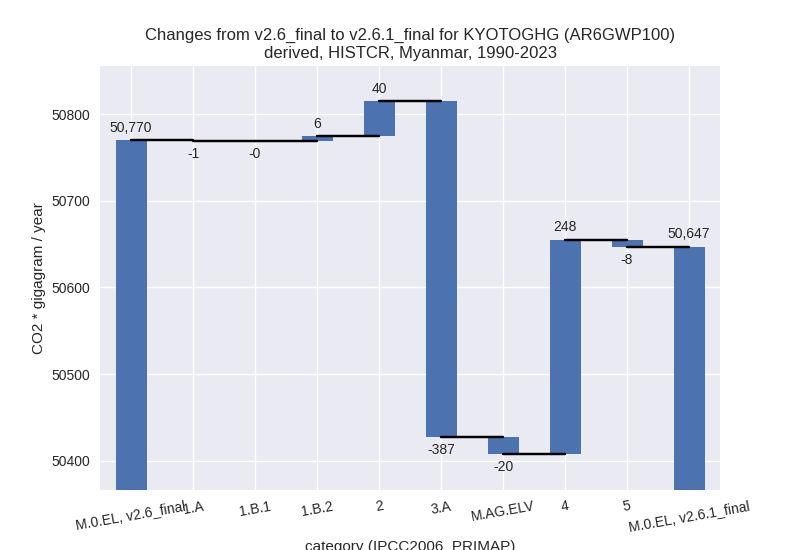
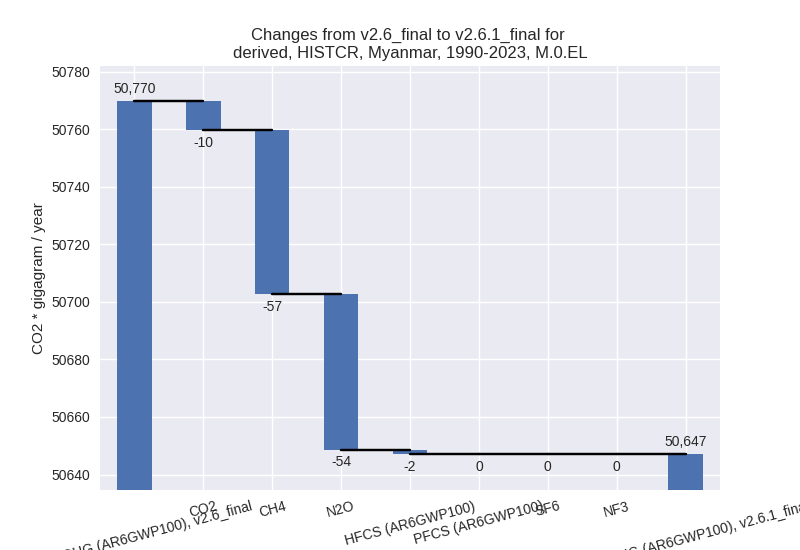
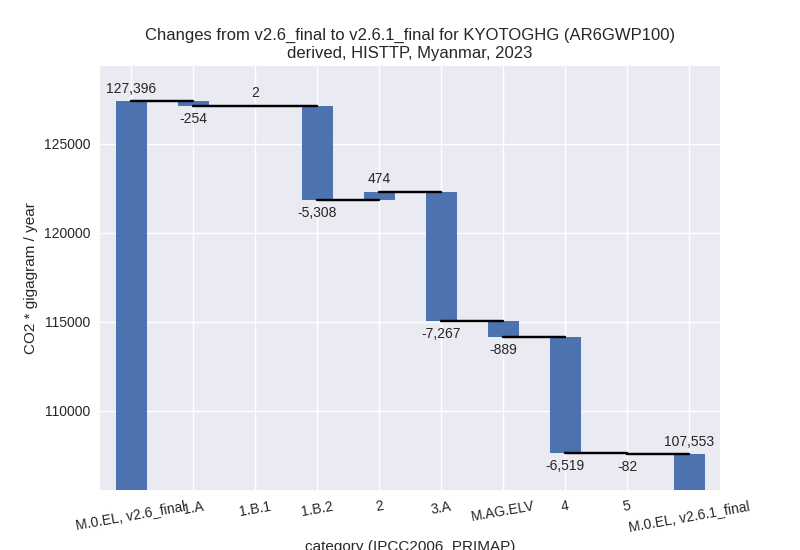
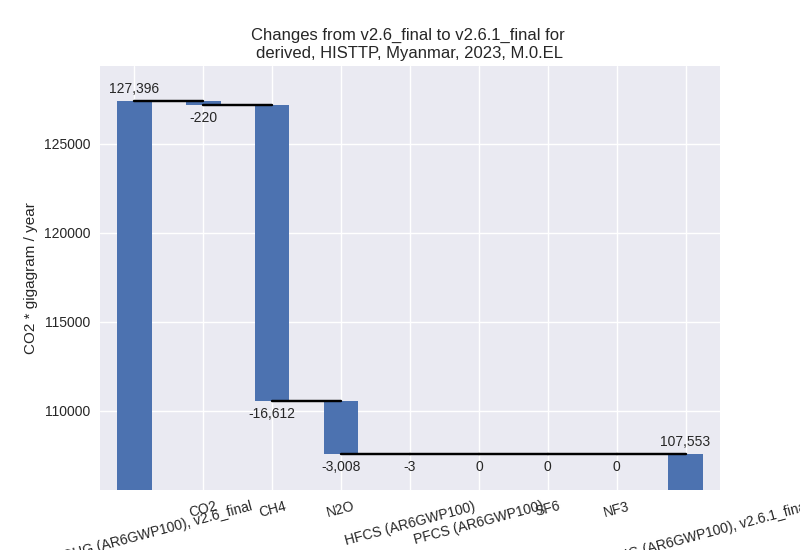
For each scenario and time frame the changes are displayed for all individual sectors and all individual gases. In the sector plot we use aggregate Kyoto GHGs in AR6GWP100. In the gas plot we usenational total emissions without LULUCF.
country reported scenario
2023
1990-2023
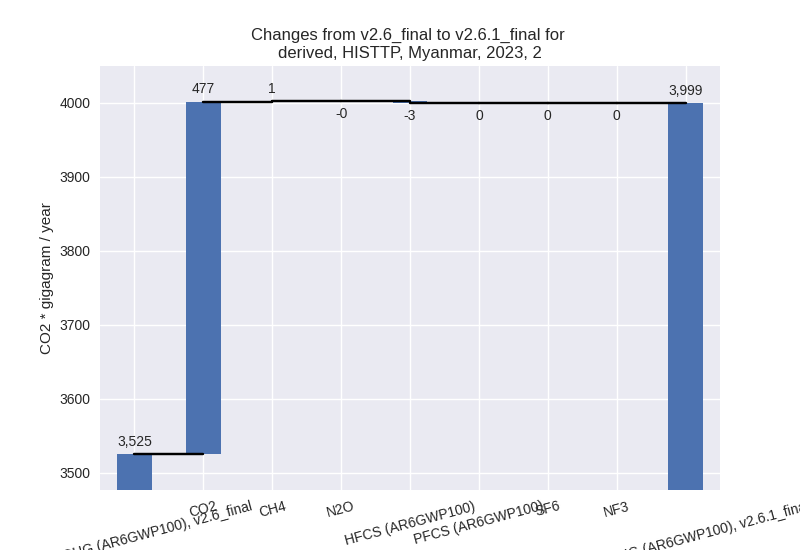
third party scenario
2023
1990-2023

Detailed changes for the scenarios:
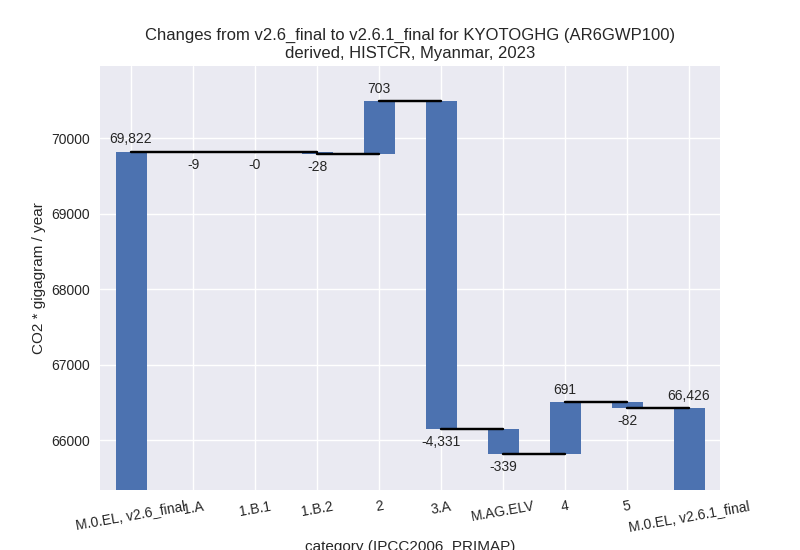
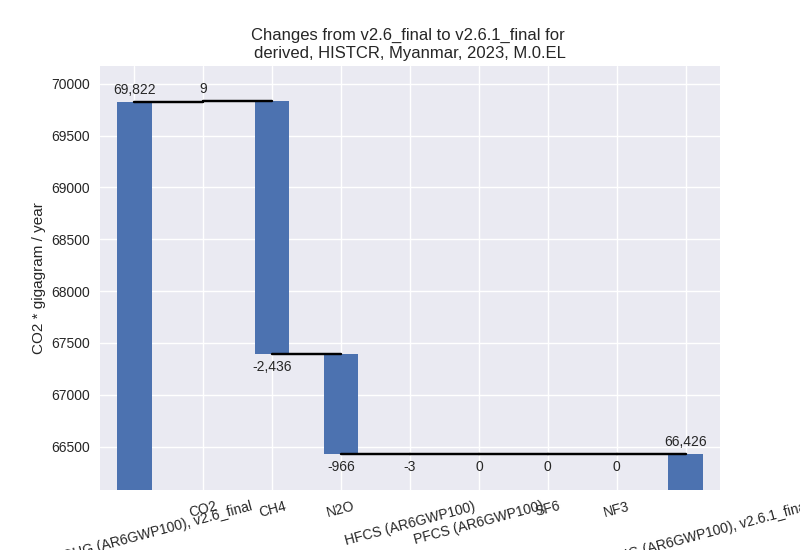
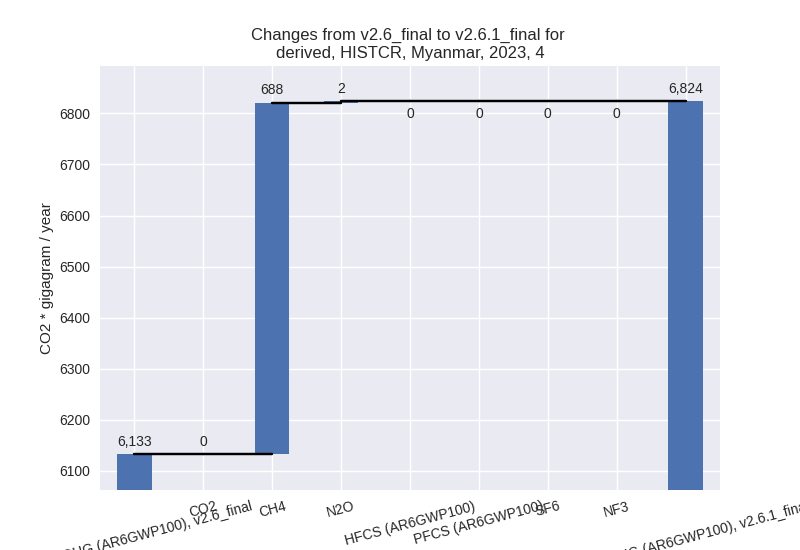
country reported scenario (HISTCR):
Most important changes per time frame
For 2023 the following sector-gas combinations have the highest absolute impact on national total KyotoGHG (AR6GWP100) emissions in 2023 (top 5):
- 1: 3.A, CH4 with -4326.28 Gg CO2 / year (-29.4%)
- 2: M.AG.ELV, CH4 with 1230.72 Gg CO2 / year (8.7%)
- 3: M.AG.ELV, N2O with -874.28 Gg CO2 / year (-26.5%)
- 4: 2, CO2 with 705.23 Gg CO2 / year (20.0%)
- 5: M.AG.ELV, CO2 with -695.49 Gg CO2 / year (-36.8%)
For 1990-2023 the following sector-gas combinations have the highest absolute impact on national total KyotoGHG (AR6GWP100) emissions in 1990-2023 (top 5):
- 1: 3.A, CH4 with -387.71 Gg CO2 / year (-2.6%)
- 2: 4, CH4 with 247.17 Gg CO2 / year (5.9%)
- 3: M.AG.ELV, CH4 with 77.92 Gg CO2 / year (0.5%)
- 4: M.AG.ELV, CO2 with -51.81 Gg CO2 / year (-13.5%)
- 5: M.AG.ELV, N2O with -46.08 Gg CO2 / year (-1.6%)
Changes in the main sectors for aggregate KyotoGHG (AR6GWP100) are
- 1: Total sectoral emissions in 2022 are 23046.15 Gg CO2 / year which is 34.3% of M.0.EL emissions. 2023 Emissions have changed by -0.2% (-36.89 Gg CO2 / year). 1990-2023 Emissions have changed by 0.0% (4.75 Gg CO2 / year).
- 2: Total sectoral emissions in 2022 are 4938.77 Gg
CO2 / year which is 7.4% of M.0.EL emissions. 2023 Emissions have
changed by 16.5% (702.97 Gg CO2 /
year). 1990-2023 Emissions have changed by 3.1% (40.32 Gg CO2 / year). For 2023 the
changes per gas
are:
For 1990-2023 the changes per gas are: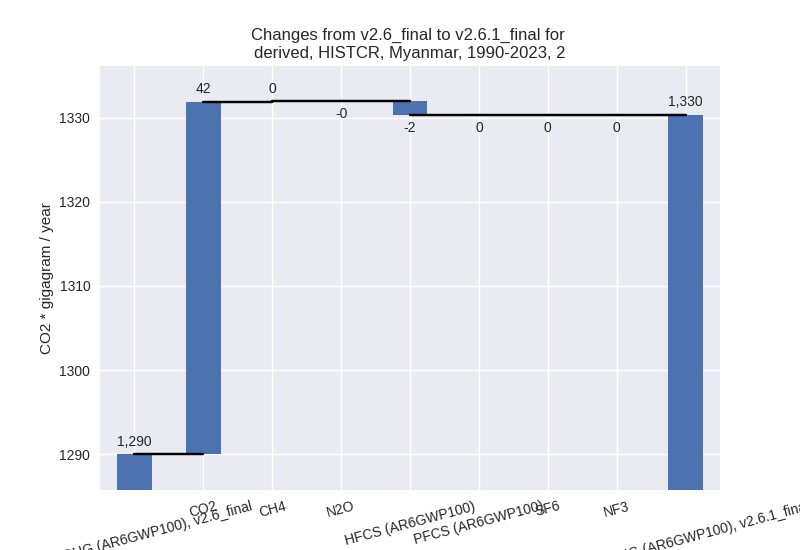
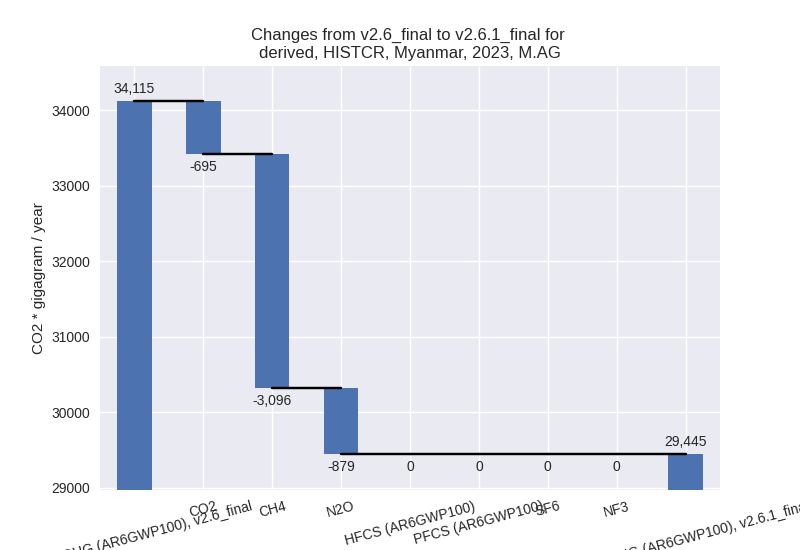
- M.AG: Total sectoral emissions in 2022 are 31629.34
Gg CO2 / year which is 47.1% of M.0.EL emissions. 2023 Emissions have
changed by -13.7% (-4670.35 Gg CO2 /
year). 1990-2023 Emissions have changed by -1.2% (-407.07 Gg CO2 / year). For 2023
the changes per gas
are:
The changes come from the following subsectors:- 3.A: Total sectoral emissions in 2022 are 12613.58
Gg CO2 / year which is 39.9% of category M.AG emissions. 2023 Emissions
have changed by -29.3% (-4331.31 Gg
CO2 / year). 1990-2023 Emissions have changed by -2.6% (-387.10 Gg CO2 / year). For 2023
the changes per gas
are:

For 1990-2023 the changes per gas are:
There is no subsector information available in PRIMAP-hist. - M.AG.ELV: Total sectoral emissions in 2022 are 19015.76 Gg CO2 / year which is 60.1% of category M.AG emissions. 2023 Emissions have changed by -1.8% (-339.04 Gg CO2 / year). 1990-2023 Emissions have changed by -0.1% (-19.97 Gg CO2 / year).
- 3.A: Total sectoral emissions in 2022 are 12613.58
Gg CO2 / year which is 39.9% of category M.AG emissions. 2023 Emissions
have changed by -29.3% (-4331.31 Gg
CO2 / year). 1990-2023 Emissions have changed by -2.6% (-387.10 Gg CO2 / year). For 2023
the changes per gas
are:
- 4: Total sectoral emissions in 2022 are 6744.87 Gg
CO2 / year which is 10.0% of M.0.EL emissions. 2023 Emissions have
changed by 11.3% (690.93 Gg CO2 /
year). 1990-2023 Emissions have changed by 5.1% (247.56 Gg CO2 / year). For 2023 the
changes per gas
are:
For 1990-2023 the changes per gas are:
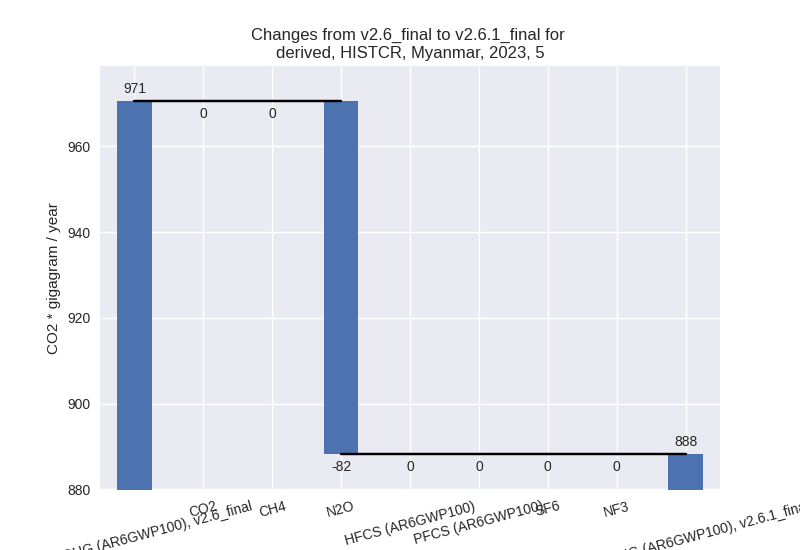
- 5: Total sectoral emissions in 2022 are 761.18 Gg
CO2 / year which is 1.1% of M.0.EL emissions. 2023 Emissions have
changed by -8.5% (-82.29 Gg CO2 /
year). 1990-2023 Emissions have changed by -0.9% (-8.15 Gg CO2 / year). For 2023 the
changes per gas
are:
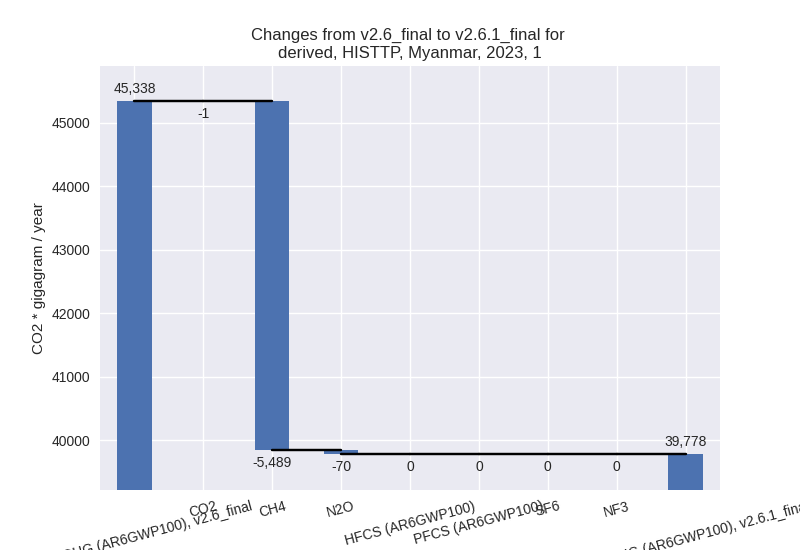
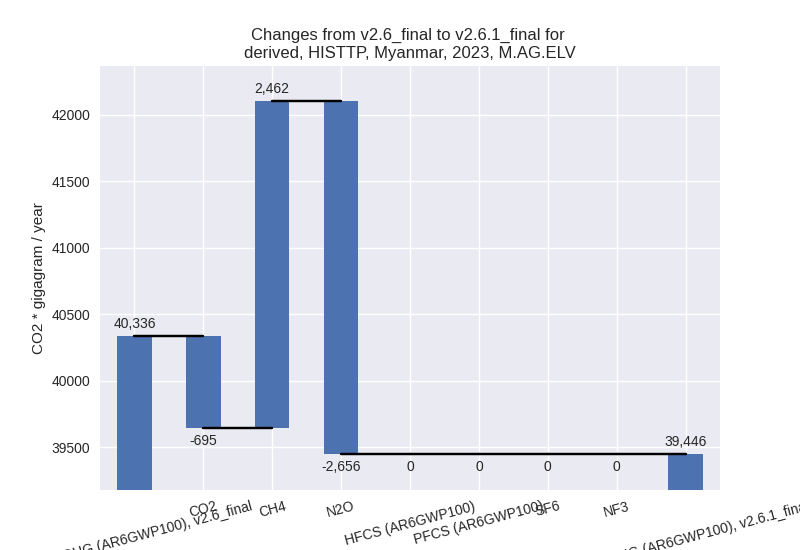
third party scenario (HISTTP):
Most important changes per time frame
For 2023 the following sector-gas combinations have the highest absolute impact on national total KyotoGHG (AR6GWP100) emissions in 2023 (top 5):
- 1: 3.A, CH4 with -7064.26 Gg CO2 / year (-29.4%)
- 2: 4, CH4 with -6521.32 Gg CO2 / year (-65.5%)
- 3: 1.B.2, CH4 with -5307.91 Gg CO2 / year (-89.1%)
- 4: M.AG.ELV, N2O with -2655.60 Gg CO2 / year (-26.4%)
- 5: M.AG.ELV, CH4 with 2461.93 Gg CO2 / year (8.7%)
For 1990-2023 the following sector-gas combinations have the highest absolute impact on national total KyotoGHG (AR6GWP100) emissions in 1990-2023 (top 5):
- 1: 4, CH4 with -5628.67 Gg CO2 / year (-68.5%)
- 2: 1.B.2, CH4 with -3280.60 Gg CO2 / year (-86.5%)
- 3: 3.A, CH4 with -633.08 Gg CO2 / year (-2.6%)
- 4: M.AG.ELV, CH4 with 153.43 Gg CO2 / year (0.5%)
- 5: M.AG.ELV, N2O with -123.53 Gg CO2 / year (-1.4%)
Changes in the main sectors for aggregate KyotoGHG (AR6GWP100) are
- 1: Total sectoral emissions in 2022 are 37971.65 Gg
CO2 / year which is 34.6% of M.0.EL emissions. 2023 Emissions have
changed by -12.3% (-5560.05 Gg CO2 /
year). 1990-2023 Emissions have changed by -14.5% (-3329.46 Gg CO2 / year). For 2023
the changes per gas
are:
For 1990-2023 the changes per gas are: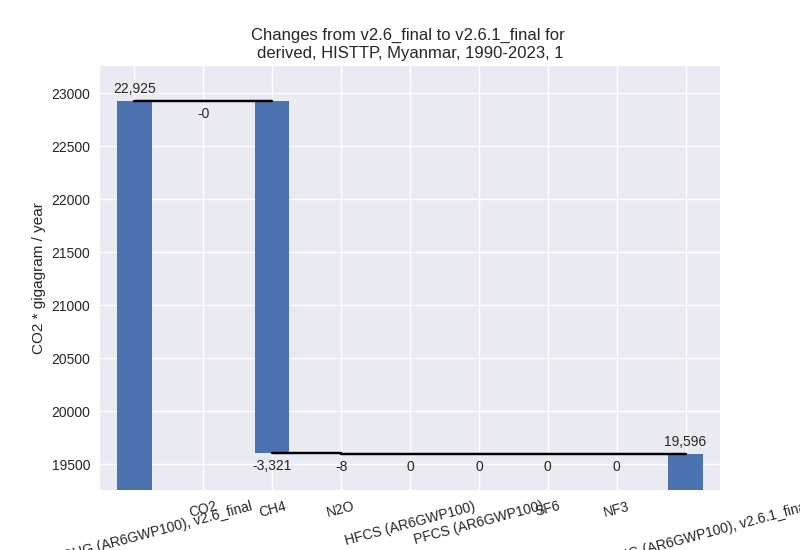
The changes come from the following subsectors:- 1.A: Total sectoral emissions in 2022 are 36813.88 Gg CO2 / year which is 97.0% of category 1 emissions. 2023 Emissions have changed by -0.7% (-254.01 Gg CO2 / year). 1990-2023 Emissions have changed by -0.3% (-48.86 Gg CO2 / year).
- 1.B.1: Total sectoral emissions in 2022 are 437.93 Gg CO2 / year which is 1.2% of category 1 emissions. 2023 Emissions have changed by 0.3% (1.61 Gg CO2 / year). 1990-2023 Emissions have changed by -0.0% (-0.19 Gg CO2 / year).
- 1.B.2: Total sectoral emissions in 2022 are 719.84
Gg CO2 / year which is 1.9% of category 1 emissions. 2023 Emissions have
changed by -88.7% (-5307.65 Gg CO2 /
year). 1990-2023 Emissions have changed by -82.0% (-3280.42 Gg CO2 / year). For 2023
the changes per gas
are:

For 1990-2023 the changes per gas are:
There is no subsector information available in PRIMAP-hist.
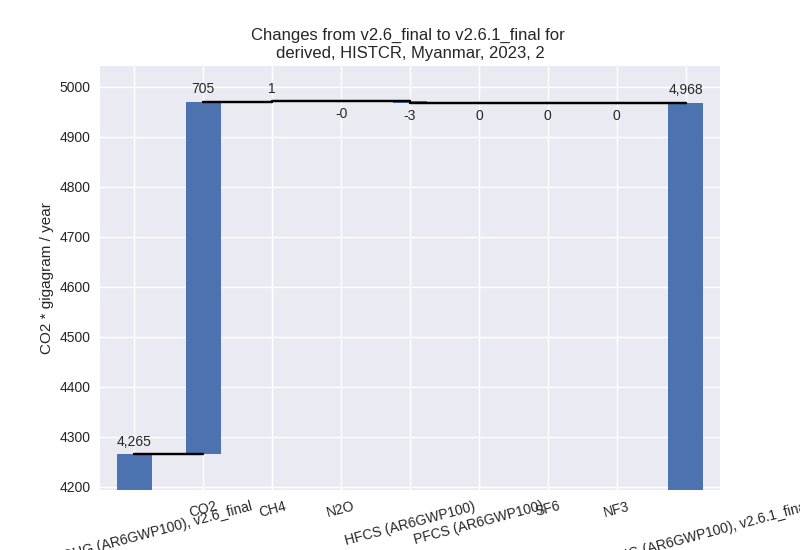
- 2: Total sectoral emissions in 2022 are 3978.12 Gg
CO2 / year which is 3.6% of M.0.EL emissions. 2023 Emissions have
changed by 13.5% (474.46 Gg CO2 /
year). 1990-2023 Emissions have changed by 2.2% (25.84 Gg CO2 / year). For 2023 the
changes per gas
are:
For 1990-2023 the changes per gas are: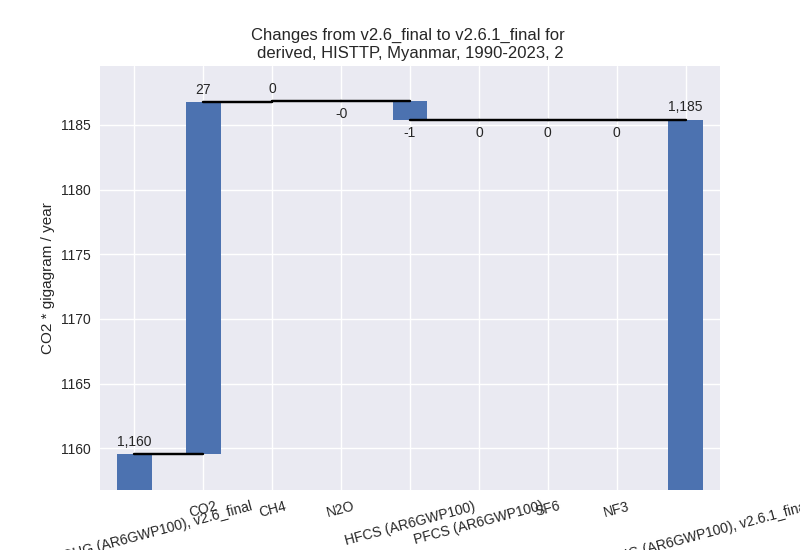
- M.AG: Total sectoral emissions in 2022 are 62636.54
Gg CO2 / year which is 57.1% of M.0.EL emissions. 2023 Emissions have
changed by -12.2% (-8155.83 Gg CO2 /
year). 1990-2023 Emissions have changed by -1.0% (-630.34 Gg CO2 / year). For 2023
the changes per gas
are:
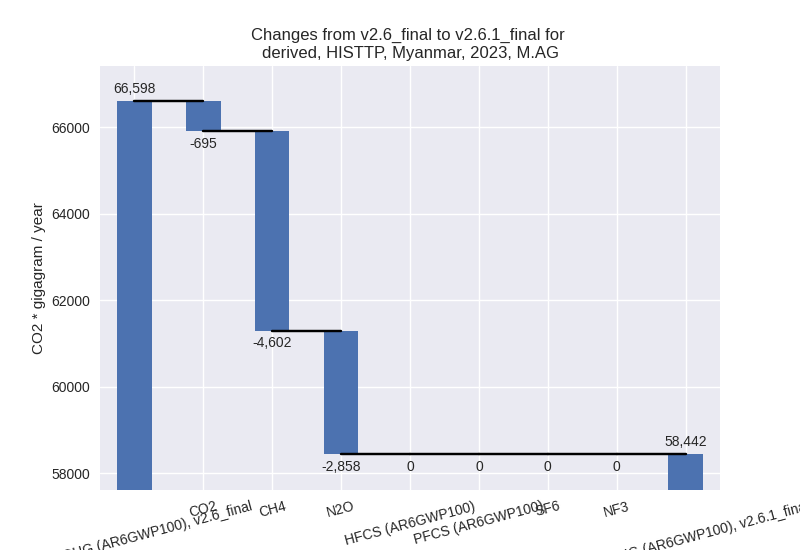
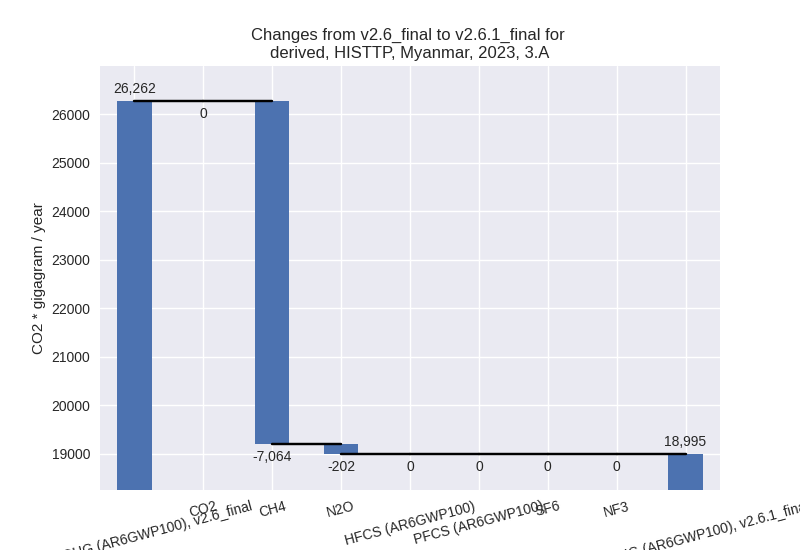
The changes come from the following subsectors:- 3.A: Total sectoral emissions in 2022 are 22884.10
Gg CO2 / year which is 36.5% of category M.AG emissions. 2023 Emissions
have changed by -27.7% (-7266.67 Gg
CO2 / year). 1990-2023 Emissions have changed by -2.2% (-608.43 Gg CO2 / year). For 2023
the changes per gas
are:
For 1990-2023 the changes per gas are: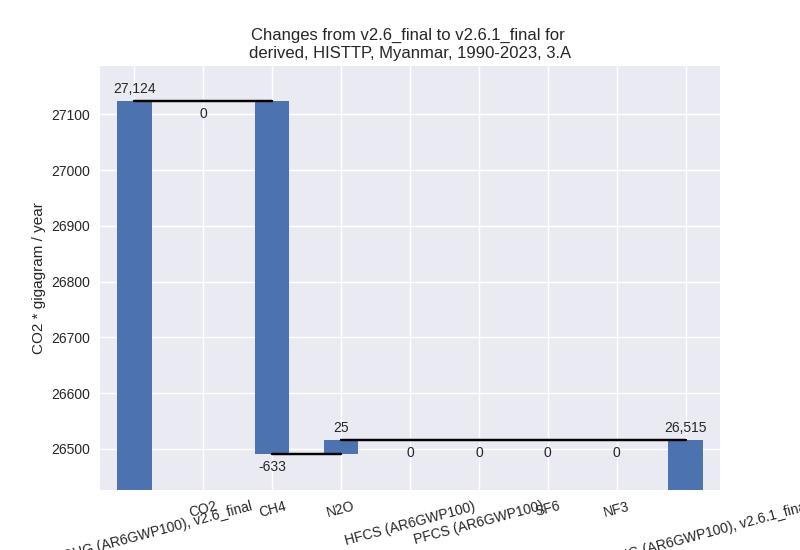
There is no subsector information available in PRIMAP-hist. - M.AG.ELV: Total sectoral emissions in 2022 are
39752.43 Gg CO2 / year which is 63.5% of category M.AG emissions. 2023
Emissions have changed by -2.2%
(-889.16 Gg CO2 / year). 1990-2023 Emissions have changed by -0.1% (-21.91 Gg CO2 / year). For 2023 the
changes per gas
are:
There is no subsector information available in PRIMAP-hist.
- 3.A: Total sectoral emissions in 2022 are 22884.10
Gg CO2 / year which is 36.5% of category M.AG emissions. 2023 Emissions
have changed by -27.7% (-7266.67 Gg
CO2 / year). 1990-2023 Emissions have changed by -2.2% (-608.43 Gg CO2 / year). For 2023
the changes per gas
are:
- 4: Total sectoral emissions in 2022 are 4393.59 Gg
CO2 / year which is 4.0% of M.0.EL emissions. 2023 Emissions have
changed by -59.5% (-6518.72 Gg CO2 /
year). 1990-2023 Emissions have changed by -63.5% (-5628.28 Gg CO2 / year). For 2023
the changes per gas
are:

For 1990-2023 the changes per gas are:
- 5: Total sectoral emissions in 2022 are 761.18 Gg
CO2 / year which is 0.7% of M.0.EL emissions. 2023 Emissions have
changed by -8.5% (-82.29 Gg CO2 /
year). 1990-2023 Emissions have changed by -0.9% (-8.15 Gg CO2 / year). For 2023 the
changes per gas
are:
