Changes in PRIMAP-hist v2.6.1_final compared to v2.6_final for Mongolia
2025-03-19
Johannes Gütschow
Change analysis for Mongolia for PRIMAP-hist v2.6.1_final compared to v2.6_final
Overview over emissions by sector and gas
The following figures show the aggregate national total emissions excluding LULUCF AR6GWP100 for the country reported priority scenario. The dotted linesshow the v2.6_final data.
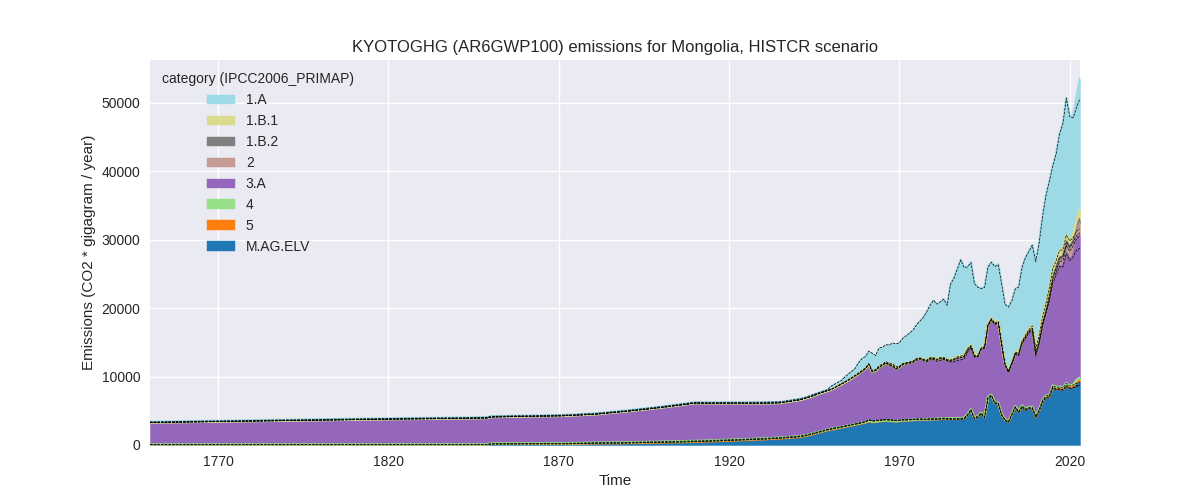
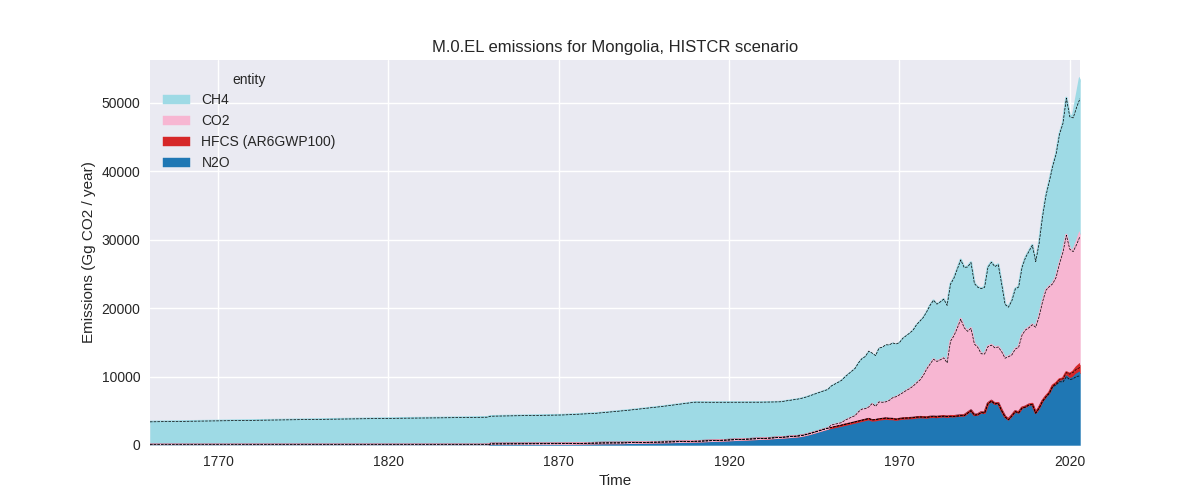
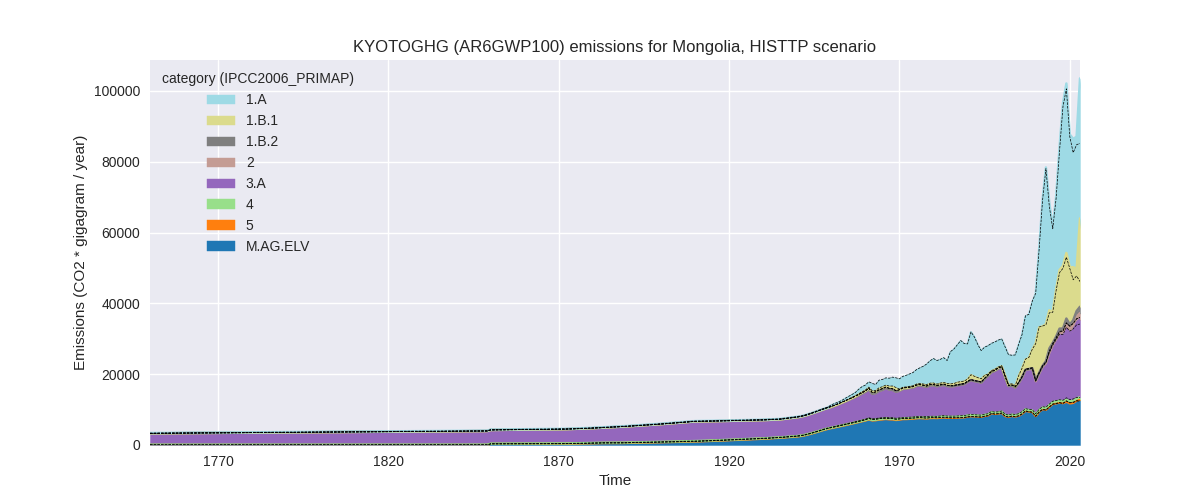
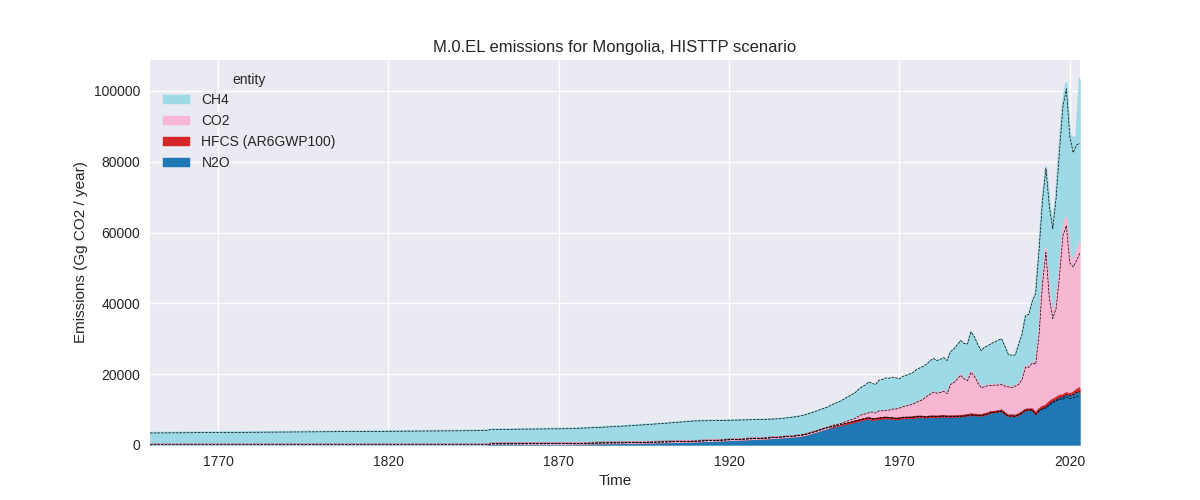
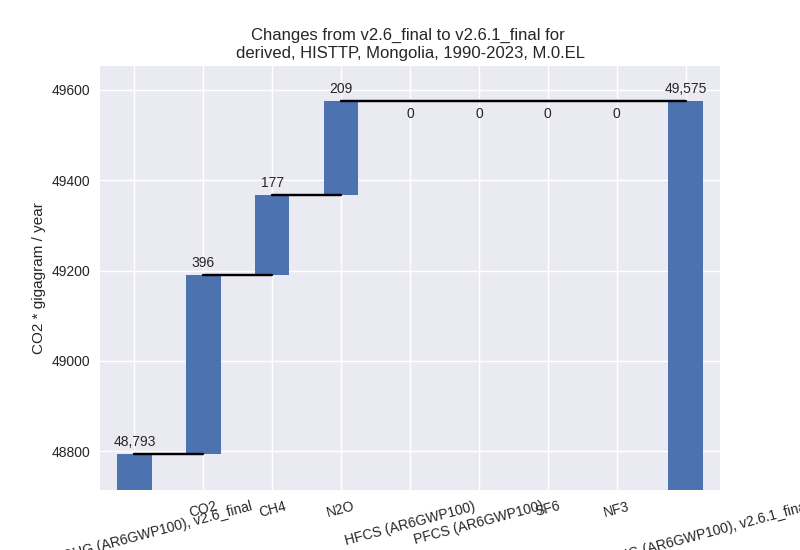
The following figures show the aggregate national total emissions excluding LULUCF AR6GWP100 for the third party priority scenario. The dotted linesshow the v2.6_final data.
Overview over changes
In the country reported priority scenario we have the following changes for aggregate Kyoto GHG and national total emissions excluding LULUCF (M.0.EL):
- Emissions in 2023 have changed by 5.8%% (2948.39 Gg CO2 / year)
- Emissions in 1990-2023 have changed by 0.5%% (170.82 Gg CO2 / year)
In the third party priority scenario we have the following changes for aggregate Kyoto GHG and national total emissions excluding LULUCF (M.0.EL):
- Emissions in 2023 have changed by 21.5%% (18334.49 Gg CO2 / year)
- Emissions in 1990-2023 have changed by 1.6%% (781.62 Gg CO2 / year)
Most important changes per scenario and time frame
In the country reported priority scenario the following sector-gas combinations have the highest absolute impact on national total KyotoGHG (AR6GWP100) emissions in 2023 (top 5):
- 1: 3.A, CH4 with 1134.71 Gg CO2 / year (6.1%)
- 2: 1.B.1, CH4 with 843.70 Gg CO2 / year (146.6%)
- 3: M.AG.ELV, CH4 with 385.45 Gg CO2 / year (269.8%)
- 4: M.AG.ELV, N2O with 265.08 Gg CO2 / year (3.1%)
- 5: 5, N2O with 99.34 Gg CO2 / year (103.8%)
In the country reported priority scenario the following sector-gas combinations have the highest absolute impact on national total KyotoGHG (AR6GWP100) emissions in 1990-2023 (top 5):
- 1: 3.A, CH4 with 56.85 Gg CO2 / year (0.5%)
- 2: 5, N2O with 34.22 Gg CO2 / year (38.8%)
- 3: 1.B.1, CH4 with 28.96 Gg CO2 / year (6.3%)
- 4: M.AG.ELV, CH4 with 21.16 Gg CO2 / year (4.3%)
- 5: M.AG.ELV, N2O with 11.49 Gg CO2 / year (0.2%)
In the third party priority scenario the following sector-gas combinations have the highest absolute impact on national total KyotoGHG (AR6GWP100) emissions in 2023 (top 5):
- 1: 1.B.1, CH4 with 14477.48 Gg CO2 / year (146.2%)
- 2: 1.B.2, CO2 with 1725.53 Gg CO2 / year (inf%)
- 3: 3.A, CH4 with 1168.04 Gg CO2 / year (5.9%)
- 4: 1.A, N2O with 642.43 Gg CO2 / year (321.4%)
- 5: 1.B.1, CO2 with 362.10 Gg CO2 / year (169.5%)
In the third party priority scenario the following sector-gas combinations have the highest absolute impact on national total KyotoGHG (AR6GWP100) emissions in 1990-2023 (top 5):
- 1: 1.B.1, CH4 with 493.50 Gg CO2 / year (8.4%)
- 2: 1.B.2, CO2 with 381.72 Gg CO2 / year (7612.4%)
- 3: 4, CH4 with -252.90 Gg CO2 / year (-42.2%)
- 4: 1.A, N2O with 190.37 Gg CO2 / year (177.1%)
- 5: 1.A, CH4 with -113.75 Gg CO2 / year (-38.1%)
Notes on data changes
Here we list notes explaining important emissions changes for the country.
- No new country reported data has been included. Changes in the CR time-series come from updated third party data (EDGAR, FAO) which is used to extrapolate the country reported data and are mostly limited to the latest years.
- In the TP scenario changes come from EDGAR and FAO data. Especially EDGAR data for the energy sector has very high relative changes. Waste CH4 is also much lower than in the last EDGAR version.
Changes by sector and gas
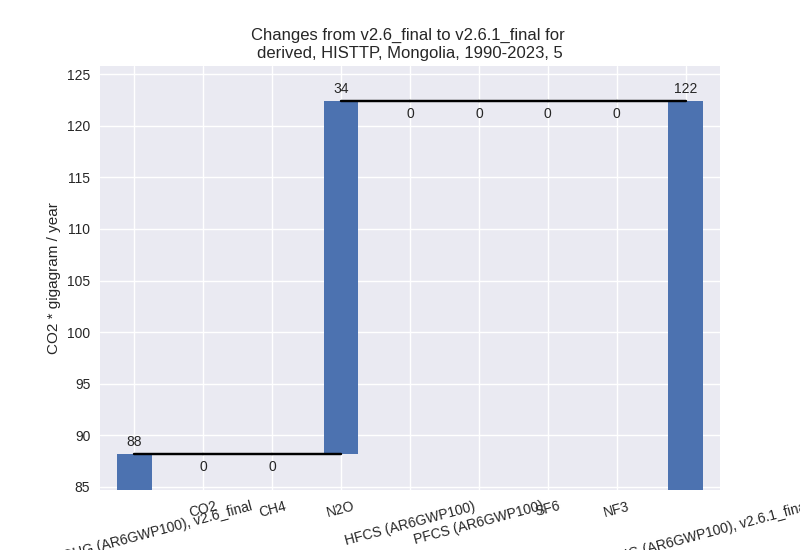
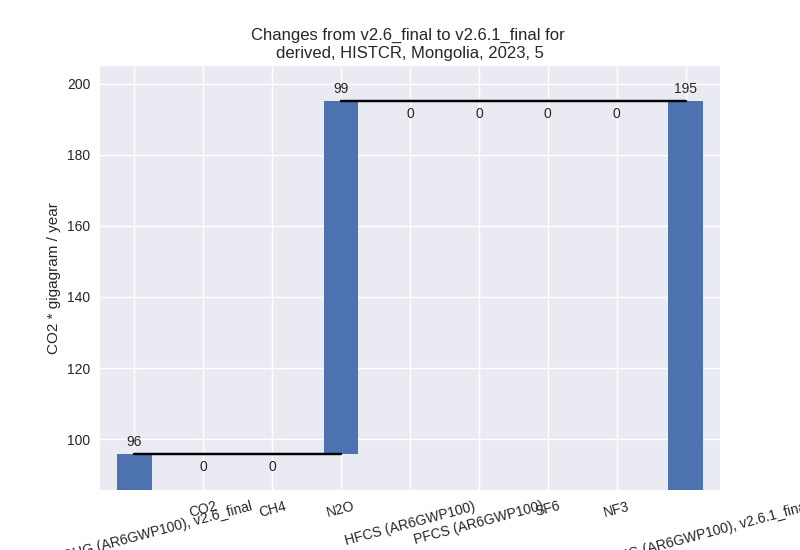
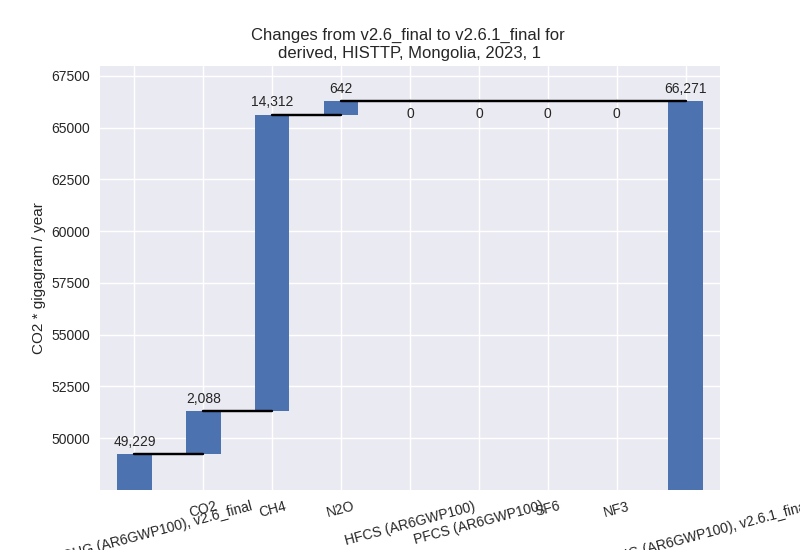
For each scenario and time frame the changes are displayed for all individual sectors and all individual gases. In the sector plot we use aggregate Kyoto GHGs in AR6GWP100. In the gas plot we usenational total emissions without LULUCF.
country reported scenario
2023

1990-2023
third party scenario
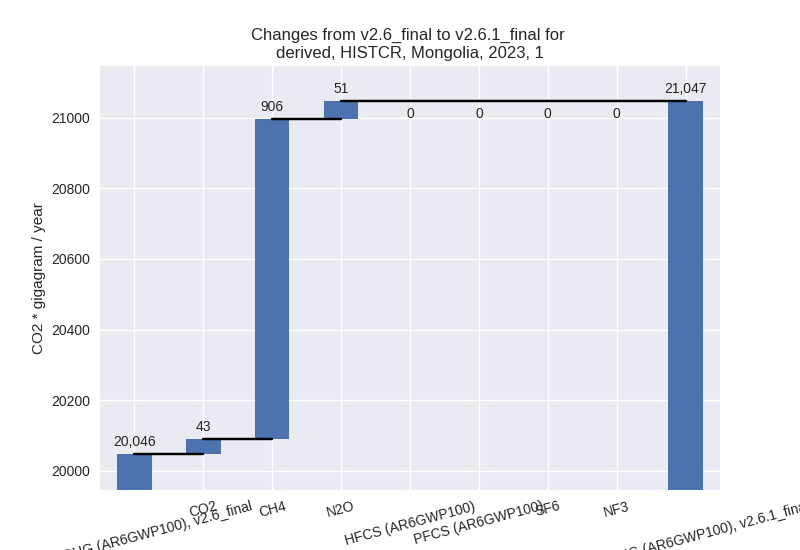
2023

1990-2023
Detailed changes for the scenarios:
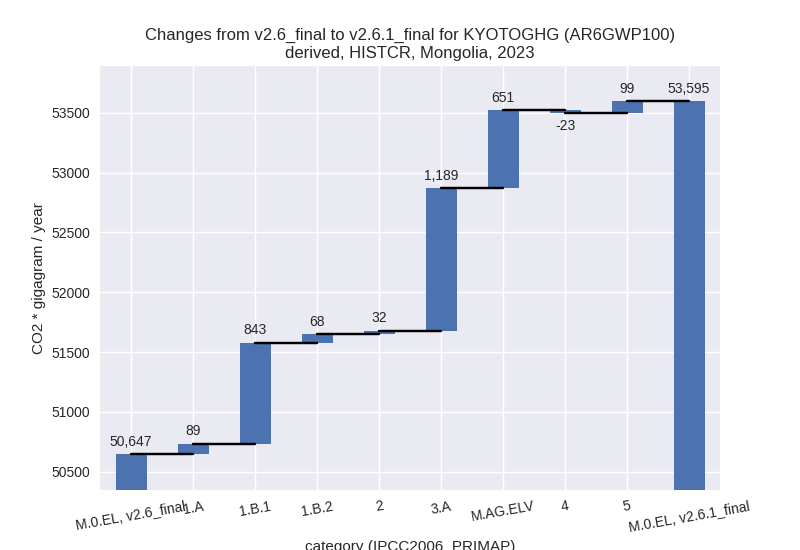
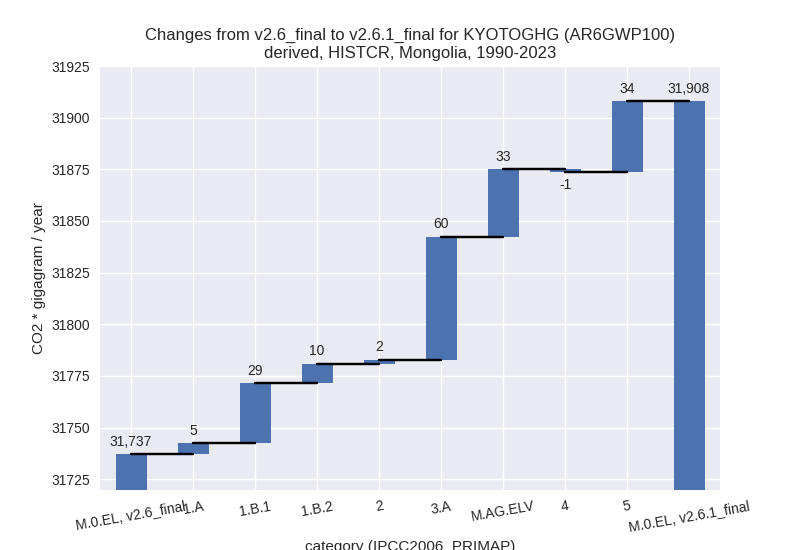
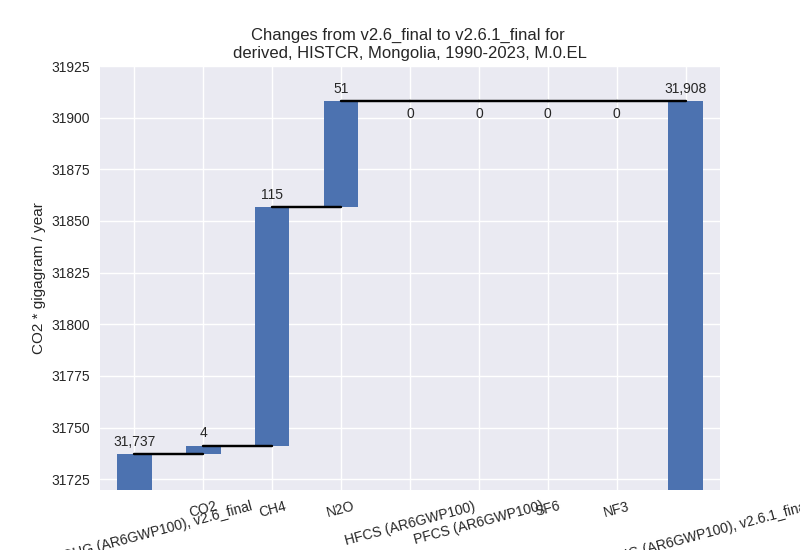
country reported scenario (HISTCR):
Most important changes per time frame
For 2023 the following sector-gas combinations have the highest absolute impact on national total KyotoGHG (AR6GWP100) emissions in 2023 (top 5):
- 1: 3.A, CH4 with 1134.71 Gg CO2 / year (6.1%)
- 2: 1.B.1, CH4 with 843.70 Gg CO2 / year (146.6%)
- 3: M.AG.ELV, CH4 with 385.45 Gg CO2 / year (269.8%)
- 4: M.AG.ELV, N2O with 265.08 Gg CO2 / year (3.1%)
- 5: 5, N2O with 99.34 Gg CO2 / year (103.8%)
For 1990-2023 the following sector-gas combinations have the highest absolute impact on national total KyotoGHG (AR6GWP100) emissions in 1990-2023 (top 5):
- 1: 3.A, CH4 with 56.85 Gg CO2 / year (0.5%)
- 2: 5, N2O with 34.22 Gg CO2 / year (38.8%)
- 3: 1.B.1, CH4 with 28.96 Gg CO2 / year (6.3%)
- 4: M.AG.ELV, CH4 with 21.16 Gg CO2 / year (4.3%)
- 5: M.AG.ELV, N2O with 11.49 Gg CO2 / year (0.2%)
Changes in the main sectors for aggregate KyotoGHG (AR6GWP100) are
- 1: Total sectoral emissions in 2022 are 19348.00 Gg
CO2 / year which is 38.0% of M.0.EL emissions. 2023 Emissions have
changed by 5.0% (1000.82 Gg CO2 /
year). 1990-2023 Emissions have changed by 0.3% (43.82 Gg CO2 / year). For 2023 the
changes per gas
are:
The changes come from the following subsectors:- 1.A: Total sectoral emissions in 2022 are 18100.65 Gg CO2 / year which is 93.6% of category 1 emissions. 2023 Emissions have changed by 0.5% (89.38 Gg CO2 / year). 1990-2023 Emissions have changed by 0.0% (5.35 Gg CO2 / year).
- 1.B.1: Total sectoral emissions in 2022 are 672.87
Gg CO2 / year which is 3.5% of category 1 emissions. 2023 Emissions have
changed by 146.3% (843.22 Gg CO2 /
year). 1990-2023 Emissions have changed by 6.3% (28.90 Gg CO2 / year). For 2023 the
changes per gas
are:

For 1990-2023 the changes per gas are: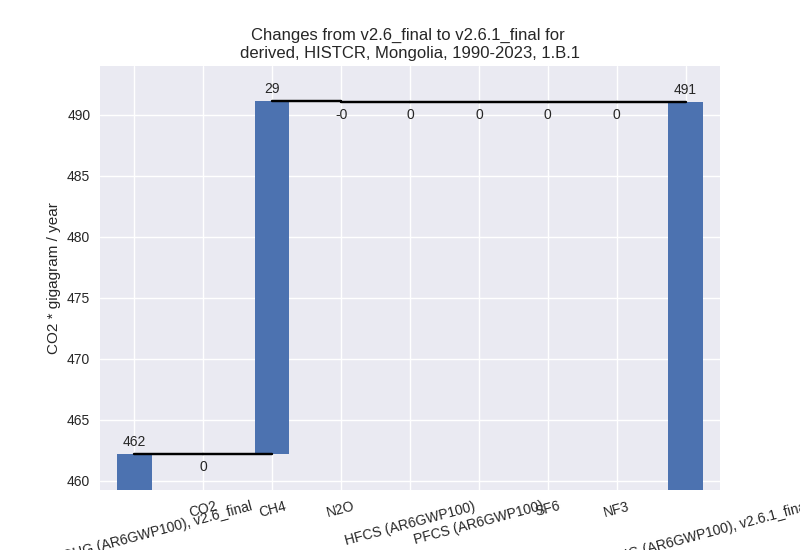
There is no subsector information available in PRIMAP-hist. - 1.B.2: Total sectoral emissions in 2022 are 574.48
Gg CO2 / year which is 3.0% of category 1 emissions. 2023 Emissions have
changed by 15.8% (68.22 Gg CO2 /
year). 1990-2023 Emissions have changed by 4.5% (9.57 Gg CO2 / year). For 2023 the
changes per gas
are:
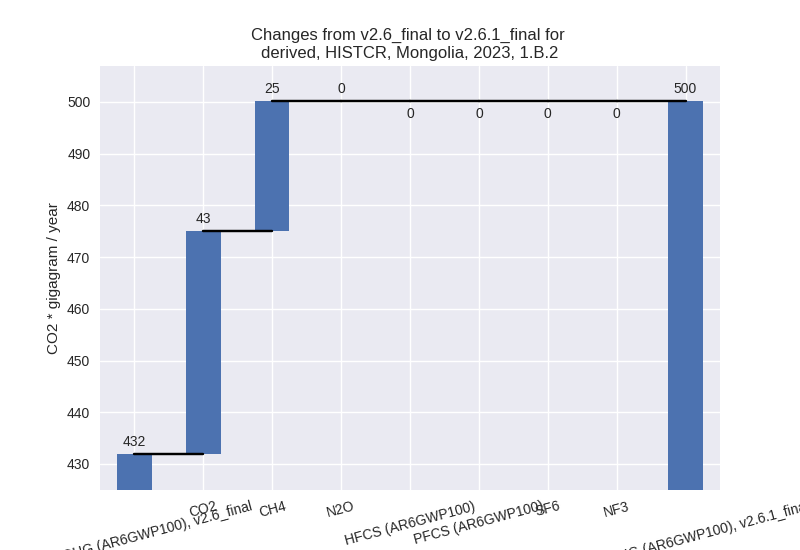
For 1990-2023 the changes per gas are: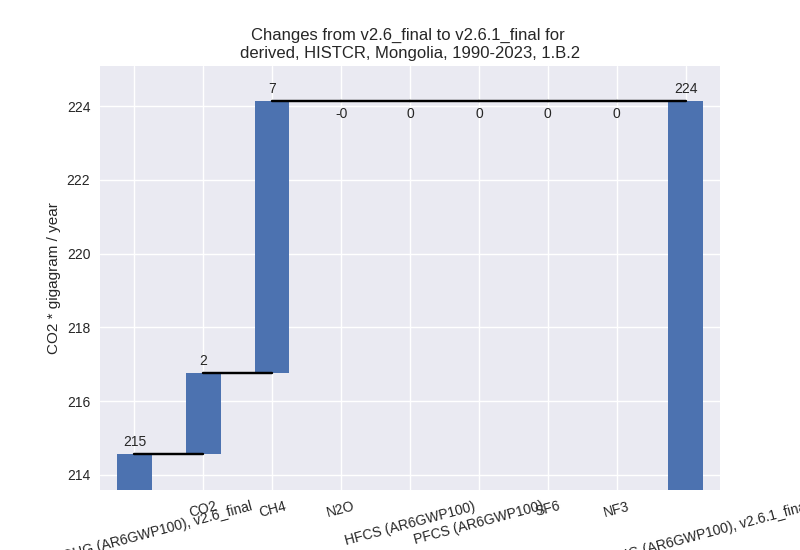
There is no subsector information available in PRIMAP-hist.
- 2: Total sectoral emissions in 2022 are 1738.35 Gg CO2 / year which is 3.4% of M.0.EL emissions. 2023 Emissions have changed by 1.7% (31.62 Gg CO2 / year). 1990-2023 Emissions have changed by 0.5% (1.86 Gg CO2 / year).
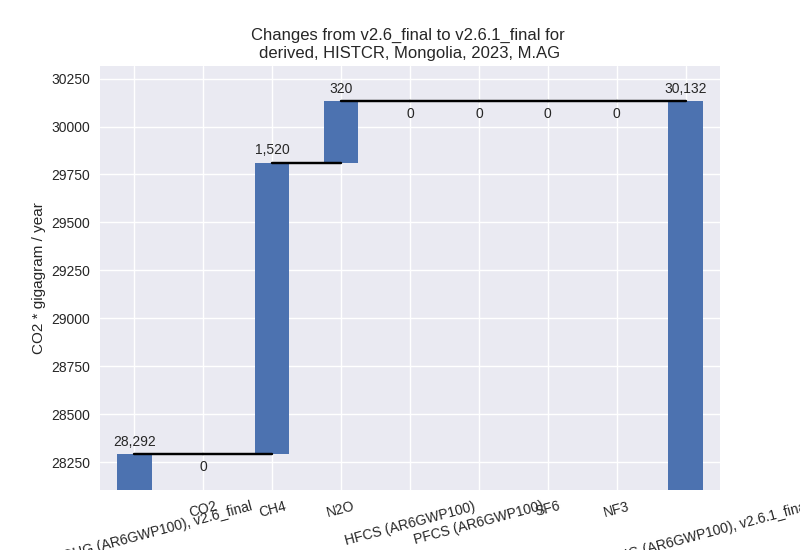
- M.AG: Total sectoral emissions in 2022 are 29343.48
Gg CO2 / year which is 57.7% of M.0.EL emissions. 2023 Emissions have
changed by 6.5% (1839.72 Gg CO2 /
year). 1990-2023 Emissions have changed by 0.5% (92.29 Gg CO2 / year). For 2023 the
changes per gas
are:
The changes come from the following subsectors:- 3.A: Total sectoral emissions in 2022 are 20288.12
Gg CO2 / year which is 69.1% of category M.AG emissions. 2023 Emissions
have changed by 6.1% (1189.19 Gg CO2
/ year). 1990-2023 Emissions have changed by 0.5% (59.64 Gg CO2 / year). For 2023 the
changes per gas
are:

There is no subsector information available in PRIMAP-hist. - M.AG.ELV: Total sectoral emissions in 2022 are
9055.36 Gg CO2 / year which is 30.9% of category M.AG emissions. 2023
Emissions have changed by 7.5%
(650.52 Gg CO2 / year). 1990-2023 Emissions have changed by 0.5% (32.65 Gg CO2 / year). For 2023 the
changes per gas
are:
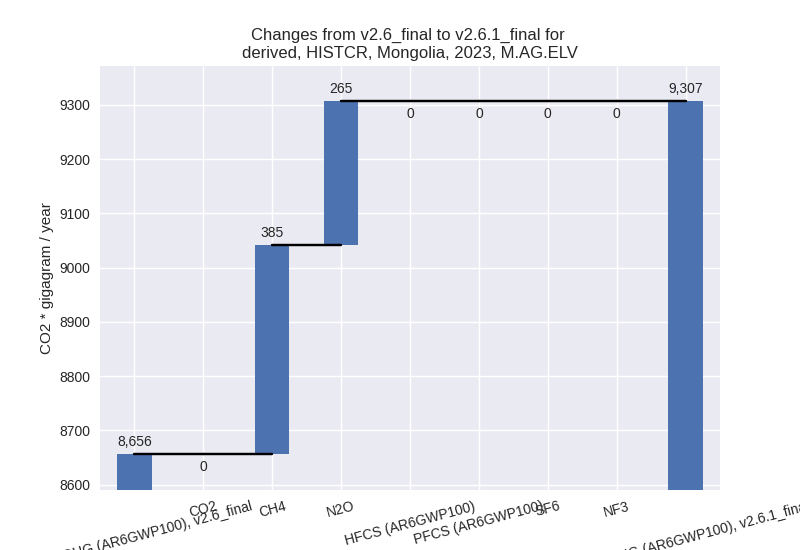
There is no subsector information available in PRIMAP-hist.
- 3.A: Total sectoral emissions in 2022 are 20288.12
Gg CO2 / year which is 69.1% of category M.AG emissions. 2023 Emissions
have changed by 6.1% (1189.19 Gg CO2
/ year). 1990-2023 Emissions have changed by 0.5% (59.64 Gg CO2 / year). For 2023 the
changes per gas
are:
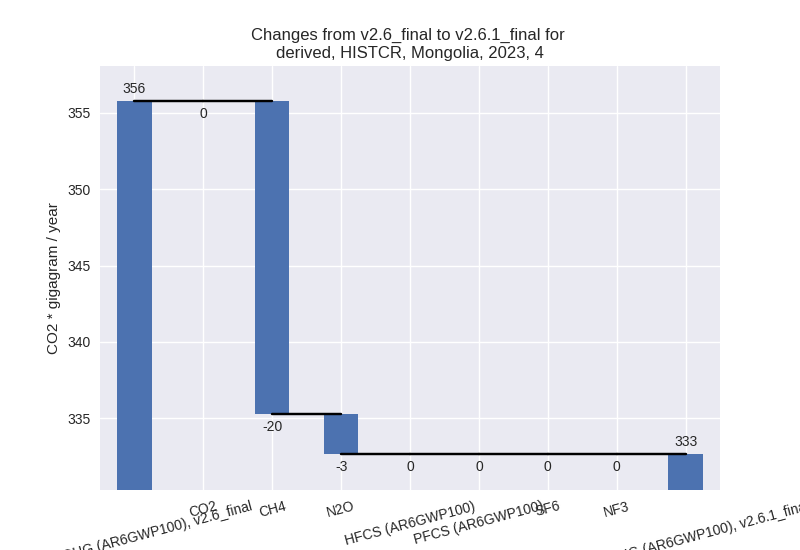
- 4: Total sectoral emissions in 2022 are 324.51 Gg
CO2 / year which is 0.6% of M.0.EL emissions. 2023 Emissions have
changed by -6.5% (-23.11 Gg CO2 /
year). 1990-2023 Emissions have changed by -0.9% (-1.37 Gg CO2 / year). For 2023 the
changes per gas
are:
- 5: Total sectoral emissions in 2022 are 142.38 Gg
CO2 / year which is 0.3% of M.0.EL emissions. 2023 Emissions have
changed by 103.8% (99.34 Gg CO2 /
year). 1990-2023 Emissions have changed by 38.8% (34.22 Gg CO2 / year). For 2023 the
changes per gas
are:
For 1990-2023 the changes per gas are: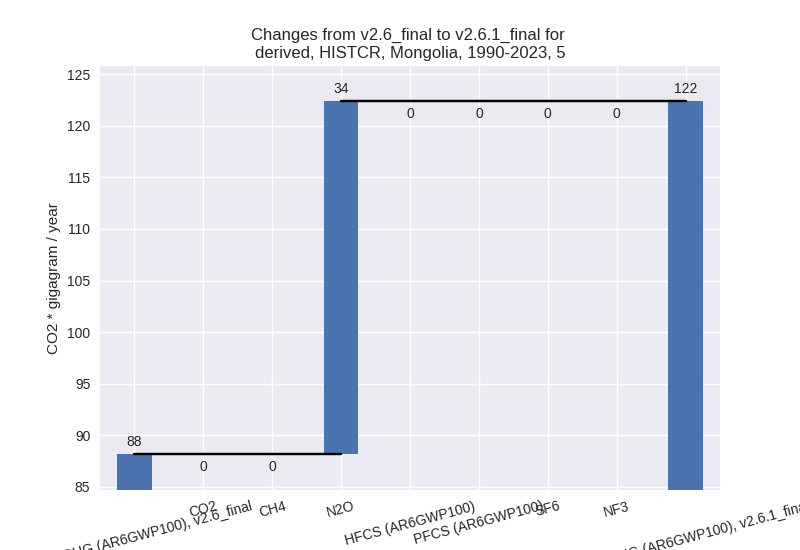
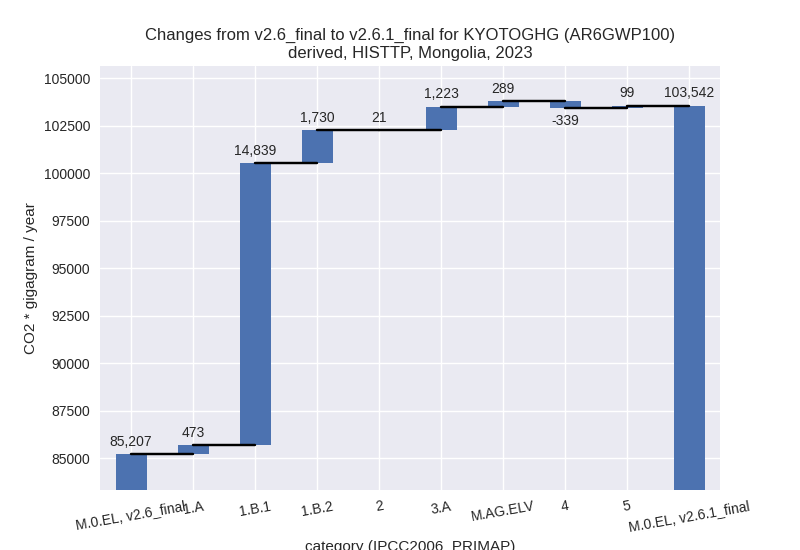
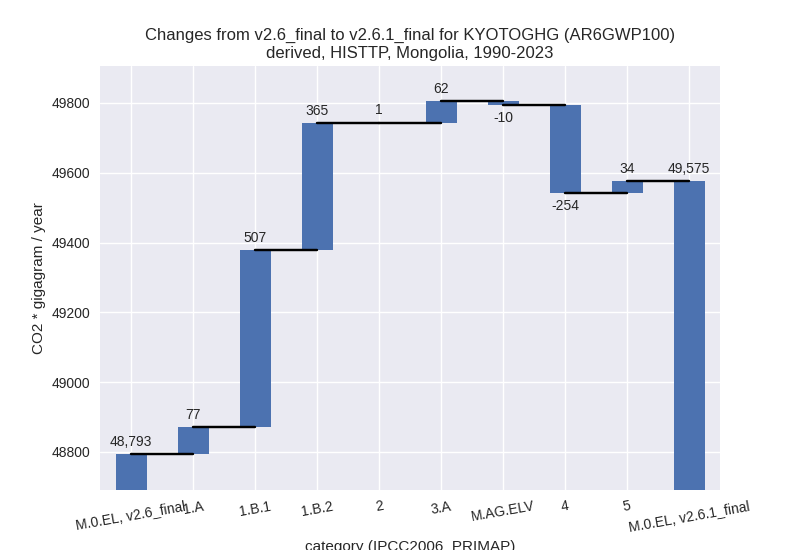
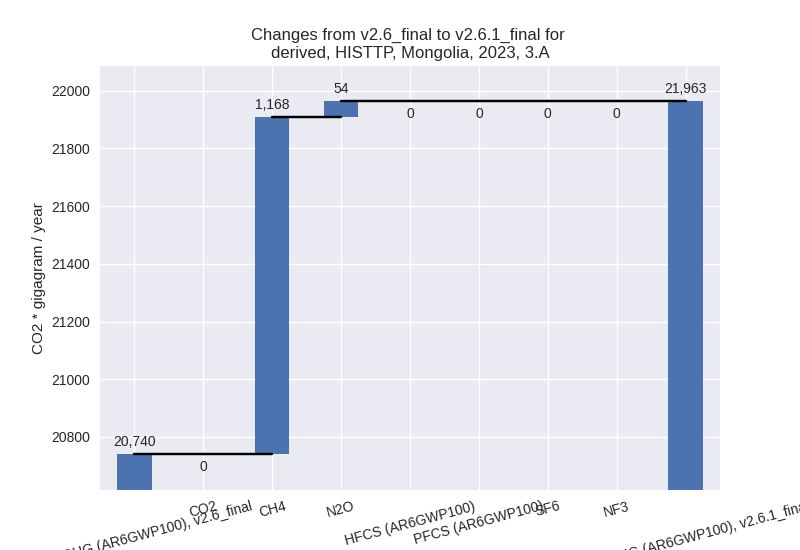
third party scenario (HISTTP):
Most important changes per time frame
For 2023 the following sector-gas combinations have the highest absolute impact on national total KyotoGHG (AR6GWP100) emissions in 2023 (top 5):
- 1: 1.B.1, CH4 with 14477.48 Gg CO2 / year (146.2%)
- 2: 1.B.2, CO2 with 1725.53 Gg CO2 / year (inf%)
- 3: 3.A, CH4 with 1168.04 Gg CO2 / year (5.9%)
- 4: 1.A, N2O with 642.43 Gg CO2 / year (321.4%)
- 5: 1.B.1, CO2 with 362.10 Gg CO2 / year (169.5%)
For 1990-2023 the following sector-gas combinations have the highest absolute impact on national total KyotoGHG (AR6GWP100) emissions in 1990-2023 (top 5):
- 1: 1.B.1, CH4 with 493.50 Gg CO2 / year (8.4%)
- 2: 1.B.2, CO2 with 381.72 Gg CO2 / year (7612.4%)
- 3: 4, CH4 with -252.90 Gg CO2 / year (-42.2%)
- 4: 1.A, N2O with 190.37 Gg CO2 / year (177.1%)
- 5: 1.A, CH4 with -113.75 Gg CO2 / year (-38.1%)
Changes in the main sectors for aggregate KyotoGHG (AR6GWP100) are
- 1: Total sectoral emissions in 2022 are 50860.59 Gg
CO2 / year which is 58.4% of M.0.EL emissions. 2023 Emissions have
changed by 34.6% (17041.98 Gg CO2 /
year). 1990-2023 Emissions have changed by 3.7% (948.67 Gg CO2 / year). For 2023 the
changes per gas
are:
For 1990-2023 the changes per gas are: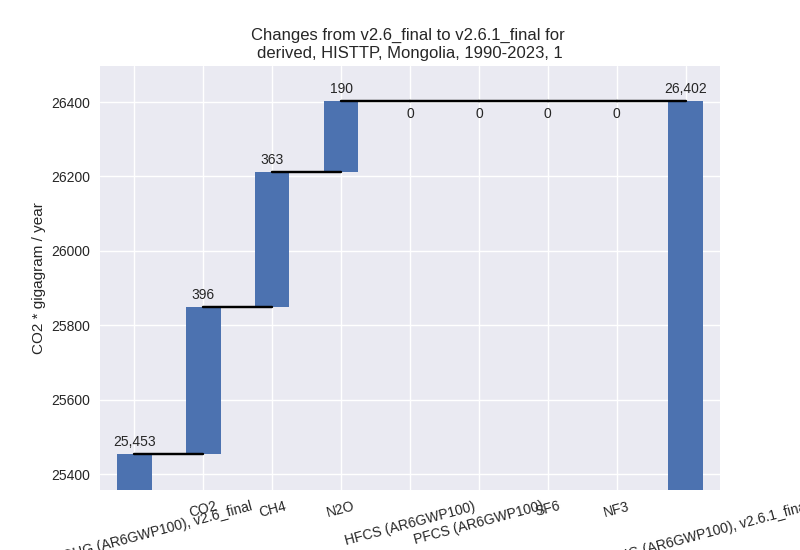
The changes come from the following subsectors:- 1.A: Total sectoral emissions in 2022 are 37418.29 Gg CO2 / year which is 73.6% of category 1 emissions. 2023 Emissions have changed by 1.2% (473.06 Gg CO2 / year). 1990-2023 Emissions have changed by 0.4% (76.62 Gg CO2 / year).
- 1.B.1: Total sectoral emissions in 2022 are
11841.46 Gg CO2 / year which is 23.3% of category 1 emissions. 2023
Emissions have changed by 146.6%
(14839.10 Gg CO2 / year). 1990-2023 Emissions have changed by 8.4% (507.37 Gg CO2 / year). For 2023 the
changes per gas
are:
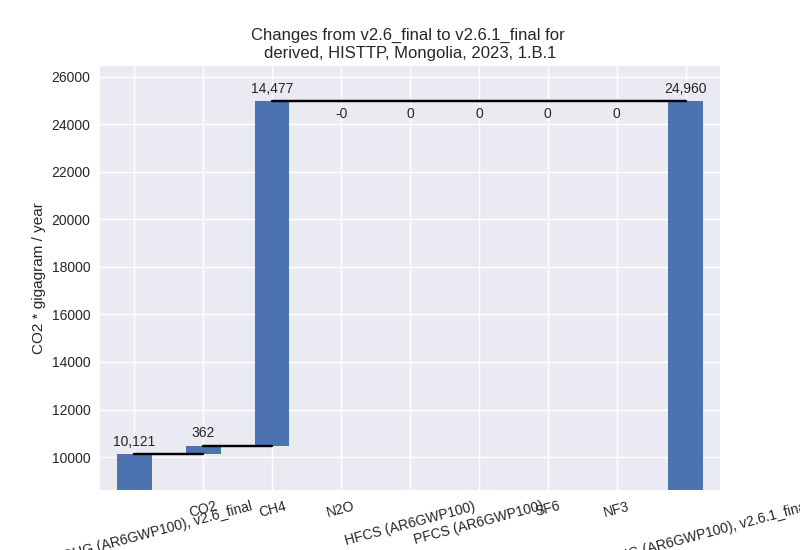
For 1990-2023 the changes per gas are:
There is no subsector information available in PRIMAP-hist. - 1.B.2: Total sectoral emissions in 2022 are 1600.84
Gg CO2 / year which is 3.1% of category 1 emissions. 2023 Emissions have
changed by 4026.4% (1729.82 Gg CO2 /
year). 1990-2023 Emissions have changed by 655.6% (364.69 Gg CO2 / year). For 2023
the changes per gas
are:
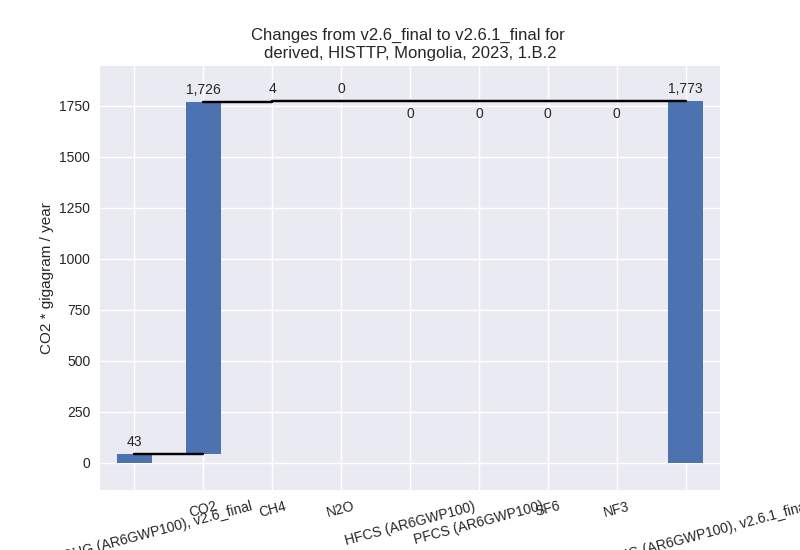
For 1990-2023 the changes per gas are: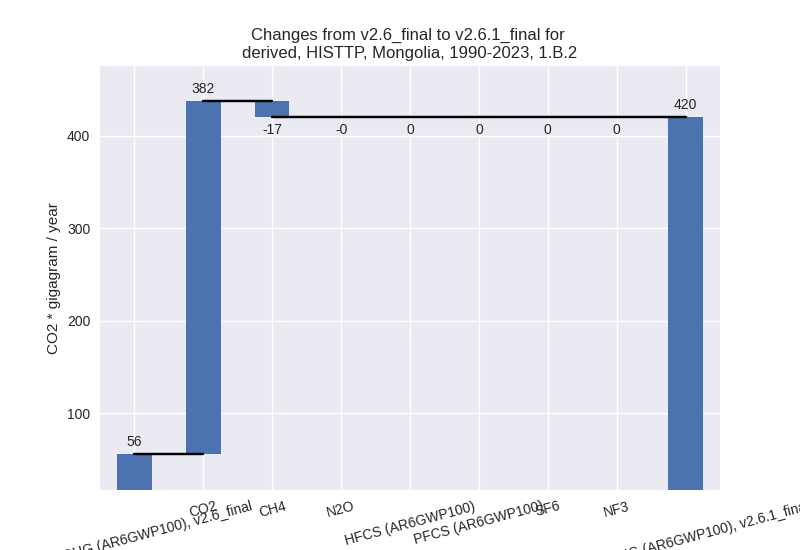
There is no subsector information available in PRIMAP-hist.
- 2: Total sectoral emissions in 2022 are 1691.71 Gg CO2 / year which is 1.9% of M.0.EL emissions. 2023 Emissions have changed by 1.1% (20.51 Gg CO2 / year). 1990-2023 Emissions have changed by 0.2% (0.76 Gg CO2 / year).
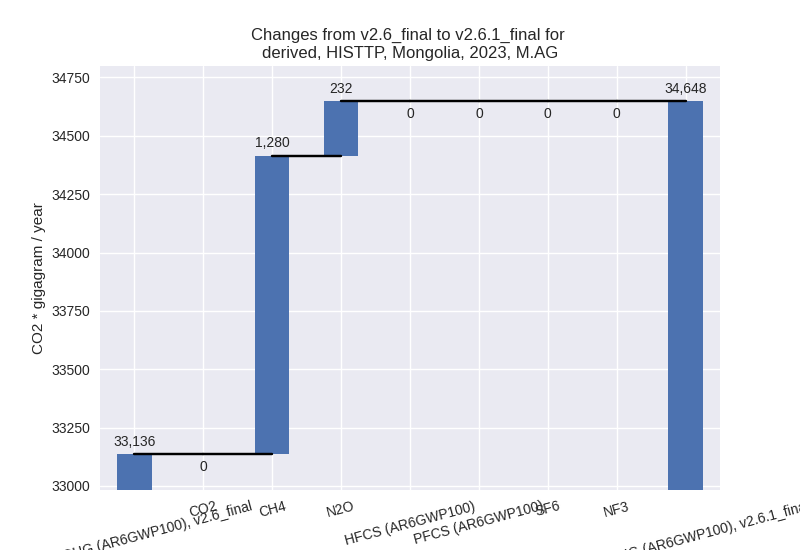
- M.AG: Total sectoral emissions in 2022 are 33813.36
Gg CO2 / year which is 38.8% of M.0.EL emissions. 2023 Emissions have
changed by 4.6% (1511.86 Gg CO2 /
year). 1990-2023 Emissions have changed by 0.2% (51.68 Gg CO2 / year). For 2023 the
changes per gas
are:
The changes come from the following subsectors:- 3.A: Total sectoral emissions in 2022 are 21397.47
Gg CO2 / year which is 63.3% of category M.AG emissions. 2023 Emissions
have changed by 5.9% (1222.53 Gg CO2
/ year). 1990-2023 Emissions have changed by 0.5% (61.97 Gg CO2 / year). For 2023 the
changes per gas
are:
There is no subsector information available in PRIMAP-hist. - M.AG.ELV: Total sectoral emissions in 2022 are
12415.89 Gg CO2 / year which is 36.7% of category M.AG emissions. 2023
Emissions have changed by 2.3%
(289.33 Gg CO2 / year). 1990-2023 Emissions have changed by -0.1% (-10.28 Gg CO2 / year). For 2023 the
changes per gas
are:
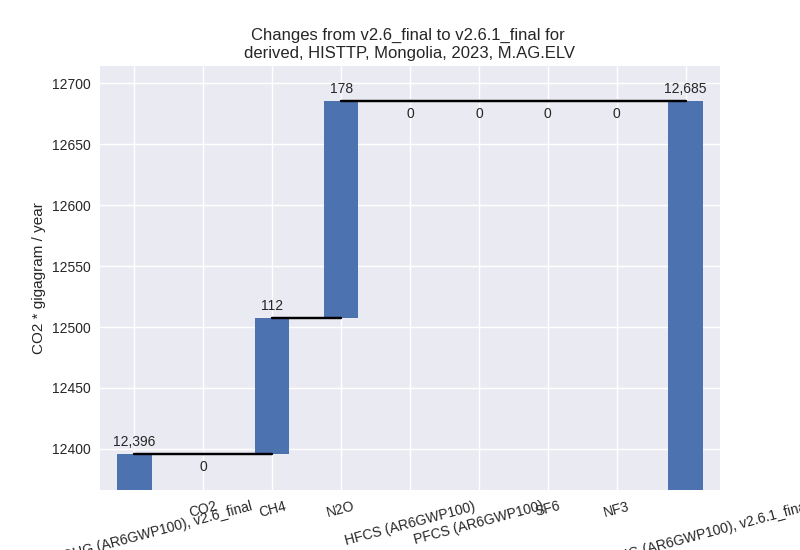
There is no subsector information available in PRIMAP-hist.
- 3.A: Total sectoral emissions in 2022 are 21397.47
Gg CO2 / year which is 63.3% of category M.AG emissions. 2023 Emissions
have changed by 5.9% (1222.53 Gg CO2
/ year). 1990-2023 Emissions have changed by 0.5% (61.97 Gg CO2 / year). For 2023 the
changes per gas
are:
- 4: Total sectoral emissions in 2022 are 570.52 Gg
CO2 / year which is 0.7% of M.0.EL emissions. 2023 Emissions have
changed by -36.7% (-339.19 Gg CO2 /
year). 1990-2023 Emissions have changed by -39.8% (-253.71 Gg CO2 / year). For 2023
the changes per gas
are:
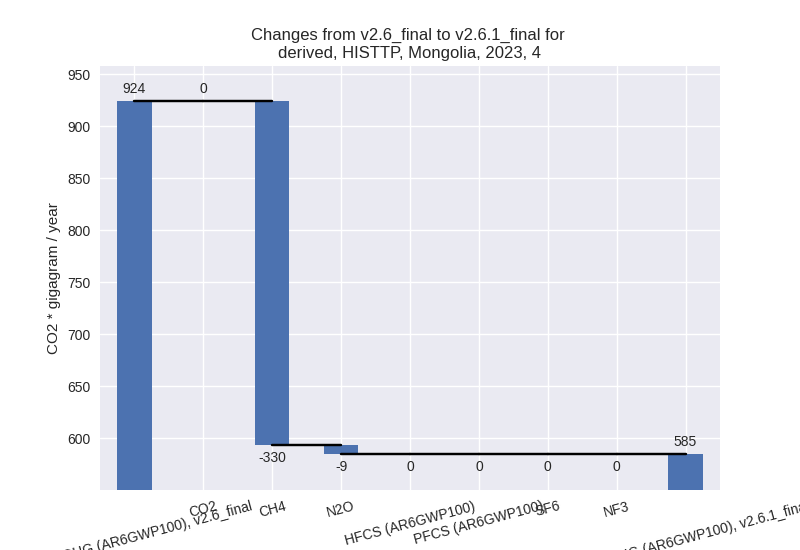
For 1990-2023 the changes per gas are: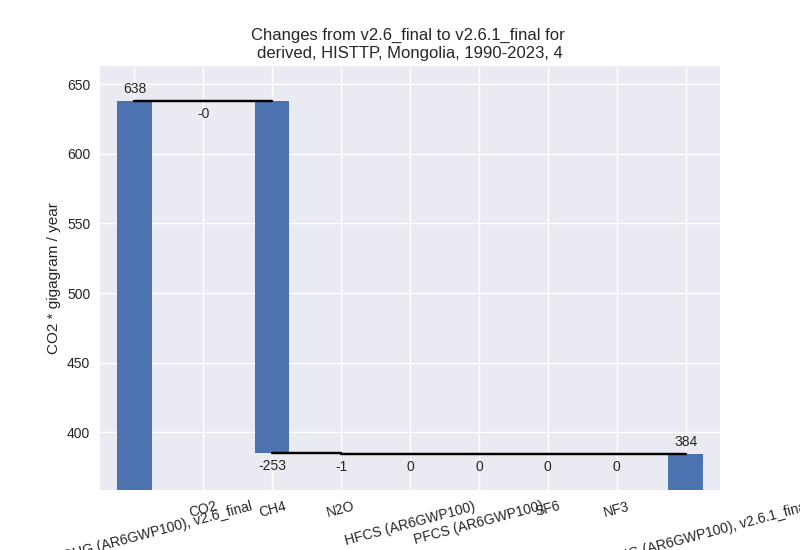
- 5: Total sectoral emissions in 2022 are 142.38 Gg
CO2 / year which is 0.2% of M.0.EL emissions. 2023 Emissions have
changed by 103.8% (99.34 Gg CO2 /
year). 1990-2023 Emissions have changed by 38.8% (34.22 Gg CO2 / year). For 2023 the
changes per gas
are:

For 1990-2023 the changes per gas are: