Changes in PRIMAP-hist v2.6.1_final compared to v2.6_final for Mozambique
2025-03-19
Johannes Gütschow
Change analysis for Mozambique for PRIMAP-hist v2.6.1_final compared to v2.6_final
Overview over emissions by sector and gas
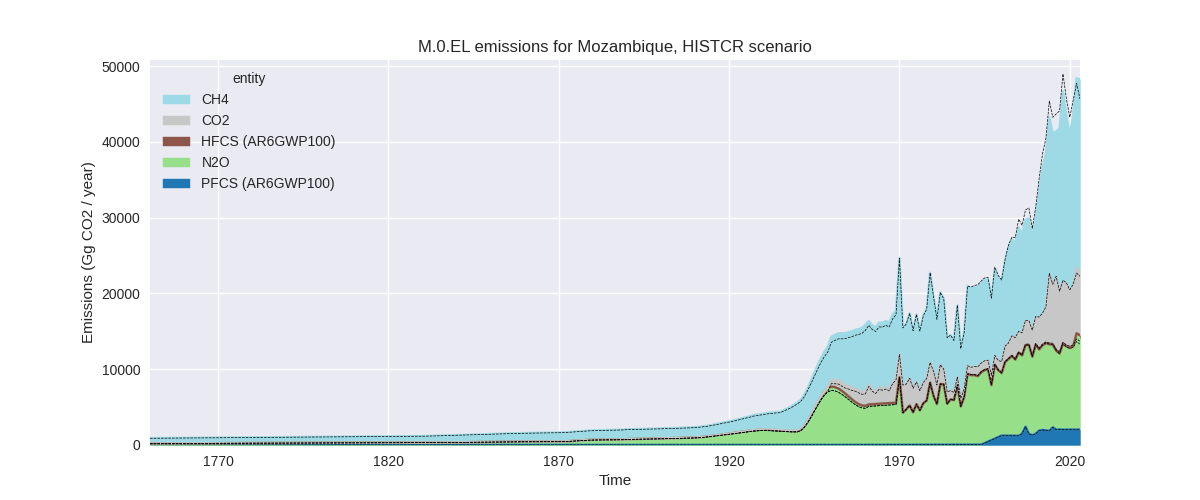
The following figures show the aggregate national total emissions excluding LULUCF AR6GWP100 for the country reported priority scenario. The dotted linesshow the v2.6_final data.
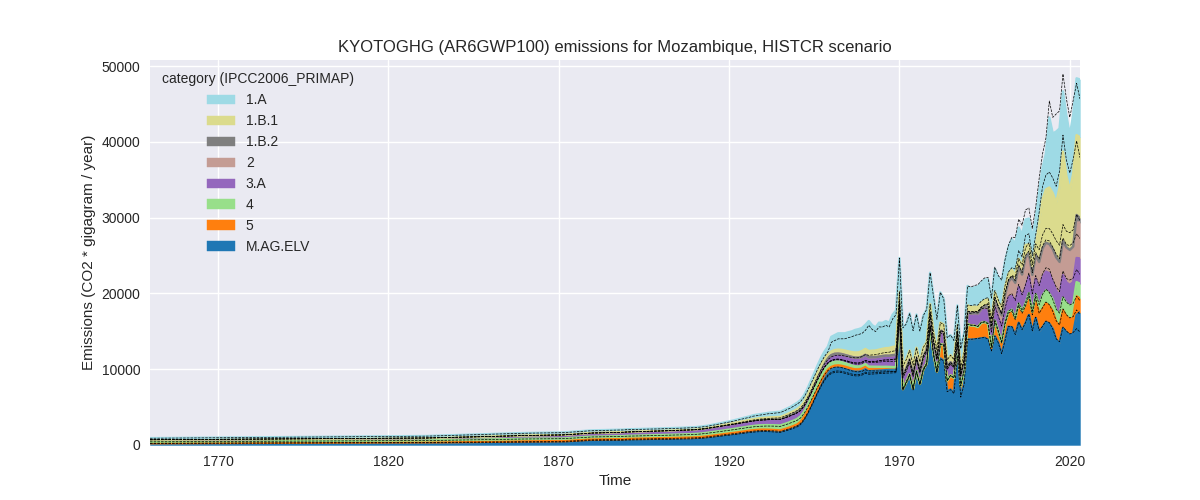
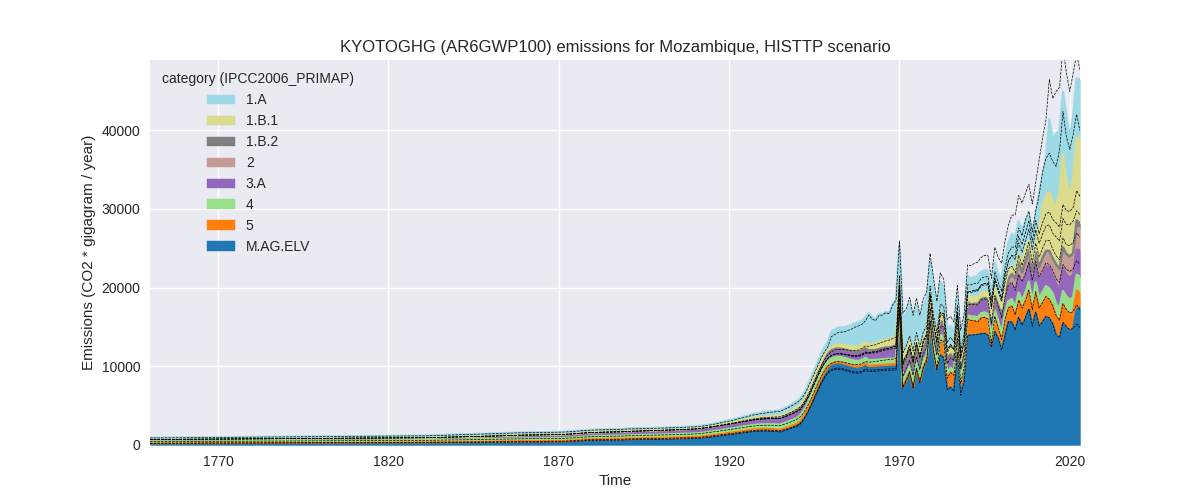
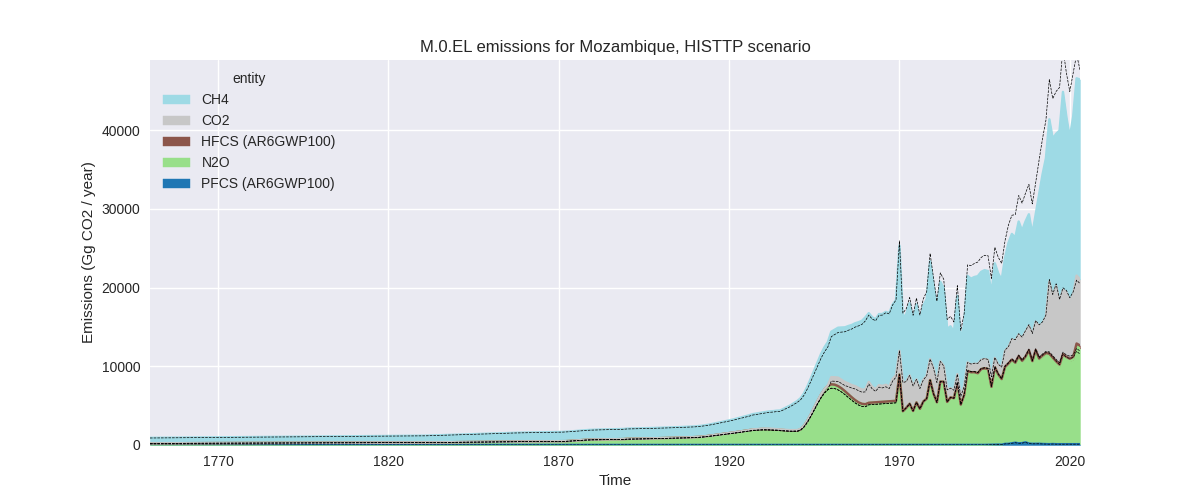
The following figures show the aggregate national total emissions excluding LULUCF AR6GWP100 for the third party priority scenario. The dotted linesshow the v2.6_final data.
Overview over changes
In the country reported priority scenario we have the following changes for aggregate Kyoto GHG and national total emissions excluding LULUCF (M.0.EL):
- Emissions in 2023 have changed by 5.6%% (2566.85 Gg CO2 / year)
- Emissions in 1990-2023 have changed by -2.9%% (-942.04 Gg CO2 / year)
In the third party priority scenario we have the following changes for aggregate Kyoto GHG and national total emissions excluding LULUCF (M.0.EL):
- Emissions in 2023 have changed by -2.6%% (-1230.55 Gg CO2 / year)
- Emissions in 1990-2023 have changed by -10.0%% (-3354.76 Gg CO2 / year)
Most important changes per scenario and time frame
In the country reported priority scenario the following sector-gas combinations have the highest absolute impact on national total KyotoGHG (AR6GWP100) emissions in 2023 (top 5):
- 1: 1.B.1, CH4 with 2274.55 Gg CO2 / year (27.8%)
- 2: 1.B.2, CH4 with -1530.28 Gg CO2 / year (-92.4%)
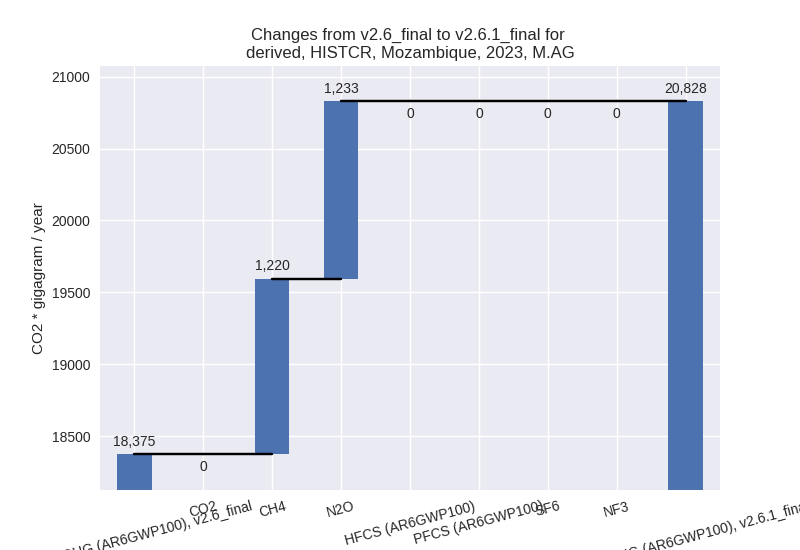
- 3: M.AG.ELV, CH4 with 1459.41 Gg CO2 / year (21.4%)
- 4: M.AG.ELV, N2O with 1134.46 Gg CO2 / year (14.0%)
- 5: 5, N2O with -449.47 Gg CO2 / year (-19.8%)
In the country reported priority scenario the following sector-gas combinations have the highest absolute impact on national total KyotoGHG (AR6GWP100) emissions in 1990-2023 (top 5):
- 1: 1.B.2, CH4 with -755.23 Gg CO2 / year (-91.6%)
- 2: 3.A, CH4 with -264.49 Gg CO2 / year (-12.0%)
- 3: 1.B.1, CH4 with 98.78 Gg CO2 / year (2.7%)
- 4: M.AG.ELV, CH4 with 85.47 Gg CO2 / year (1.2%)
- 5: M.AG.ELV, N2O with -48.92 Gg CO2 / year (-0.6%)
In the third party priority scenario the following sector-gas combinations have the highest absolute impact on national total KyotoGHG (AR6GWP100) emissions in 2023 (top 5):
- 1: 4, CH4 with -3614.58 Gg CO2 / year (-66.7%)
- 2: 1.B.1, CH4 with 2274.55 Gg CO2 / year (27.8%)
- 3: 1.B.2, CH4 with -1530.28 Gg CO2 / year (-92.4%)
- 4: M.AG.ELV, CH4 with 1459.41 Gg CO2 / year (21.4%)
- 5: M.AG.ELV, N2O with 1134.46 Gg CO2 / year (14.0%)
In the third party priority scenario the following sector-gas combinations have the highest absolute impact on national total KyotoGHG (AR6GWP100) emissions in 1990-2023 (top 5):
- 1: 4, CH4 with -2373.25 Gg CO2 / year (-70.0%)
- 2: 1.B.2, CH4 with -755.23 Gg CO2 / year (-91.6%)
- 3: 3.A, CH4 with -264.49 Gg CO2 / year (-12.0%)
- 4: 1.B.1, CH4 with 98.78 Gg CO2 / year (2.7%)
- 5: M.AG.ELV, CH4 with 85.47 Gg CO2 / year (1.2%)
Notes on data changes
Here we list notes explaining important emissions changes for the country.
- No new country reported data has been included. The sectors with the highest have no country reported data and changes in third party affect the full time-series (1.B.1, 1.B.2, 5: EDGAR; M.AG.ELV, 3.A: FAO).
- For the TP time-series we additionally have a high change in waste CH4 emissions.
Changes by sector and gas
For each scenario and time frame the changes are displayed for all individual sectors and all individual gases. In the sector plot we use aggregate Kyoto GHGs in AR6GWP100. In the gas plot we usenational total emissions without LULUCF.
country reported scenario
2023
1990-2023
third party scenario
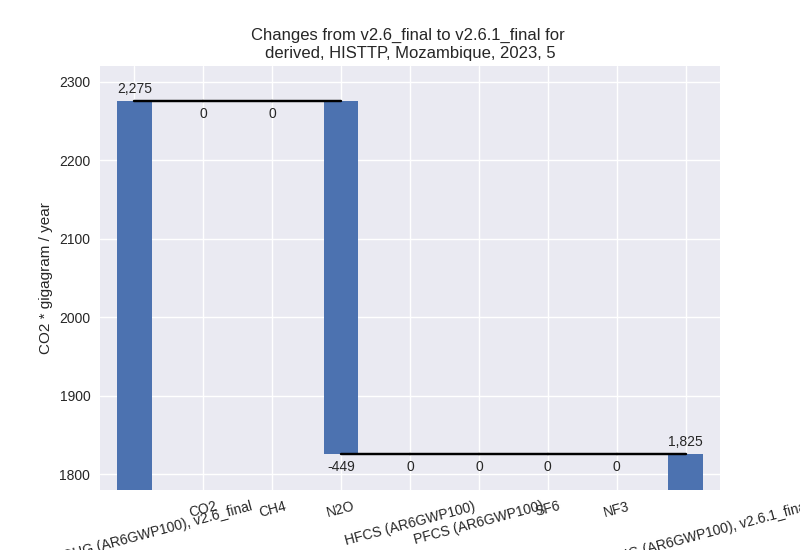
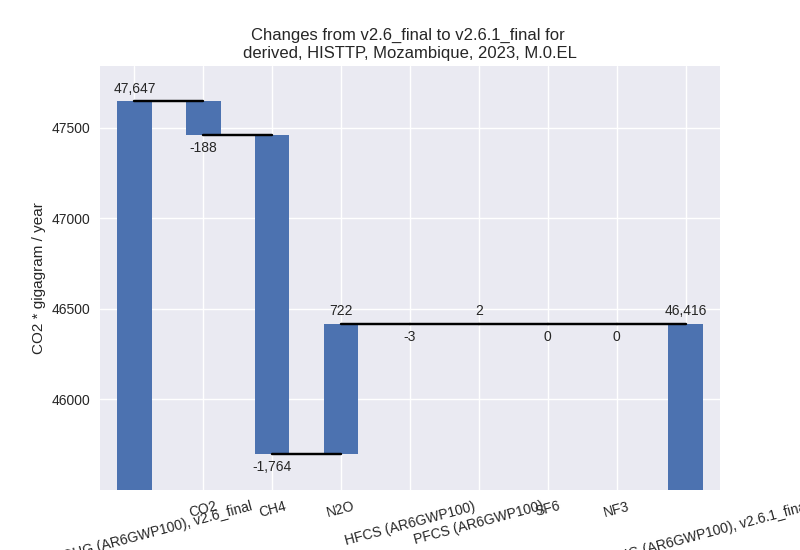
2023
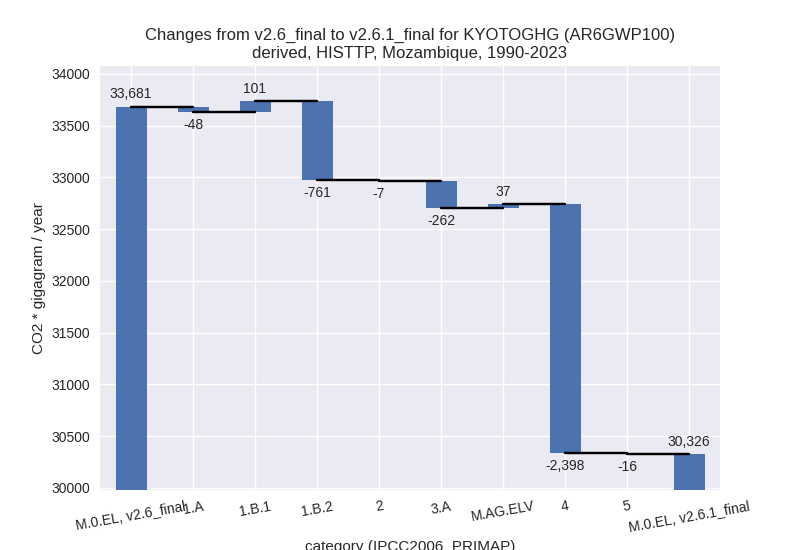
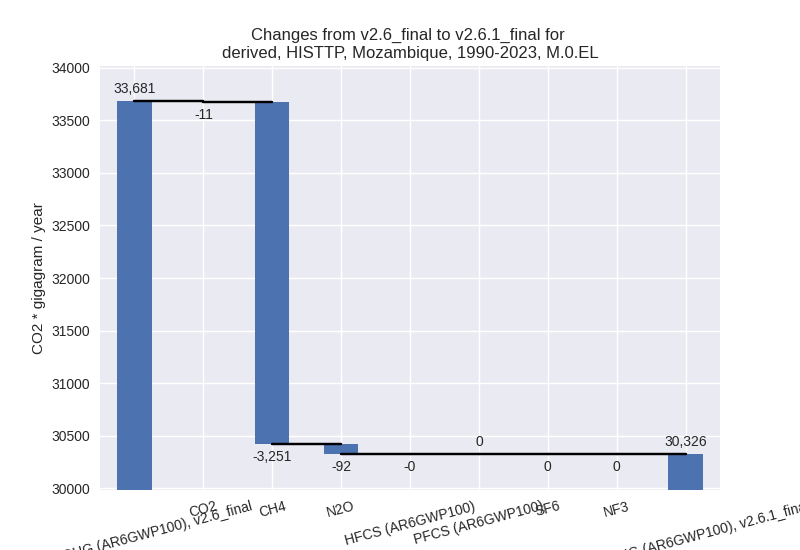
1990-2023
Detailed changes for the scenarios:
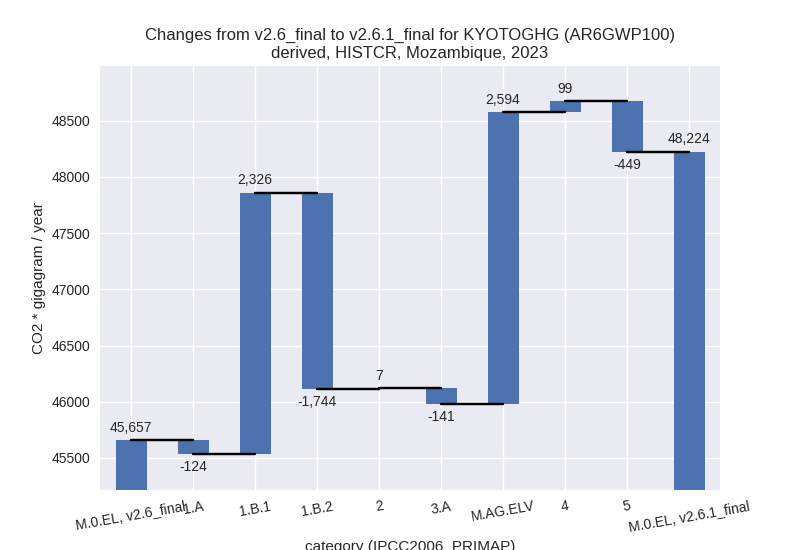
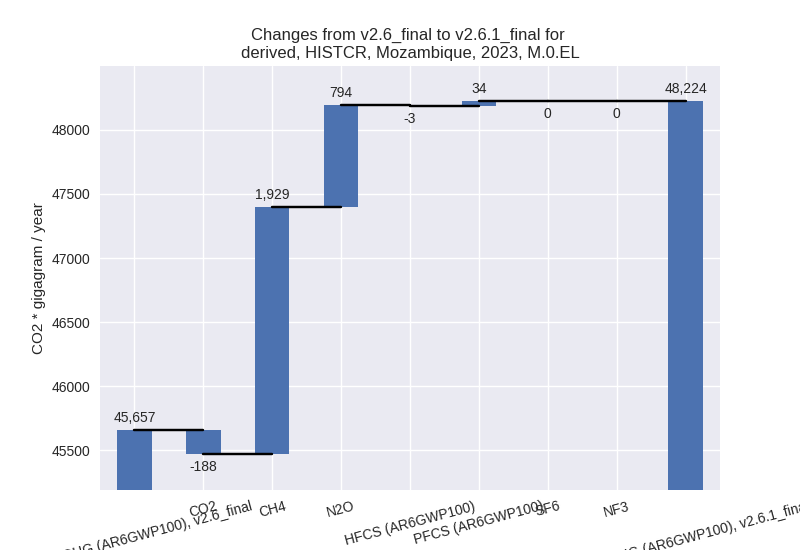
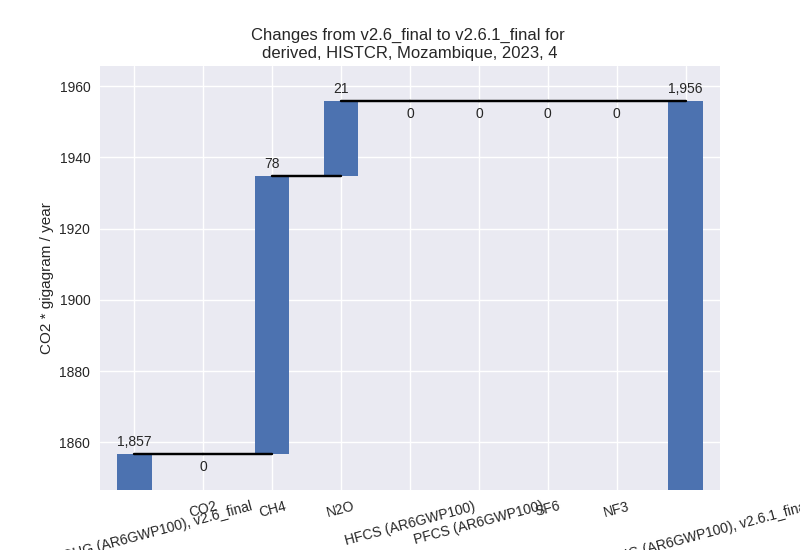
country reported scenario (HISTCR):
Most important changes per time frame
For 2023 the following sector-gas combinations have the highest absolute impact on national total KyotoGHG (AR6GWP100) emissions in 2023 (top 5):
- 1: 1.B.1, CH4 with 2274.55 Gg CO2 / year (27.8%)
- 2: 1.B.2, CH4 with -1530.28 Gg CO2 / year (-92.4%)
- 3: M.AG.ELV, CH4 with 1459.41 Gg CO2 / year (21.4%)
- 4: M.AG.ELV, N2O with 1134.46 Gg CO2 / year (14.0%)
- 5: 5, N2O with -449.47 Gg CO2 / year (-19.8%)
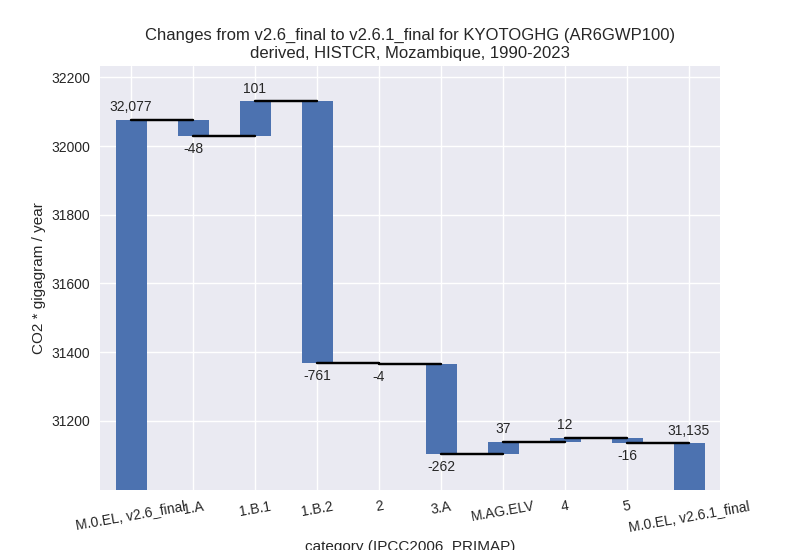
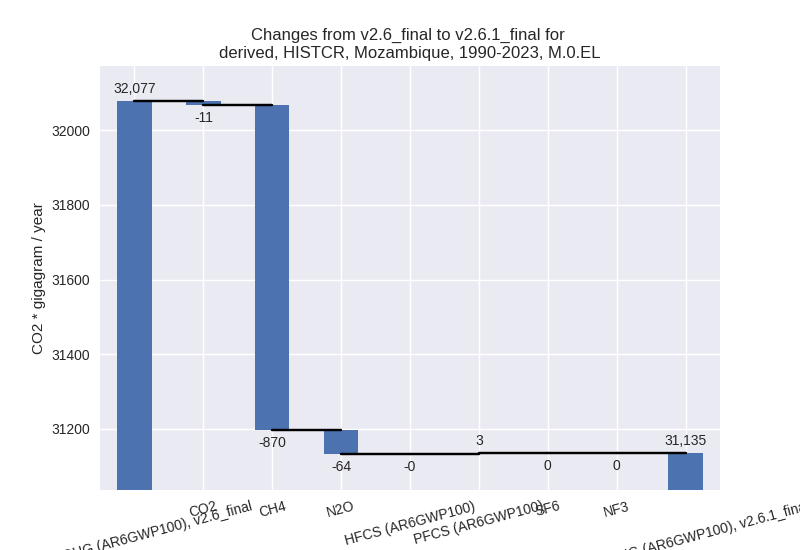
For 1990-2023 the following sector-gas combinations have the highest absolute impact on national total KyotoGHG (AR6GWP100) emissions in 1990-2023 (top 5):
- 1: 1.B.2, CH4 with -755.23 Gg CO2 / year (-91.6%)
- 2: 3.A, CH4 with -264.49 Gg CO2 / year (-12.0%)
- 3: 1.B.1, CH4 with 98.78 Gg CO2 / year (2.7%)
- 4: M.AG.ELV, CH4 with 85.47 Gg CO2 / year (1.2%)
- 5: M.AG.ELV, N2O with -48.92 Gg CO2 / year (-0.6%)
Changes in the main sectors for aggregate KyotoGHG (AR6GWP100) are
- 1: Total sectoral emissions in 2022 are 19025.30 Gg
CO2 / year which is 39.3% of M.0.EL emissions. 2023 Emissions have
changed by 2.5% (457.85 Gg CO2 /
year). 1990-2023 Emissions have changed by -7.5% (-708.25 Gg CO2 / year). For 2023
the changes per gas
are:

For 1990-2023 the changes per gas are: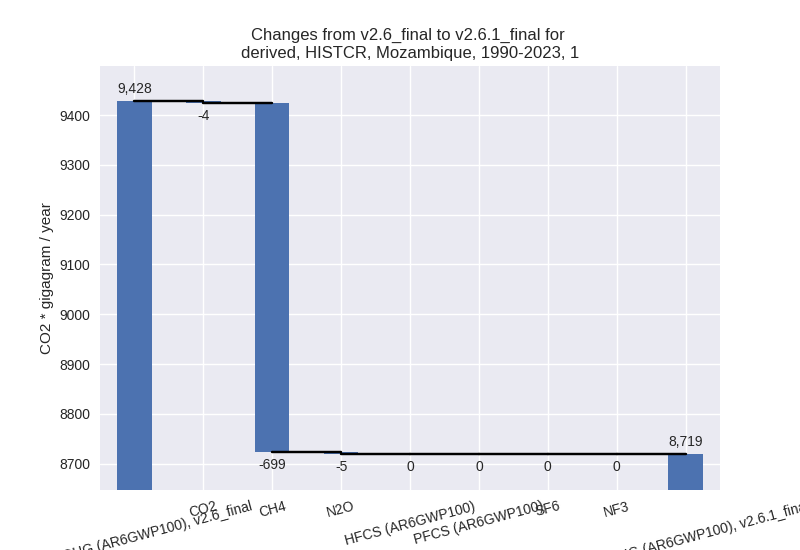
The changes come from the following subsectors:- 1.A: Total sectoral emissions in 2022 are 7499.08 Gg CO2 / year which is 39.4% of category 1 emissions. 2023 Emissions have changed by -1.6% (-123.59 Gg CO2 / year). 1990-2023 Emissions have changed by -1.0% (-47.77 Gg CO2 / year).
- 1.B.1: Total sectoral emissions in 2022 are
10530.50 Gg CO2 / year which is 55.3% of category 1 emissions. 2023
Emissions have changed by 28.0%
(2325.84 Gg CO2 / year). 1990-2023 Emissions have changed by 2.7% (100.99 Gg CO2 / year). For 2023 the
changes per gas
are:
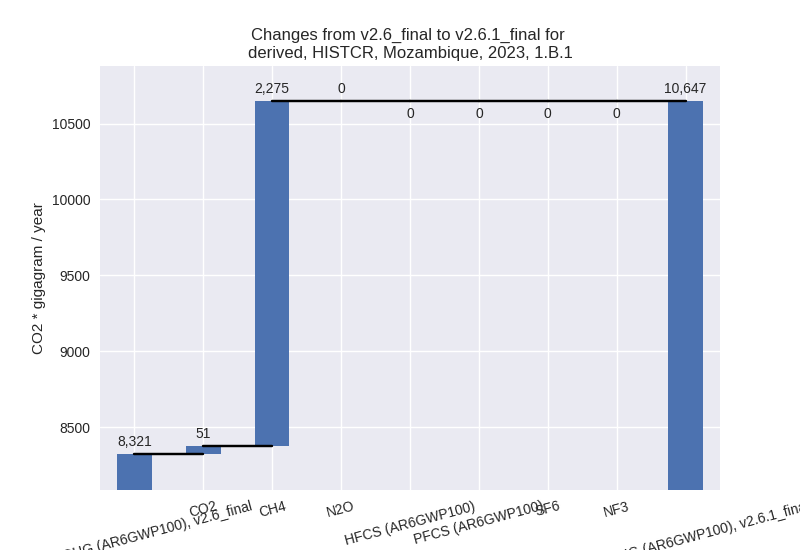
For 1990-2023 the changes per gas are:
There is no subsector information available in PRIMAP-hist. - 1.B.2: Total sectoral emissions in 2022 are 995.72
Gg CO2 / year which is 5.2% of category 1 emissions. 2023 Emissions have
changed by -74.4% (-1744.40 Gg CO2 /
year). 1990-2023 Emissions have changed by -87.0% (-761.47 Gg CO2 / year). For 2023
the changes per gas
are:
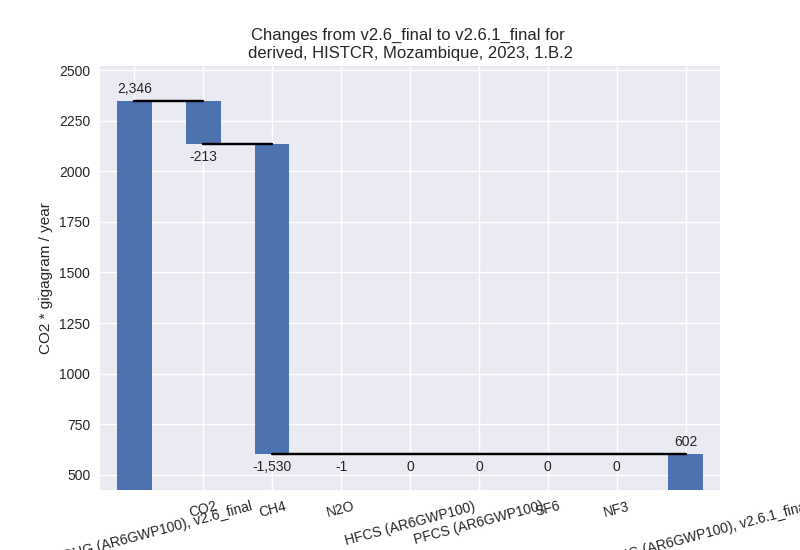
For 1990-2023 the changes per gas are:
There is no subsector information available in PRIMAP-hist.
- 2: Total sectoral emissions in 2022 are 4677.47 Gg CO2 / year which is 9.7% of M.0.EL emissions. 2023 Emissions have changed by 0.1% (6.50 Gg CO2 / year). 1990-2023 Emissions have changed by -0.2% (-4.42 Gg CO2 / year).
- M.AG: Total sectoral emissions in 2022 are 20316.27
Gg CO2 / year which is 42.0% of M.0.EL emissions. 2023 Emissions have
changed by 13.3% (2452.94 Gg CO2 /
year). 1990-2023 Emissions have changed by -1.3% (-225.14 Gg CO2 / year). For 2023
the changes per gas
are:
The changes come from the following subsectors:- 3.A: Total sectoral emissions in 2022 are 3187.00
Gg CO2 / year which is 15.7% of category M.AG emissions. 2023 Emissions
have changed by -4.1% (-140.93 Gg
CO2 / year). 1990-2023 Emissions have changed by -10.9% (-261.69 Gg CO2 / year). For 2023
the changes per gas
are:

For 1990-2023 the changes per gas are:
There is no subsector information available in PRIMAP-hist. - M.AG.ELV: Total sectoral emissions in 2022 are
17129.28 Gg CO2 / year which is 84.3% of category M.AG emissions. 2023
Emissions have changed by 17.4%
(2593.87 Gg CO2 / year). 1990-2023 Emissions have changed by 0.2% (36.55 Gg CO2 / year). For 2023 the
changes per gas
are:
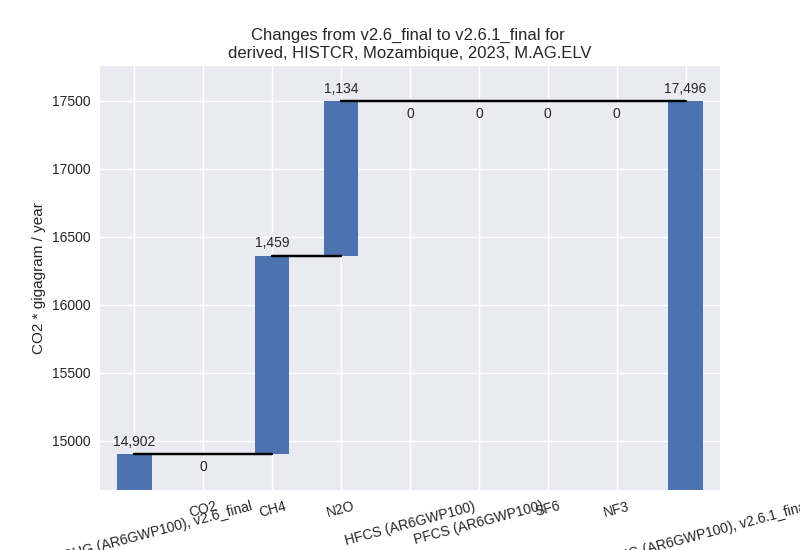
There is no subsector information available in PRIMAP-hist.
- 3.A: Total sectoral emissions in 2022 are 3187.00
Gg CO2 / year which is 15.7% of category M.AG emissions. 2023 Emissions
have changed by -4.1% (-140.93 Gg
CO2 / year). 1990-2023 Emissions have changed by -10.9% (-261.69 Gg CO2 / year). For 2023
the changes per gas
are:
- 4: Total sectoral emissions in 2022 are 1889.87 Gg
CO2 / year which is 3.9% of M.0.EL emissions. 2023 Emissions have
changed by 5.3% (99.02 Gg CO2 /
year). 1990-2023 Emissions have changed by 1.5% (11.61 Gg CO2 / year). For 2023 the
changes per gas
are:
- 5: Total sectoral emissions in 2022 are 2468.84 Gg
CO2 / year which is 5.1% of M.0.EL emissions. 2023 Emissions have
changed by -19.8% (-449.47 Gg CO2 /
year). 1990-2023 Emissions have changed by -0.8% (-15.83 Gg CO2 / year). For 2023 the
changes per gas
are:

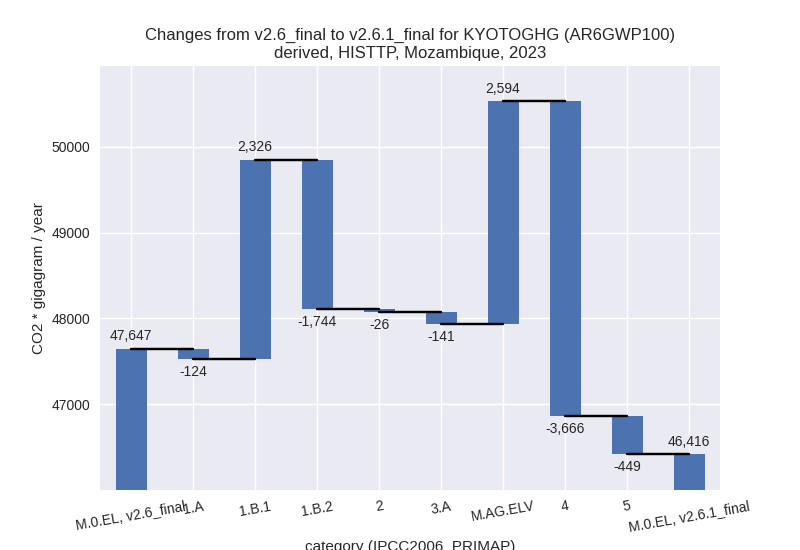
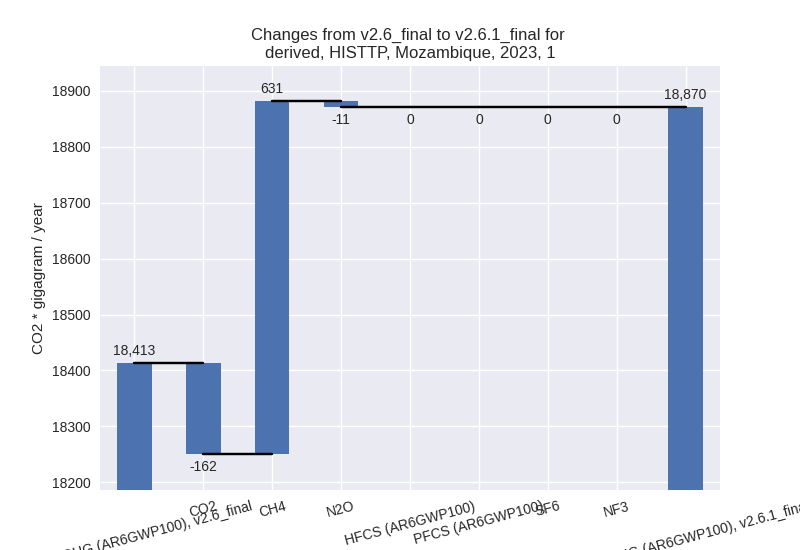
third party scenario (HISTTP):
Most important changes per time frame
For 2023 the following sector-gas combinations have the highest absolute impact on national total KyotoGHG (AR6GWP100) emissions in 2023 (top 5):
- 1: 4, CH4 with -3614.58 Gg CO2 / year (-66.7%)
- 2: 1.B.1, CH4 with 2274.55 Gg CO2 / year (27.8%)
- 3: 1.B.2, CH4 with -1530.28 Gg CO2 / year (-92.4%)
- 4: M.AG.ELV, CH4 with 1459.41 Gg CO2 / year (21.4%)
- 5: M.AG.ELV, N2O with 1134.46 Gg CO2 / year (14.0%)
For 1990-2023 the following sector-gas combinations have the highest absolute impact on national total KyotoGHG (AR6GWP100) emissions in 1990-2023 (top 5):
- 1: 4, CH4 with -2373.25 Gg CO2 / year (-70.0%)
- 2: 1.B.2, CH4 with -755.23 Gg CO2 / year (-91.6%)
- 3: 3.A, CH4 with -264.49 Gg CO2 / year (-12.0%)
- 4: 1.B.1, CH4 with 98.78 Gg CO2 / year (2.7%)
- 5: M.AG.ELV, CH4 with 85.47 Gg CO2 / year (1.2%)
Changes in the main sectors for aggregate KyotoGHG (AR6GWP100) are
- 1: Total sectoral emissions in 2022 are 19025.30 Gg
CO2 / year which is 40.9% of M.0.EL emissions. 2023 Emissions have
changed by 2.5% (457.85 Gg CO2 /
year). 1990-2023 Emissions have changed by -7.5% (-708.25 Gg CO2 / year). For 2023
the changes per gas
are:
For 1990-2023 the changes per gas are:
The changes come from the following subsectors:- 1.A: Total sectoral emissions in 2022 are 7499.08 Gg CO2 / year which is 39.4% of category 1 emissions. 2023 Emissions have changed by -1.6% (-123.59 Gg CO2 / year). 1990-2023 Emissions have changed by -1.0% (-47.77 Gg CO2 / year).
- 1.B.1: Total sectoral emissions in 2022 are
10530.50 Gg CO2 / year which is 55.3% of category 1 emissions. 2023
Emissions have changed by 28.0%
(2325.84 Gg CO2 / year). 1990-2023 Emissions have changed by 2.7% (100.99 Gg CO2 / year). For 2023 the
changes per gas
are:

For 1990-2023 the changes per gas are: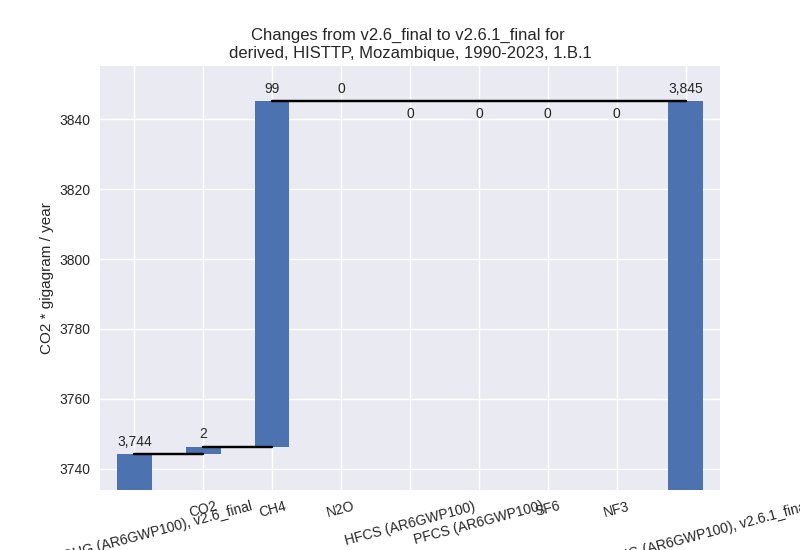
There is no subsector information available in PRIMAP-hist. - 1.B.2: Total sectoral emissions in 2022 are 995.72
Gg CO2 / year which is 5.2% of category 1 emissions. 2023 Emissions have
changed by -74.4% (-1744.40 Gg CO2 /
year). 1990-2023 Emissions have changed by -87.0% (-761.47 Gg CO2 / year). For 2023
the changes per gas
are:

For 1990-2023 the changes per gas are:
There is no subsector information available in PRIMAP-hist.
- 2: Total sectoral emissions in 2022 are 2744.89 Gg CO2 / year which is 5.9% of M.0.EL emissions. 2023 Emissions have changed by -0.9% (-26.10 Gg CO2 / year). 1990-2023 Emissions have changed by -0.5% (-7.07 Gg CO2 / year).
- M.AG: Total sectoral emissions in 2022 are 20316.27
Gg CO2 / year which is 43.6% of M.0.EL emissions. 2023 Emissions have
changed by 13.3% (2452.94 Gg CO2 /
year). 1990-2023 Emissions have changed by -1.3% (-225.14 Gg CO2 / year). For 2023
the changes per gas
are:

The changes come from the following subsectors:- 3.A: Total sectoral emissions in 2022 are 3187.00
Gg CO2 / year which is 15.7% of category M.AG emissions. 2023 Emissions
have changed by -4.1% (-140.93 Gg
CO2 / year). 1990-2023 Emissions have changed by -10.9% (-261.69 Gg CO2 / year). For 2023
the changes per gas
are:
For 1990-2023 the changes per gas are:
There is no subsector information available in PRIMAP-hist. - M.AG.ELV: Total sectoral emissions in 2022 are
17129.28 Gg CO2 / year which is 84.3% of category M.AG emissions. 2023
Emissions have changed by 17.4%
(2593.87 Gg CO2 / year). 1990-2023 Emissions have changed by 0.2% (36.55 Gg CO2 / year). For 2023 the
changes per gas
are:

There is no subsector information available in PRIMAP-hist.
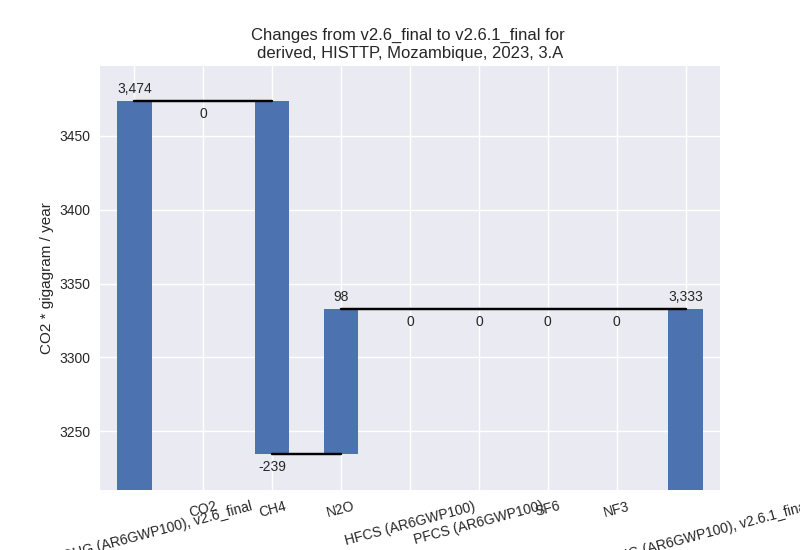
- 3.A: Total sectoral emissions in 2022 are 3187.00
Gg CO2 / year which is 15.7% of category M.AG emissions. 2023 Emissions
have changed by -4.1% (-140.93 Gg
CO2 / year). 1990-2023 Emissions have changed by -10.9% (-261.69 Gg CO2 / year). For 2023
the changes per gas
are:
- 4: Total sectoral emissions in 2022 are 2013.65 Gg
CO2 / year which is 4.3% of M.0.EL emissions. 2023 Emissions have
changed by -63.8% (-3665.77 Gg CO2 /
year). 1990-2023 Emissions have changed by -66.9% (-2398.46 Gg CO2 / year). For 2023
the changes per gas
are:

For 1990-2023 the changes per gas are:
- 5: Total sectoral emissions in 2022 are 2468.84 Gg
CO2 / year which is 5.3% of M.0.EL emissions. 2023 Emissions have
changed by -19.8% (-449.47 Gg CO2 /
year). 1990-2023 Emissions have changed by -0.8% (-15.83 Gg CO2 / year). For 2023 the
changes per gas
are: