Changes in PRIMAP-hist v2.6.1_final compared to v2.6_final for Mauritania
2025-03-19
Johannes Gütschow
Change analysis for Mauritania for PRIMAP-hist v2.6.1_final compared to v2.6_final
Overview over emissions by sector and gas
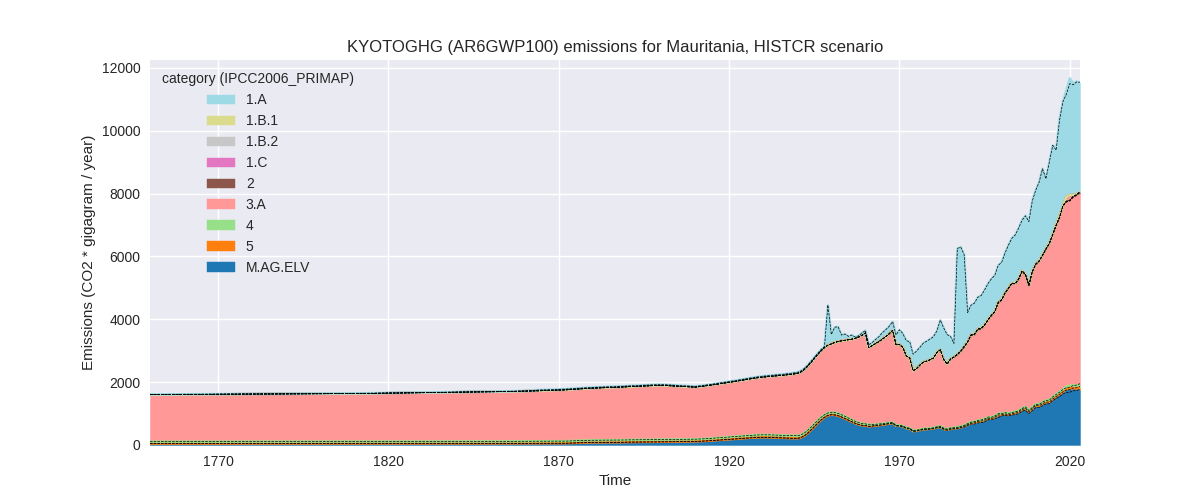
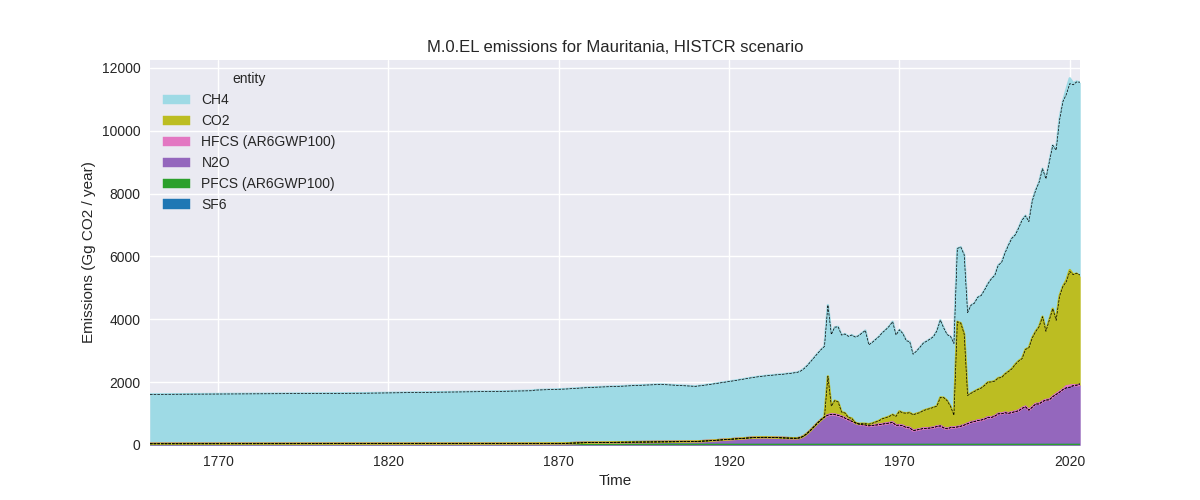
The following figures show the aggregate national total emissions excluding LULUCF AR6GWP100 for the country reported priority scenario. The dotted linesshow the v2.6_final data.
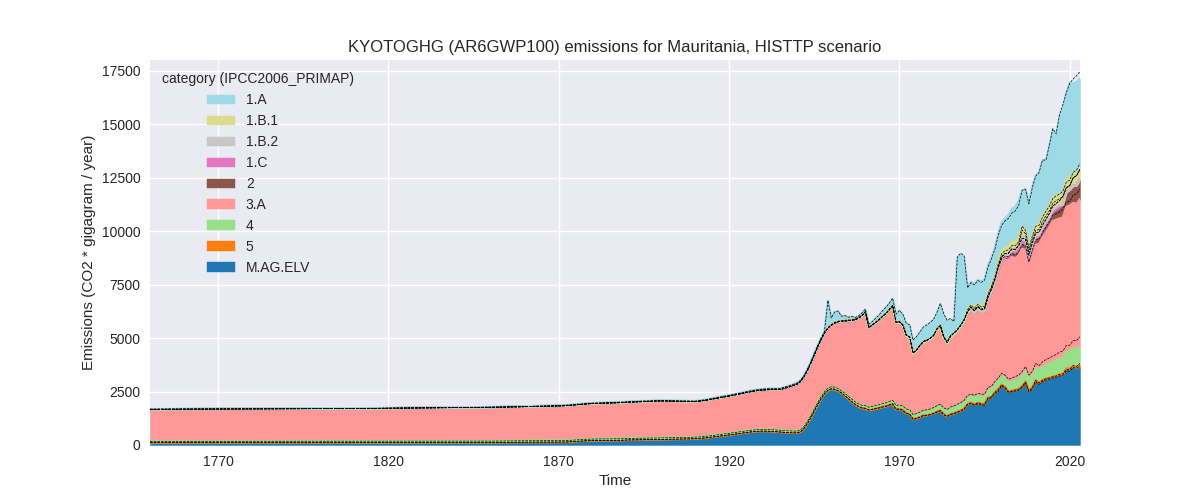
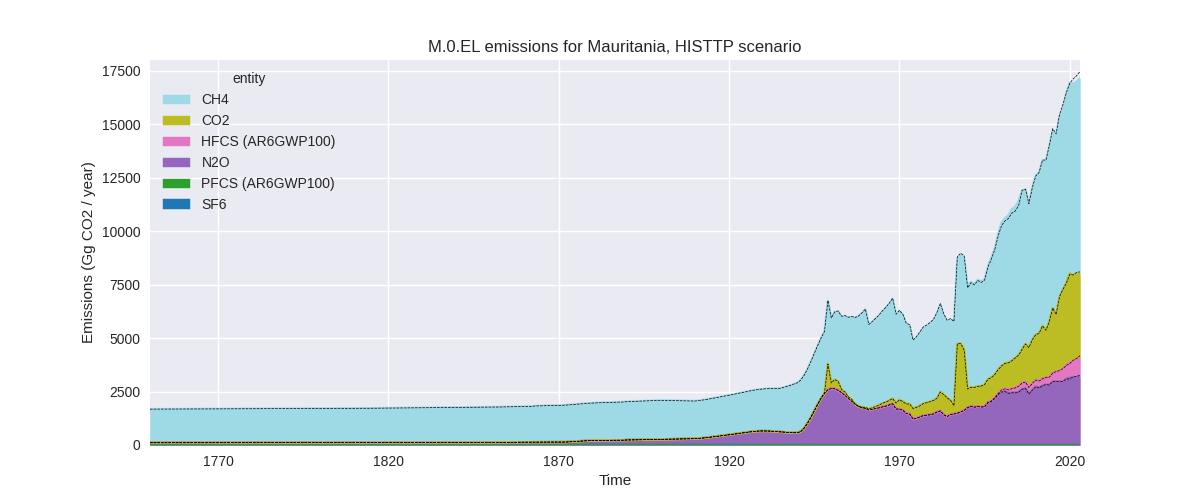
The following figures show the aggregate national total emissions excluding LULUCF AR6GWP100 for the third party priority scenario. The dotted linesshow the v2.6_final data.
Overview over changes
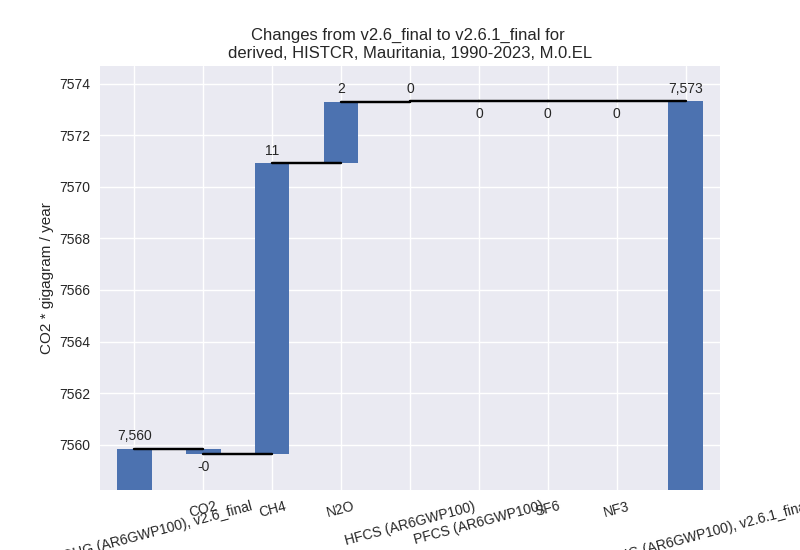
In the country reported priority scenario we have the following changes for aggregate Kyoto GHG and national total emissions excluding LULUCF (M.0.EL):
- Emissions in 2023 have changed by -0.1%% (-11.99 Gg CO2 / year)
- Emissions in 1990-2023 have changed by 0.2%% (13.48 Gg CO2 / year)
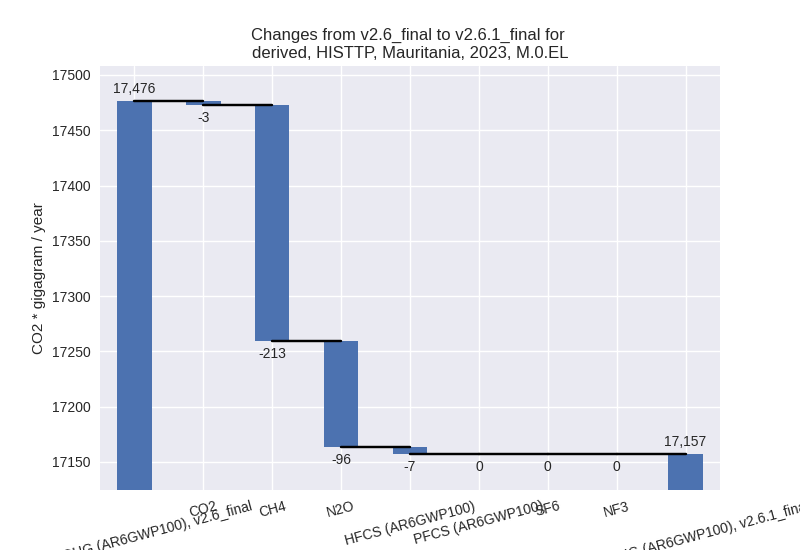
In the third party priority scenario we have the following changes for aggregate Kyoto GHG and national total emissions excluding LULUCF (M.0.EL):
- Emissions in 2023 have changed by -1.8%% (-319.37 Gg CO2 / year)
- Emissions in 1990-2023 have changed by 0.0%% (3.57 Gg CO2 / year)
Most important changes per scenario and time frame
In the country reported priority scenario the following sector-gas combinations have the highest absolute impact on national total KyotoGHG (AR6GWP100) emissions in 2023 (top 5):
- 1: M.AG.ELV, N2O with -31.48 Gg CO2 / year (-1.8%)
- 2: 3.A, CH4 with 29.68 Gg CO2 / year (0.5%)
- 3: 5, N2O with -8.21 Gg CO2 / year (-8.5%)
- 4: 1.A, CH4 with -2.29 Gg CO2 / year (-5.7%)
- 5: 2, CO2 with -1.74 Gg CO2 / year (-12.6%)
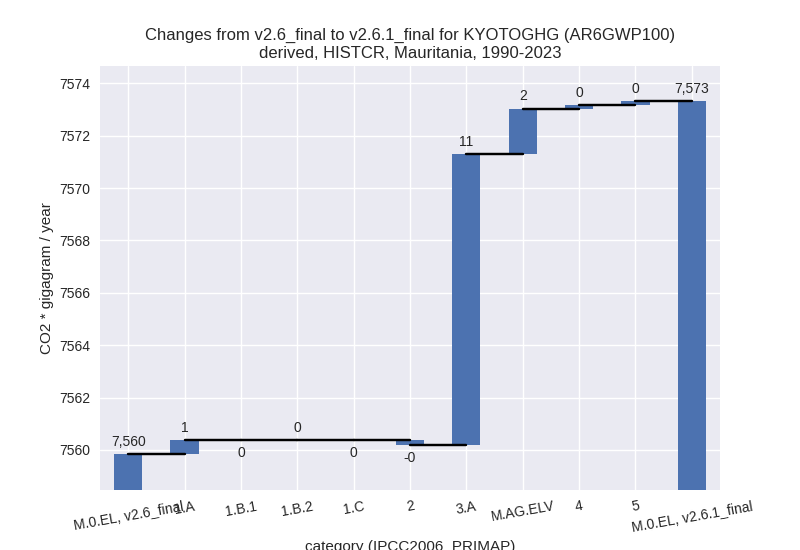
In the country reported priority scenario the following sector-gas combinations have the highest absolute impact on national total KyotoGHG (AR6GWP100) emissions in 1990-2023 (top 5):
- 1: 3.A, CH4 with 11.11 Gg CO2 / year (0.3%)
- 2: M.AG.ELV, N2O with 1.75 Gg CO2 / year (0.2%)
- 3: 1.A, N2O with 0.36 Gg CO2 / year (1.4%)
- 4: 2, CO2 with -0.20 Gg CO2 / year (-1.4%)
- 5: 1.A, CH4 with 0.19 Gg CO2 / year (0.5%)
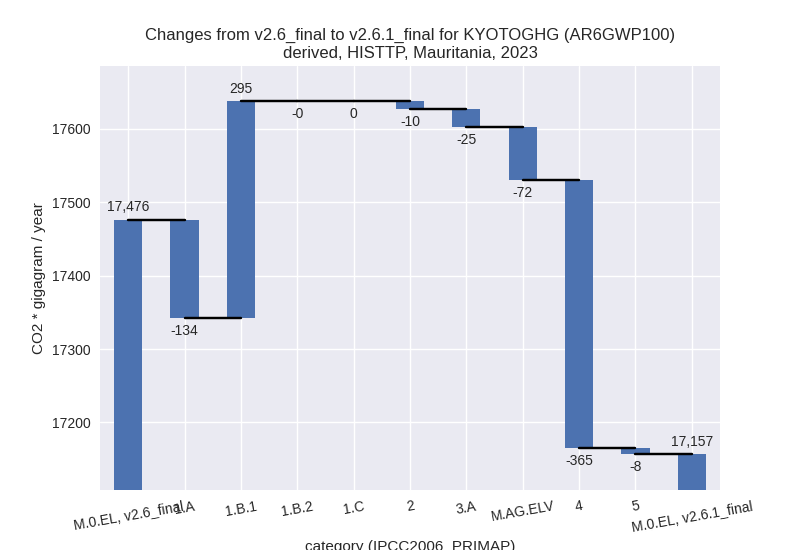
In the third party priority scenario the following sector-gas combinations have the highest absolute impact on national total KyotoGHG (AR6GWP100) emissions in 2023 (top 5):
- 1: 4, CH4 with -367.34 Gg CO2 / year (-31.8%)
- 2: 1.B.1, CH4 with 290.88 Gg CO2 / year (109.7%)
- 3: 1.A, CH4 with -125.98 Gg CO2 / year (-35.0%)
- 4: M.AG.ELV, N2O with -85.53 Gg CO2 / year (-2.9%)
- 5: 3.A, CH4 with -24.57 Gg CO2 / year (-0.4%)
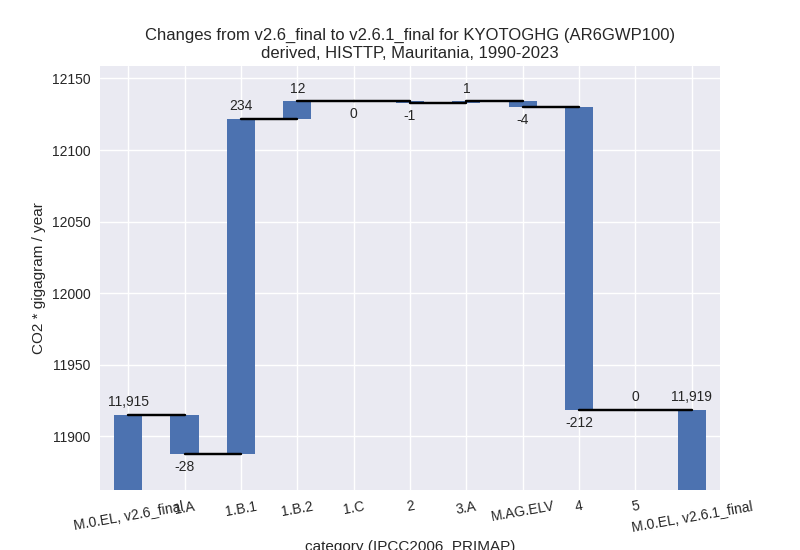
In the third party priority scenario the following sector-gas combinations have the highest absolute impact on national total KyotoGHG (AR6GWP100) emissions in 1990-2023 (top 5):
- 1: 1.B.1, CH4 with 231.06 Gg CO2 / year (131.6%)
- 2: 4, CH4 with -211.70 Gg CO2 / year (-30.6%)
- 3: 1.A, CH4 with -26.62 Gg CO2 / year (-11.3%)
- 4: 1.B.2, CH4 with 12.60 Gg CO2 / year (45.7%)
- 5: M.AG.ELV, N2O with -3.41 Gg CO2 / year (-0.1%)
Notes on data changes
Here we list notes explaining important emissions changes for the country.
- No new country reported data has been included. Changes in the CR time-series are small and come from updated third party data (EDGAR, FAO) which is used to extrapolate the country reported data.
- Changes in the TP scenario are from updated fugitive (1.B.x), waste
(4) and non-CO2 emissions in 1.A. N2O in M.AG.ELV have a small change
for the latest years due to an update in FAO data.
- Individual sector changes cancel leading to low changes in total emissions.
Changes by sector and gas
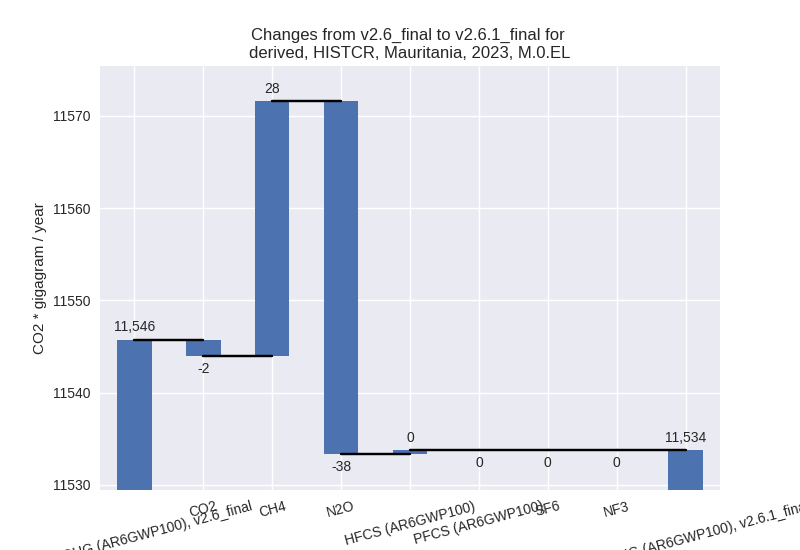
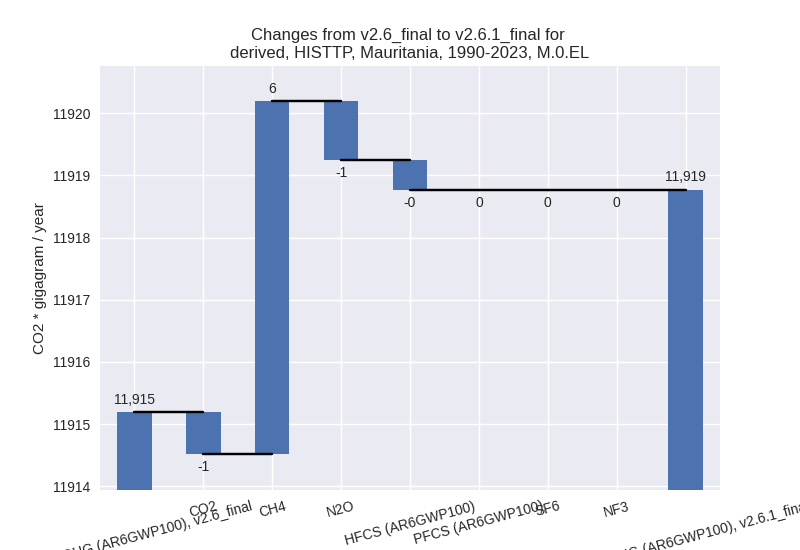
For each scenario and time frame the changes are displayed for all individual sectors and all individual gases. In the sector plot we use aggregate Kyoto GHGs in AR6GWP100. In the gas plot we usenational total emissions without LULUCF.
country reported scenario
2023
1990-2023
third party scenario
2023
1990-2023
Detailed changes for the scenarios:
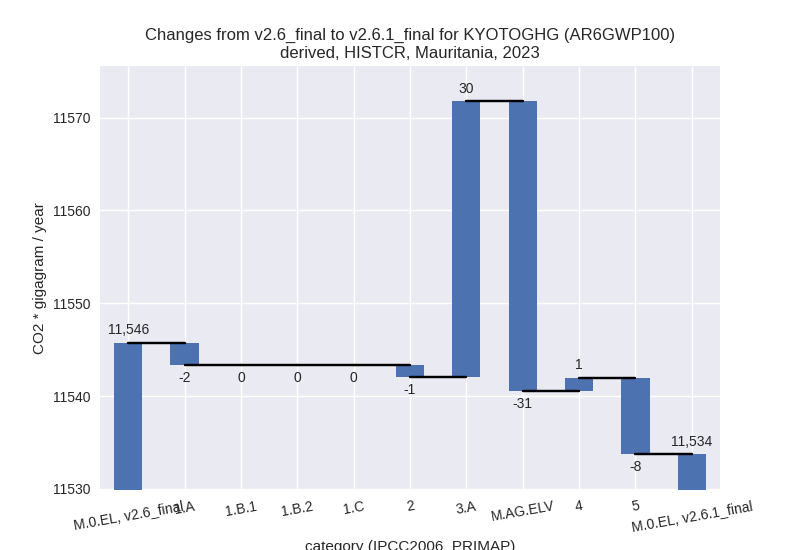
country reported scenario (HISTCR):
Most important changes per time frame
For 2023 the following sector-gas combinations have the highest absolute impact on national total KyotoGHG (AR6GWP100) emissions in 2023 (top 5):
- 1: M.AG.ELV, N2O with -31.48 Gg CO2 / year (-1.8%)
- 2: 3.A, CH4 with 29.68 Gg CO2 / year (0.5%)
- 3: 5, N2O with -8.21 Gg CO2 / year (-8.5%)
- 4: 1.A, CH4 with -2.29 Gg CO2 / year (-5.7%)
- 5: 2, CO2 with -1.74 Gg CO2 / year (-12.6%)
For 1990-2023 the following sector-gas combinations have the highest absolute impact on national total KyotoGHG (AR6GWP100) emissions in 1990-2023 (top 5):
- 1: 3.A, CH4 with 11.11 Gg CO2 / year (0.3%)
- 2: M.AG.ELV, N2O with 1.75 Gg CO2 / year (0.2%)
- 3: 1.A, N2O with 0.36 Gg CO2 / year (1.4%)
- 4: 2, CO2 with -0.20 Gg CO2 / year (-1.4%)
- 5: 1.A, CH4 with 0.19 Gg CO2 / year (0.5%)
Changes in the main sectors for aggregate KyotoGHG (AR6GWP100) are
- 1: Total sectoral emissions in 2022 are 3589.11 Gg CO2 / year which is 31.0% of M.0.EL emissions. 2023 Emissions have changed by -0.1% (-2.33 Gg CO2 / year). 1990-2023 Emissions have changed by 0.0% (0.54 Gg CO2 / year).
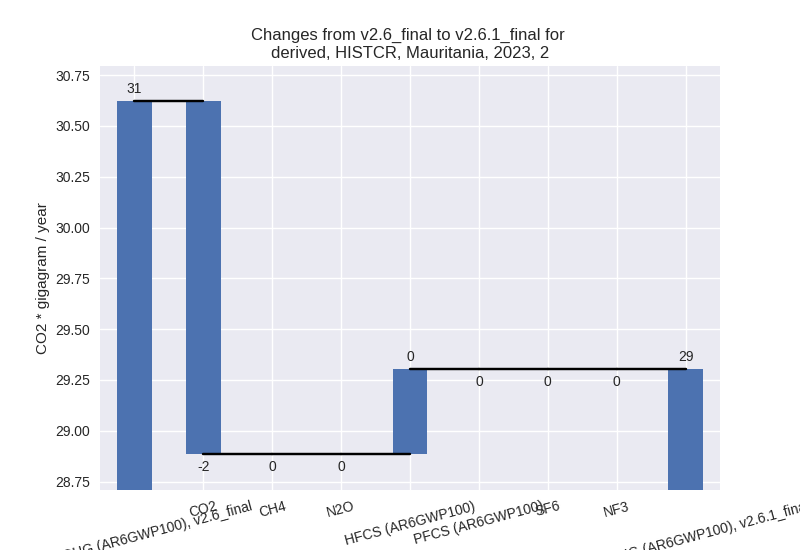
- 2: Total sectoral emissions in 2022 are 27.42 Gg
CO2 / year which is 0.2% of M.0.EL emissions. 2023 Emissions have
changed by -4.3% (-1.32 Gg CO2 /
year). 1990-2023 Emissions have changed by -0.9% (-0.19 Gg CO2 / year). For 2023 the
changes per gas
are:
- M.AG: Total sectoral emissions in 2022 are 7779.67 Gg CO2 / year which is 67.3% of M.0.EL emissions. 2023 Emissions have changed by -0.0% (-1.56 Gg CO2 / year). 1990-2023 Emissions have changed by 0.2% (12.85 Gg CO2 / year).
- 4: Total sectoral emissions in 2022 are 84.37 Gg CO2 / year which is 0.7% of M.0.EL emissions. 2023 Emissions have changed by 1.7% (1.43 Gg CO2 / year). 1990-2023 Emissions have changed by 0.3% (0.13 Gg CO2 / year).
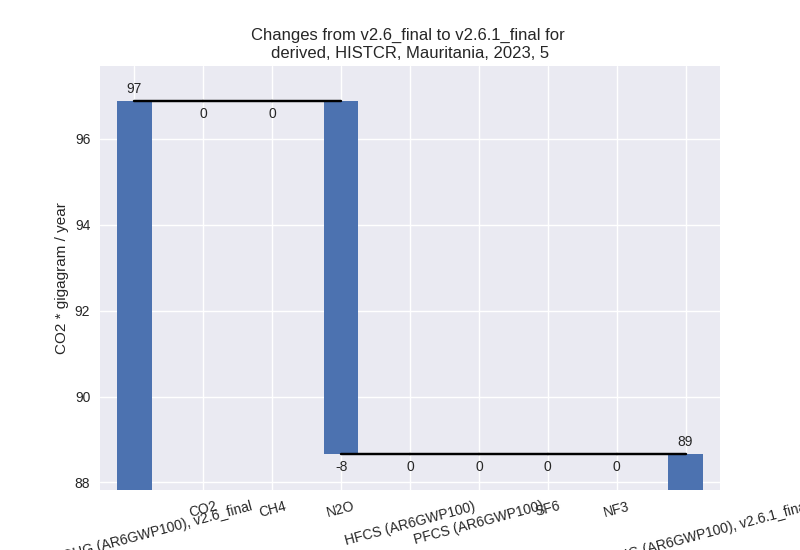
- 5: Total sectoral emissions in 2022 are 86.23 Gg
CO2 / year which is 0.7% of M.0.EL emissions. 2023 Emissions have
changed by -8.5% (-8.21 Gg CO2 /
year). 1990-2023 Emissions have changed by 0.3% (0.15 Gg CO2 / year). For 2023 the
changes per gas
are:
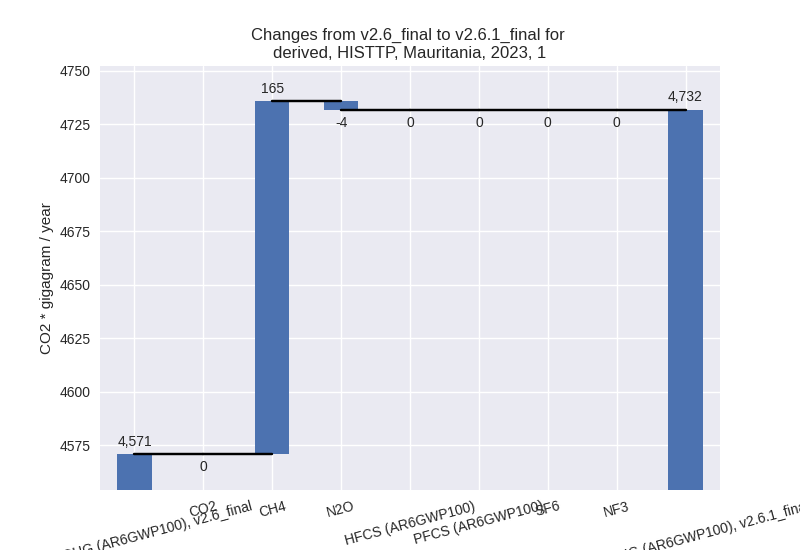
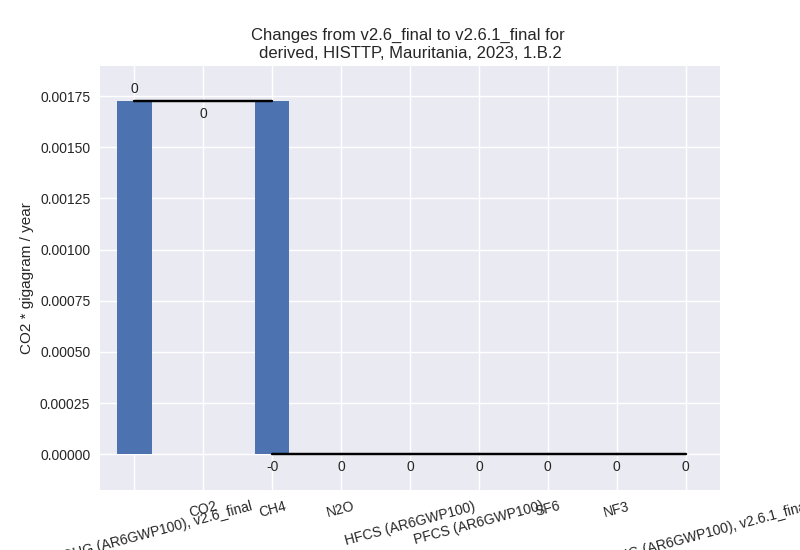
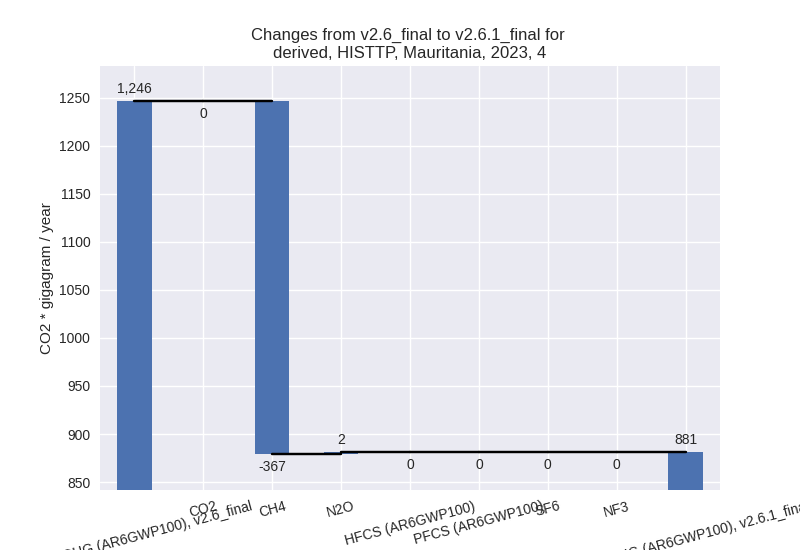
third party scenario (HISTTP):
Most important changes per time frame
For 2023 the following sector-gas combinations have the highest absolute impact on national total KyotoGHG (AR6GWP100) emissions in 2023 (top 5):
- 1: 4, CH4 with -367.34 Gg CO2 / year (-31.8%)
- 2: 1.B.1, CH4 with 290.88 Gg CO2 / year (109.7%)
- 3: 1.A, CH4 with -125.98 Gg CO2 / year (-35.0%)
- 4: M.AG.ELV, N2O with -85.53 Gg CO2 / year (-2.9%)
- 5: 3.A, CH4 with -24.57 Gg CO2 / year (-0.4%)
For 1990-2023 the following sector-gas combinations have the highest absolute impact on national total KyotoGHG (AR6GWP100) emissions in 1990-2023 (top 5):
- 1: 1.B.1, CH4 with 231.06 Gg CO2 / year (131.6%)
- 2: 4, CH4 with -211.70 Gg CO2 / year (-30.6%)
- 3: 1.A, CH4 with -26.62 Gg CO2 / year (-11.3%)
- 4: 1.B.2, CH4 with 12.60 Gg CO2 / year (45.7%)
- 5: M.AG.ELV, N2O with -3.41 Gg CO2 / year (-0.1%)
Changes in the main sectors for aggregate KyotoGHG (AR6GWP100) are
- 1: Total sectoral emissions in 2022 are 4852.24 Gg
CO2 / year which is 28.6% of M.0.EL emissions. 2023 Emissions have
changed by 3.5% (160.94 Gg CO2 /
year). 1990-2023 Emissions have changed by 8.7% (218.86 Gg CO2 / year). For 2023 the
changes per gas
are:
For 1990-2023 the changes per gas are: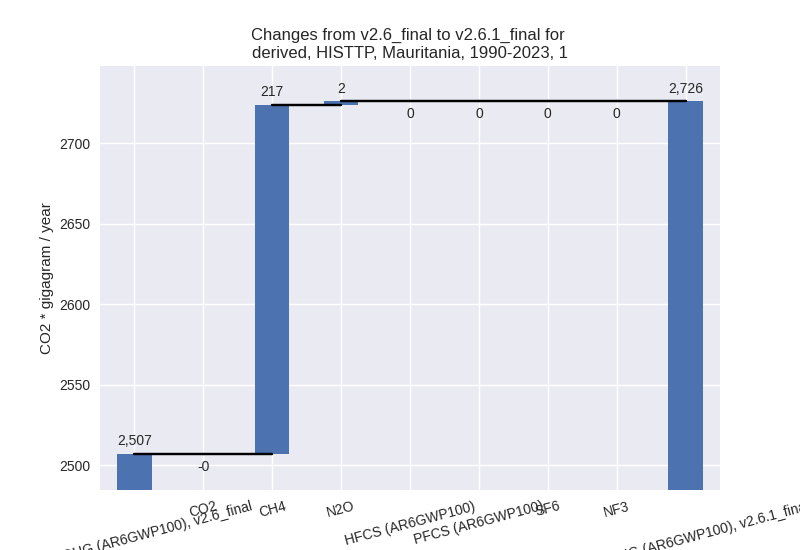
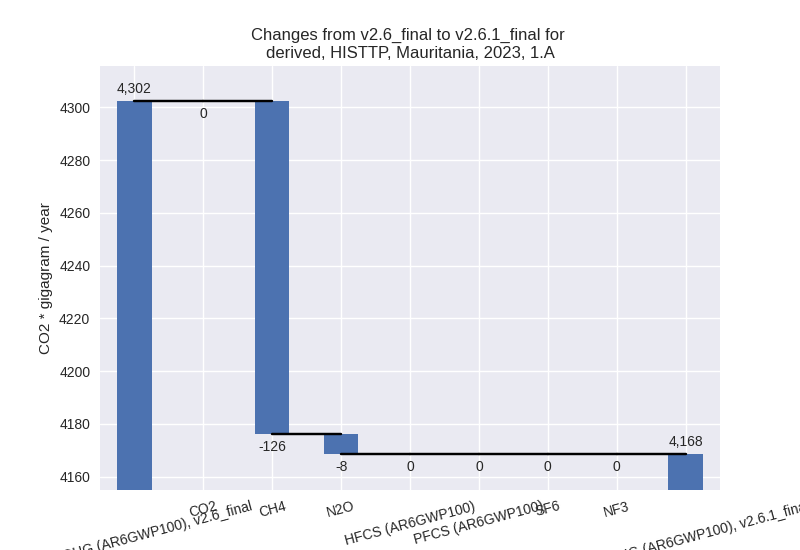
The changes come from the following subsectors:- 1.A: Total sectoral emissions in 2022 are 4288.90
Gg CO2 / year which is 88.4% of category 1 emissions. 2023 Emissions
have changed by -3.1% (-133.80 Gg
CO2 / year). 1990-2023 Emissions have changed by -1.2% (-27.58 Gg CO2 / year). For 2023 the
changes per gas
are:
There is no subsector information available in PRIMAP-hist. - 1.B.1: Total sectoral emissions in 2022 are 563.34
Gg CO2 / year which is 11.6% of category 1 emissions. 2023 Emissions
have changed by 109.7% (294.74 Gg
CO2 / year). 1990-2023 Emissions have changed by 131.6% (234.13 Gg CO2 / year). For 2023
the changes per gas
are:

For 1990-2023 the changes per gas are: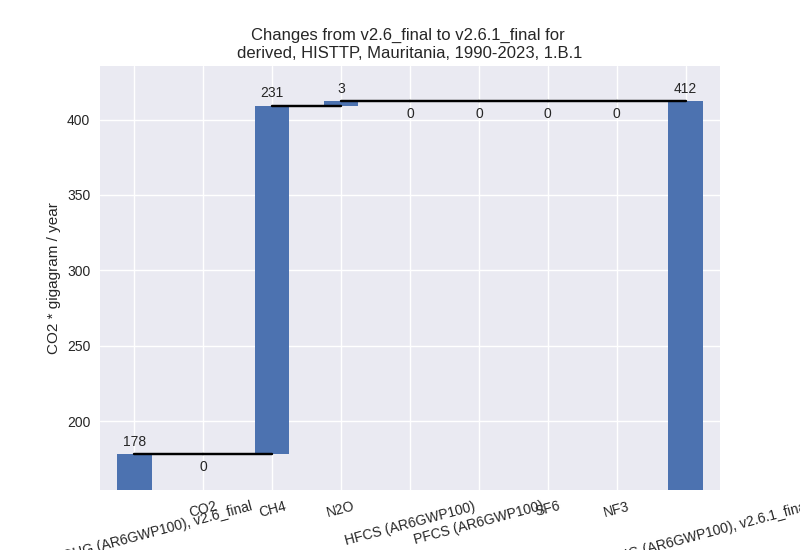
There is no subsector information available in PRIMAP-hist. - 1.B.2: Total sectoral emissions in 2022 are 0.00 Gg
CO2 / year which is 0.0% of category 1 emissions. 2023 Emissions have
changed by -100.0% (-0.00 Gg CO2 /
year). 1990-2023 Emissions have changed by 21.0% (12.31 Gg CO2 / year). For 2023 the
changes per gas
are:
For 1990-2023 the changes per gas are: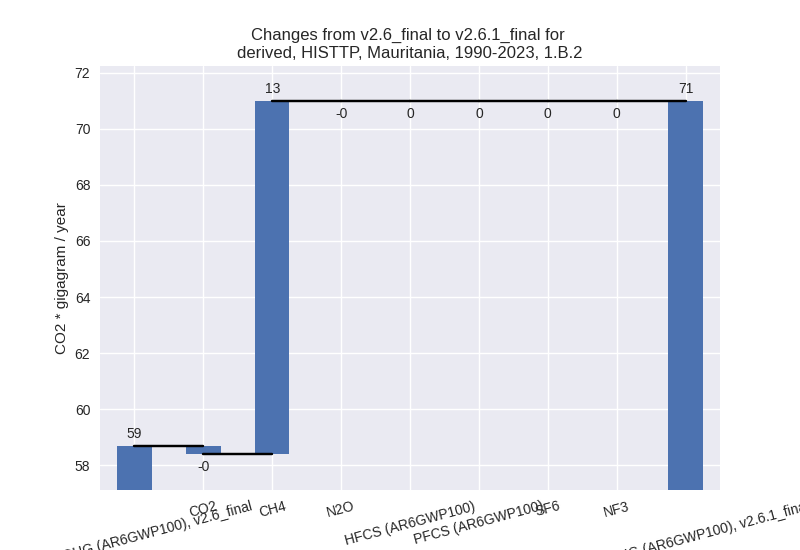
There is no subsector information available in PRIMAP-hist.
- 1.A: Total sectoral emissions in 2022 are 4288.90
Gg CO2 / year which is 88.4% of category 1 emissions. 2023 Emissions
have changed by -3.1% (-133.80 Gg
CO2 / year). 1990-2023 Emissions have changed by -1.2% (-27.58 Gg CO2 / year). For 2023 the
changes per gas
are:
- 2: Total sectoral emissions in 2022 are 857.85 Gg CO2 / year which is 5.0% of M.0.EL emissions. 2023 Emissions have changed by -1.1% (-9.91 Gg CO2 / year). 1990-2023 Emissions have changed by -0.3% (-0.87 Gg CO2 / year).
- M.AG: Total sectoral emissions in 2022 are 10335.12 Gg CO2 / year which is 60.8% of M.0.EL emissions. 2023 Emissions have changed by -0.9% (-96.84 Gg CO2 / year). 1990-2023 Emissions have changed by -0.0% (-3.07 Gg CO2 / year).
- 4: Total sectoral emissions in 2022 are 856.95 Gg
CO2 / year which is 5.0% of M.0.EL emissions. 2023 Emissions have
changed by -29.3% (-365.34 Gg CO2 /
year). 1990-2023 Emissions have changed by -28.4% (-211.50 Gg CO2 / year). For 2023
the changes per gas
are:
For 1990-2023 the changes per gas are:
- 5: Total sectoral emissions in 2022 are 86.23 Gg
CO2 / year which is 0.5% of M.0.EL emissions. 2023 Emissions have
changed by -8.5% (-8.21 Gg CO2 /
year). 1990-2023 Emissions have changed by 0.3% (0.15 Gg CO2 / year). For 2023 the
changes per gas
are:
