Changes in PRIMAP-hist v2.6.1_final compared to v2.6_final for Malawi
2025-03-19
Johannes Gütschow
Change analysis for Malawi for PRIMAP-hist v2.6.1_final compared to v2.6_final
Overview over emissions by sector and gas
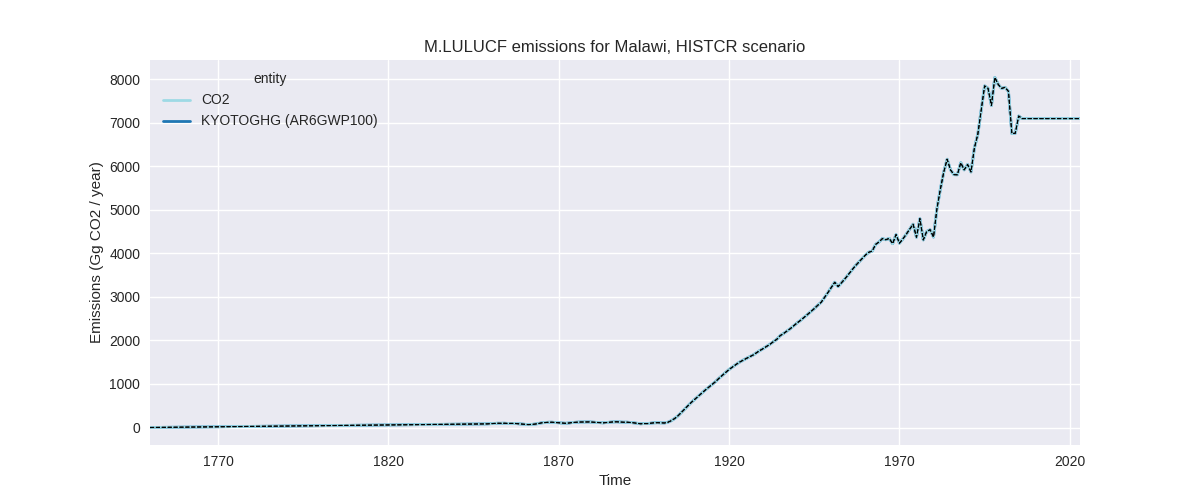
The following figures show the aggregate national total emissions excluding LULUCF AR6GWP100 for the country reported priority scenario. The dotted linesshow the v2.6_final data.


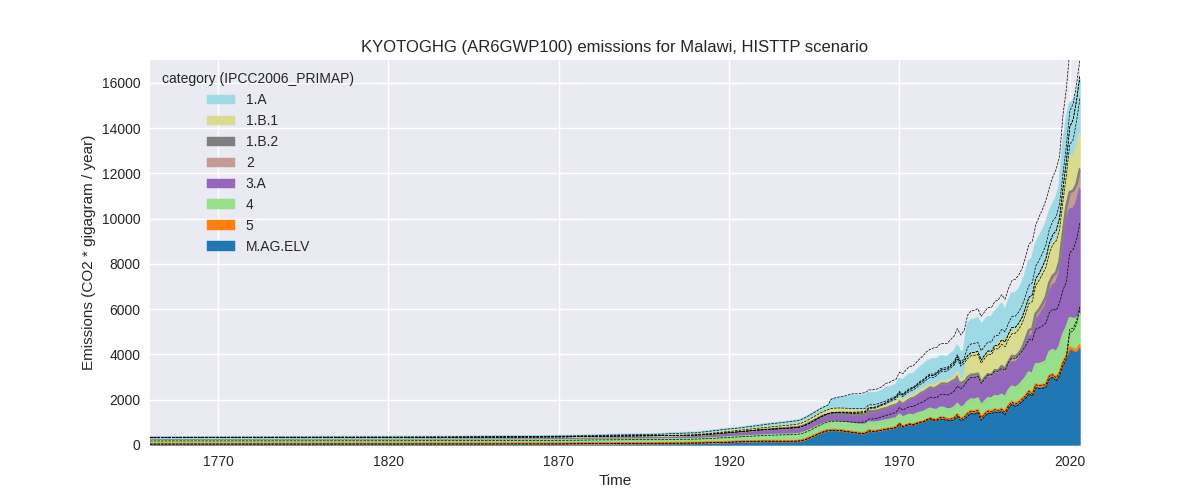
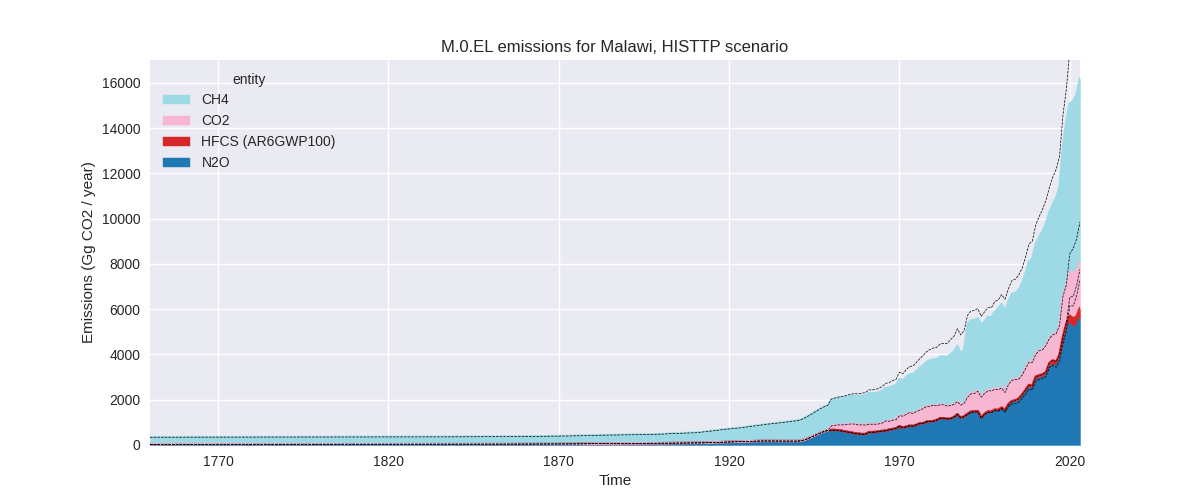
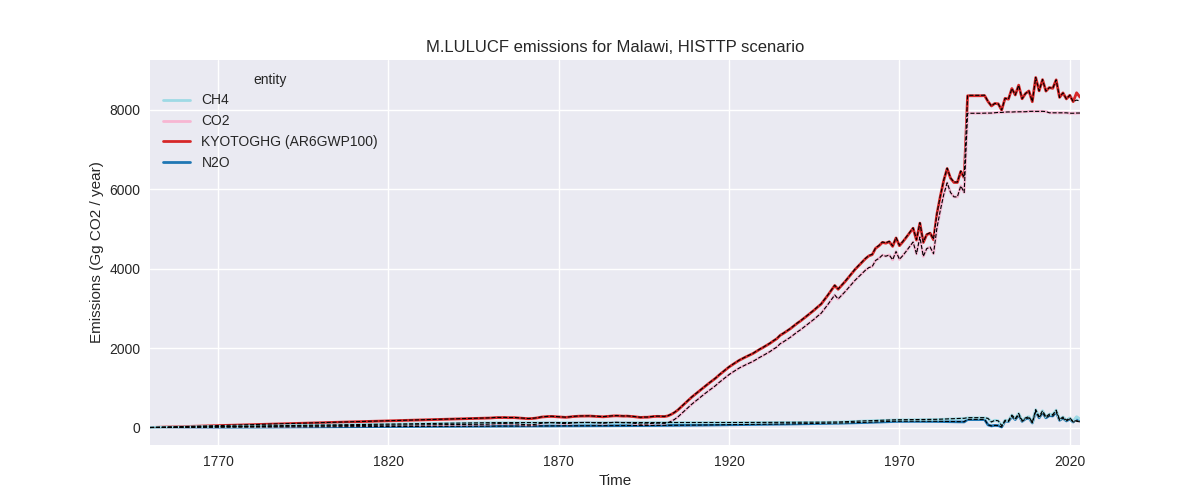
The following figures show the aggregate national total emissions excluding LULUCF AR6GWP100 for the third party priority scenario. The dotted linesshow the v2.6_final data.
Overview over changes
In the country reported priority scenario we have the following changes for aggregate Kyoto GHG and national total emissions excluding LULUCF (M.0.EL):
- Emissions in 2023 have changed by -18.4%% (-3658.00 Gg CO2 / year)
- Emissions in 1990-2023 have changed by -10.3%% (-999.54 Gg CO2 / year)
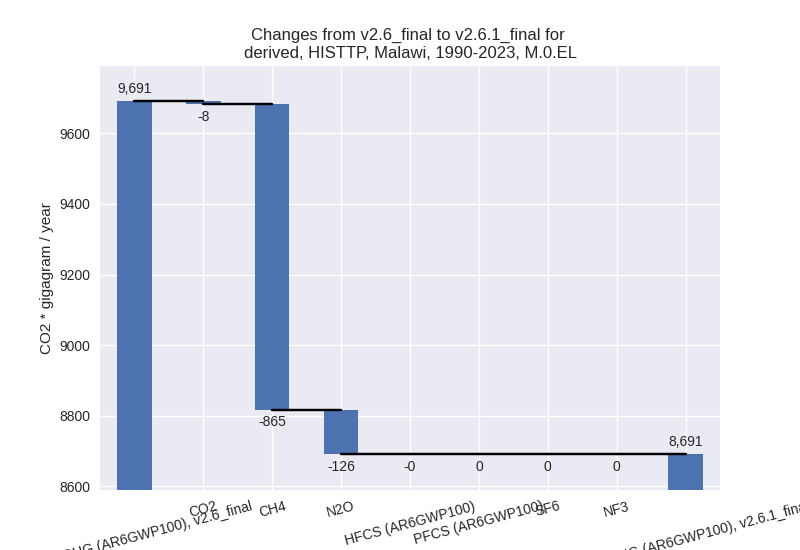
In the third party priority scenario we have the following changes for aggregate Kyoto GHG and national total emissions excluding LULUCF (M.0.EL):
- Emissions in 2023 have changed by -18.4%% (-3658.00 Gg CO2 / year)
- Emissions in 1990-2023 have changed by -10.3%% (-999.54 Gg CO2 / year)
Most important changes per scenario and time frame
In the country reported priority scenario the following sector-gas combinations have the highest absolute impact on national total KyotoGHG (AR6GWP100) emissions in 2023 (top 5):
- 1: 4, CH4 with -2253.95 Gg CO2 / year (-66.1%)
- 2: M.AG.ELV, N2O with -1784.84 Gg CO2 / year (-31.7%)
- 3: 1.B.1, CH4 with 819.31 Gg CO2 / year (114.0%)
- 4: 1.A, CH4 with -329.88 Gg CO2 / year (-35.8%)
- 5: 3.A, CH4 with -162.08 Gg CO2 / year (-3.6%)
In the country reported priority scenario the following sector-gas combinations have the highest absolute impact on national total KyotoGHG (AR6GWP100) emissions in 1990-2023 (top 5):
- 1: 4, CH4 with -1479.12 Gg CO2 / year (-68.1%)
- 2: 1.B.1, CH4 with 690.98 Gg CO2 / year (132.9%)
- 3: M.AG.ELV, N2O with -144.12 Gg CO2 / year (-7.0%)
- 4: 1.A, CH4 with -72.18 Gg CO2 / year (-10.1%)
- 5: 5, N2O with 11.56 Gg CO2 / year (9.9%)
In the third party priority scenario the following sector-gas combinations have the highest absolute impact on national total KyotoGHG (AR6GWP100) emissions in 2023 (top 5):
- 1: 4, CH4 with -2253.95 Gg CO2 / year (-66.1%)
- 2: M.AG.ELV, N2O with -1784.84 Gg CO2 / year (-31.7%)
- 3: 1.B.1, CH4 with 819.31 Gg CO2 / year (114.0%)
- 4: 1.A, CH4 with -329.88 Gg CO2 / year (-35.8%)
- 5: 3.A, CH4 with -162.08 Gg CO2 / year (-3.6%)
In the third party priority scenario the following sector-gas combinations have the highest absolute impact on national total KyotoGHG (AR6GWP100) emissions in 1990-2023 (top 5):
- 1: 4, CH4 with -1479.12 Gg CO2 / year (-68.1%)
- 2: 1.B.1, CH4 with 690.98 Gg CO2 / year (132.9%)
- 3: M.AG.ELV, N2O with -144.12 Gg CO2 / year (-7.0%)
- 4: 1.A, CH4 with -72.18 Gg CO2 / year (-10.1%)
- 5: 5, N2O with 11.56 Gg CO2 / year (9.9%)
Notes on data changes
Here we list notes explaining important emissions changes for the country.
- There is no usable country reported data for Malawi, thus the CR and TP time-series are identical.
- The main change is for waste CH4 and due to updated EDGAR data.
- N2O emission in M.AG.ELV are lower starting in 2020 because FAO emissions have been revised.
- Higher CH4 in 1.B.1 is directly from EDGAR
- Lower CH4 in 1.A is directly from EDGAR where emissions have been revised downward starting in 2010.
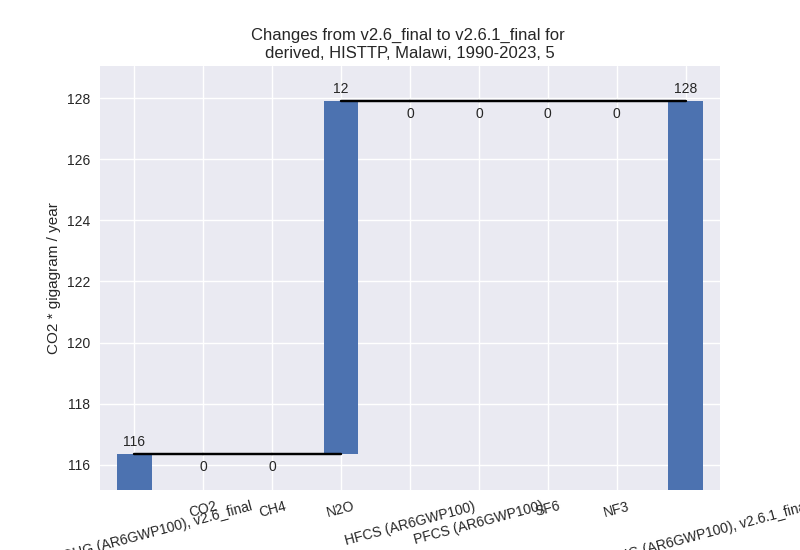
Changes by sector and gas
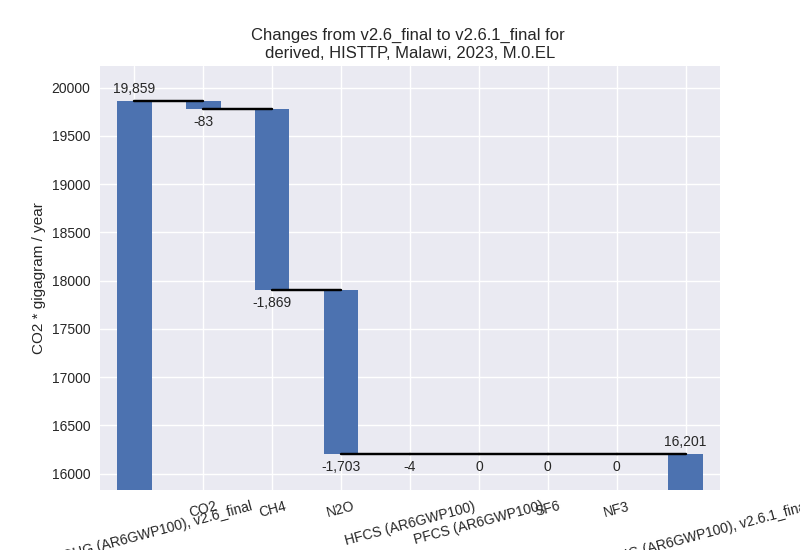
For each scenario and time frame the changes are displayed for all individual sectors and all individual gases. In the sector plot we use aggregate Kyoto GHGs in AR6GWP100. In the gas plot we usenational total emissions without LULUCF.
country reported scenario
2023

1990-2023

third party scenario
2023

1990-2023

Detailed changes for the scenarios:
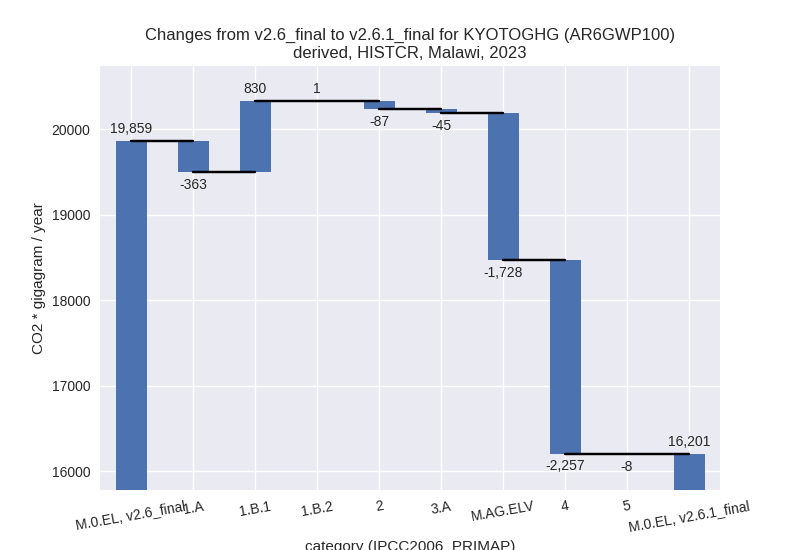
country reported scenario (HISTCR):
Most important changes per time frame
For 2023 the following sector-gas combinations have the highest absolute impact on national total KyotoGHG (AR6GWP100) emissions in 2023 (top 5):
- 1: 4, CH4 with -2253.95 Gg CO2 / year (-66.1%)
- 2: M.AG.ELV, N2O with -1784.84 Gg CO2 / year (-31.7%)
- 3: 1.B.1, CH4 with 819.31 Gg CO2 / year (114.0%)
- 4: 1.A, CH4 with -329.88 Gg CO2 / year (-35.8%)
- 5: 3.A, CH4 with -162.08 Gg CO2 / year (-3.6%)
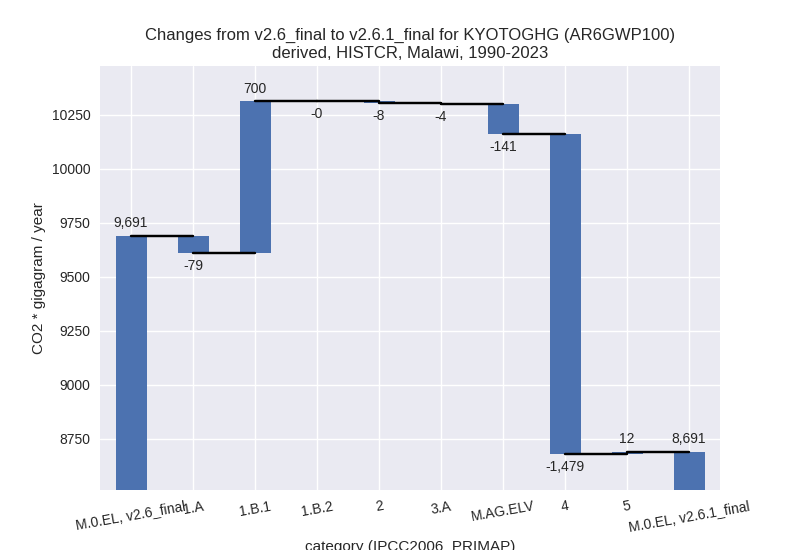
For 1990-2023 the following sector-gas combinations have the highest absolute impact on national total KyotoGHG (AR6GWP100) emissions in 1990-2023 (top 5):
- 1: 4, CH4 with -1479.12 Gg CO2 / year (-68.1%)
- 2: 1.B.1, CH4 with 690.98 Gg CO2 / year (132.9%)
- 3: M.AG.ELV, N2O with -144.12 Gg CO2 / year (-7.0%)
- 4: 1.A, CH4 with -72.18 Gg CO2 / year (-10.1%)
- 5: 5, N2O with 11.56 Gg CO2 / year (9.9%)
Changes in the main sectors for aggregate KyotoGHG (AR6GWP100) are
- 1: Total sectoral emissions in 2022 are 3956.49 Gg
CO2 / year which is 25.6% of M.0.EL emissions. 2023 Emissions have
changed by 13.2% (467.46 Gg CO2 /
year). 1990-2023 Emissions have changed by 26.0% (620.78 Gg CO2 / year). For 2023 the
changes per gas
are:

For 1990-2023 the changes per gas are:
The changes come from the following subsectors:- 1.A: Total sectoral emissions in 2022 are 2401.38
Gg CO2 / year which is 60.7% of category 1 emissions. 2023 Emissions
have changed by -12.9% (-363.38 Gg
CO2 / year). 1990-2023 Emissions have changed by -4.2% (-78.64 Gg CO2 / year). For 2023 the
changes per gas
are:

For 1990-2023 the changes per gas are:
There is no subsector information available in PRIMAP-hist. - 1.B.1: Total sectoral emissions in 2022 are 1553.95
Gg CO2 / year which is 39.3% of category 1 emissions. 2023 Emissions
have changed by 113.9% (829.70 Gg
CO2 / year). 1990-2023 Emissions have changed by 132.8% (699.62 Gg CO2 / year). For 2023
the changes per gas
are:

For 1990-2023 the changes per gas are:
There is no subsector information available in PRIMAP-hist. - 1.B.2: Total sectoral emissions in 2022 are 1.17 Gg
CO2 / year which is 0.0% of category 1 emissions. 2023 Emissions have
changed by 978.4% (1.13 Gg CO2 /
year). 1990-2023 Emissions have changed by -34.2% (-0.20 Gg CO2 / year). For 2023 the
changes per gas
are:
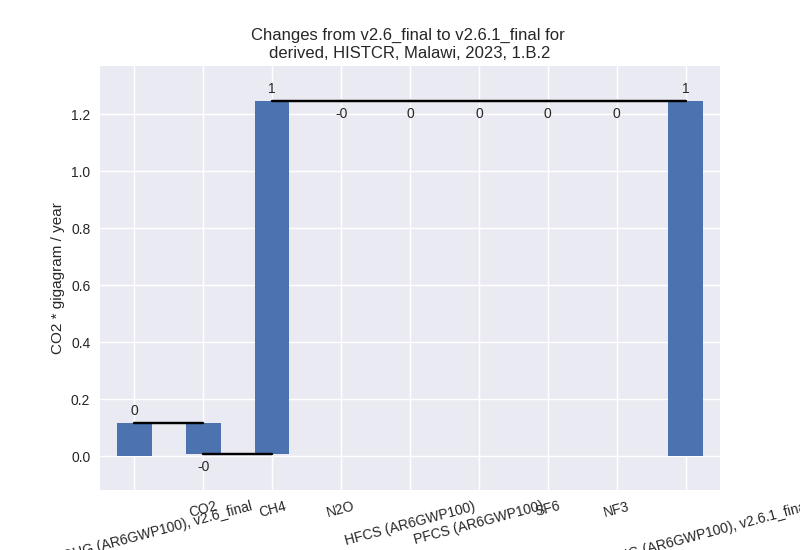
For 1990-2023 the changes per gas are:
There is no subsector information available in PRIMAP-hist.
- 1.A: Total sectoral emissions in 2022 are 2401.38
Gg CO2 / year which is 60.7% of category 1 emissions. 2023 Emissions
have changed by -12.9% (-363.38 Gg
CO2 / year). 1990-2023 Emissions have changed by -4.2% (-78.64 Gg CO2 / year). For 2023 the
changes per gas
are:
- 2: Total sectoral emissions in 2022 are 840.19 Gg
CO2 / year which is 5.4% of M.0.EL emissions. 2023 Emissions have
changed by -9.0% (-86.51 Gg CO2 /
year). 1990-2023 Emissions have changed by -2.3% (-7.93 Gg CO2 / year). For 2023 the
changes per gas
are:

For 1990-2023 the changes per gas are: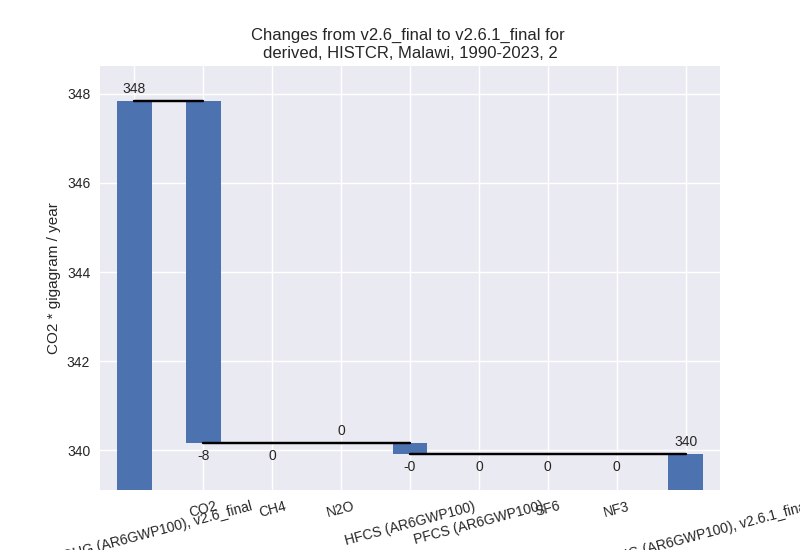
- M.AG: Total sectoral emissions in 2022 are 9152.61
Gg CO2 / year which is 59.1% of M.0.EL emissions. 2023 Emissions have
changed by -15.4% (-1773.61 Gg CO2 /
year). 1990-2023 Emissions have changed by -3.2% (-144.62 Gg CO2 / year). For 2023
the changes per gas
are:
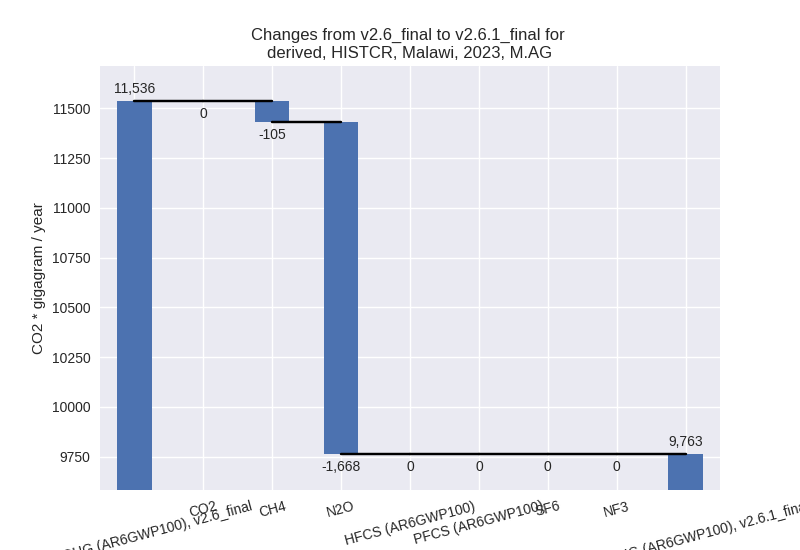
For 1990-2023 the changes per gas are: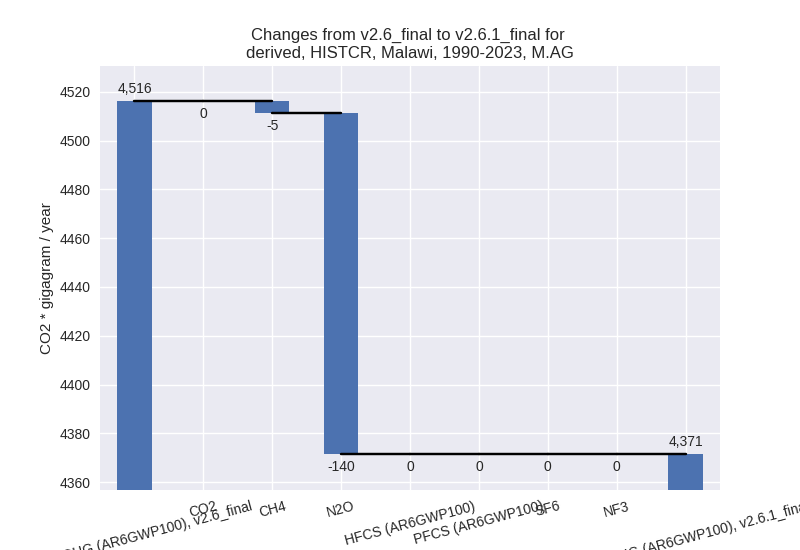
The changes come from the following subsectors:- 3.A: Total sectoral emissions in 2022 are 5112.40 Gg CO2 / year which is 55.9% of category M.AG emissions. 2023 Emissions have changed by -0.8% (-45.36 Gg CO2 / year). 1990-2023 Emissions have changed by -0.2% (-3.76 Gg CO2 / year).
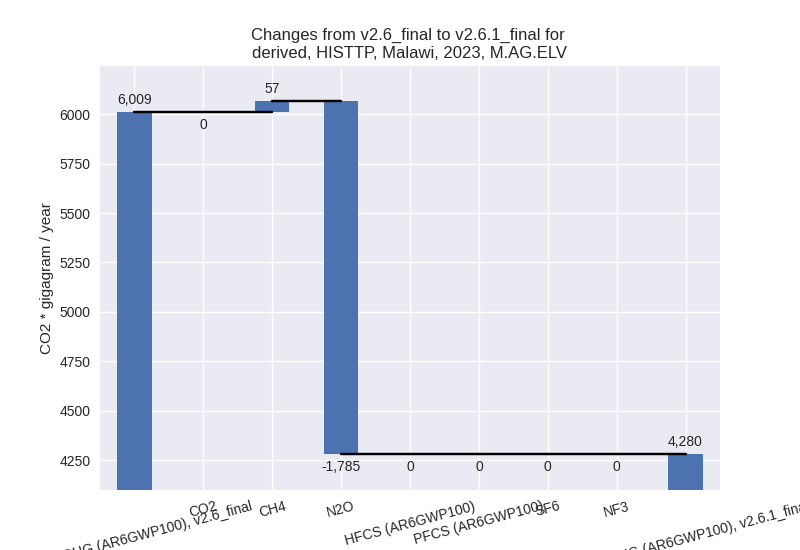
- M.AG.ELV: Total sectoral emissions in 2022 are
4040.21 Gg CO2 / year which is 44.1% of category M.AG emissions. 2023
Emissions have changed by -28.8%
(-1728.25 Gg CO2 / year). 1990-2023 Emissions have changed by -5.8% (-140.86 Gg CO2 / year). For 2023
the changes per gas
are:

For 1990-2023 the changes per gas are: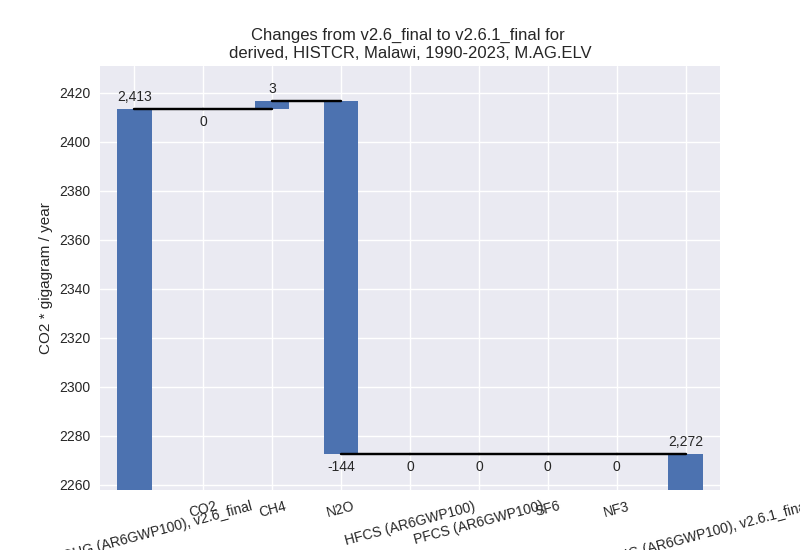
There is no subsector information available in PRIMAP-hist.
- 4: Total sectoral emissions in 2022 are 1382.06 Gg
CO2 / year which is 8.9% of M.0.EL emissions. 2023 Emissions have
changed by -61.3% (-2257.16 Gg CO2 /
year). 1990-2023 Emissions have changed by -63.6% (-1479.32 Gg CO2 / year). For 2023
the changes per gas
are:

For 1990-2023 the changes per gas are:
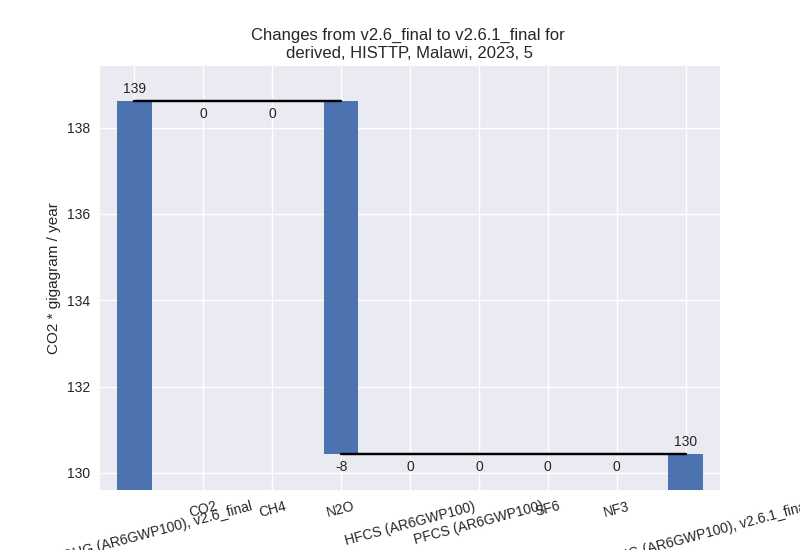
- 5: Total sectoral emissions in 2022 are 143.81 Gg
CO2 / year which is 0.9% of M.0.EL emissions. 2023 Emissions have
changed by -5.9% (-8.18 Gg CO2 /
year). 1990-2023 Emissions have changed by 9.9% (11.56 Gg CO2 / year). For 2023 the
changes per gas
are:

For 1990-2023 the changes per gas are:
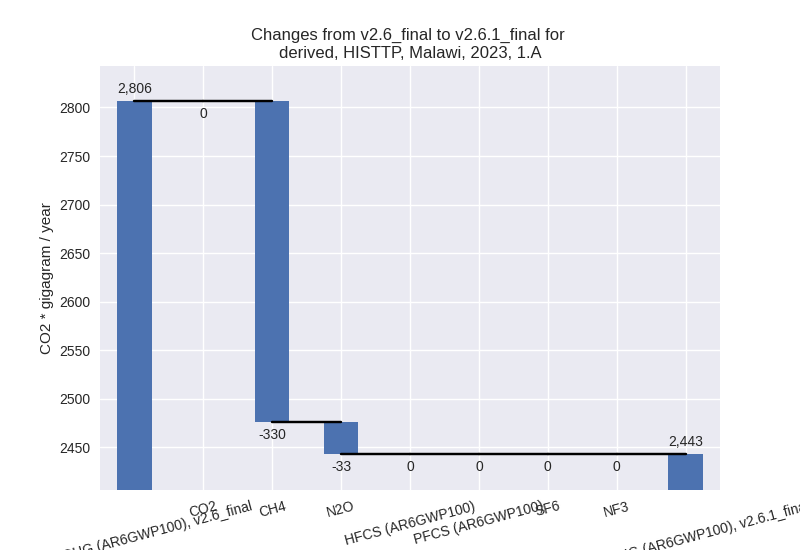
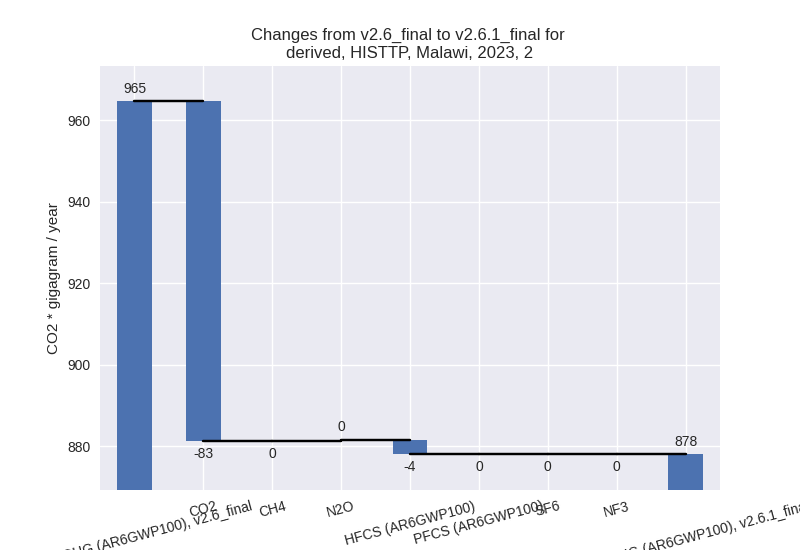
third party scenario (HISTTP):
Most important changes per time frame
For 2023 the following sector-gas combinations have the highest absolute impact on national total KyotoGHG (AR6GWP100) emissions in 2023 (top 5):
- 1: 4, CH4 with -2253.95 Gg CO2 / year (-66.1%)
- 2: M.AG.ELV, N2O with -1784.84 Gg CO2 / year (-31.7%)
- 3: 1.B.1, CH4 with 819.31 Gg CO2 / year (114.0%)
- 4: 1.A, CH4 with -329.88 Gg CO2 / year (-35.8%)
- 5: 3.A, CH4 with -162.08 Gg CO2 / year (-3.6%)
For 1990-2023 the following sector-gas combinations have the highest absolute impact on national total KyotoGHG (AR6GWP100) emissions in 1990-2023 (top 5):
- 1: 4, CH4 with -1479.12 Gg CO2 / year (-68.1%)
- 2: 1.B.1, CH4 with 690.98 Gg CO2 / year (132.9%)
- 3: M.AG.ELV, N2O with -144.12 Gg CO2 / year (-7.0%)
- 4: 1.A, CH4 with -72.18 Gg CO2 / year (-10.1%)
- 5: 5, N2O with 11.56 Gg CO2 / year (9.9%)
Changes in the main sectors for aggregate KyotoGHG (AR6GWP100) are
- 1: Total sectoral emissions in 2022 are 3956.49 Gg
CO2 / year which is 25.6% of M.0.EL emissions. 2023 Emissions have
changed by 13.2% (467.46 Gg CO2 /
year). 1990-2023 Emissions have changed by 26.0% (620.78 Gg CO2 / year). For 2023 the
changes per gas
are:
For 1990-2023 the changes per gas are: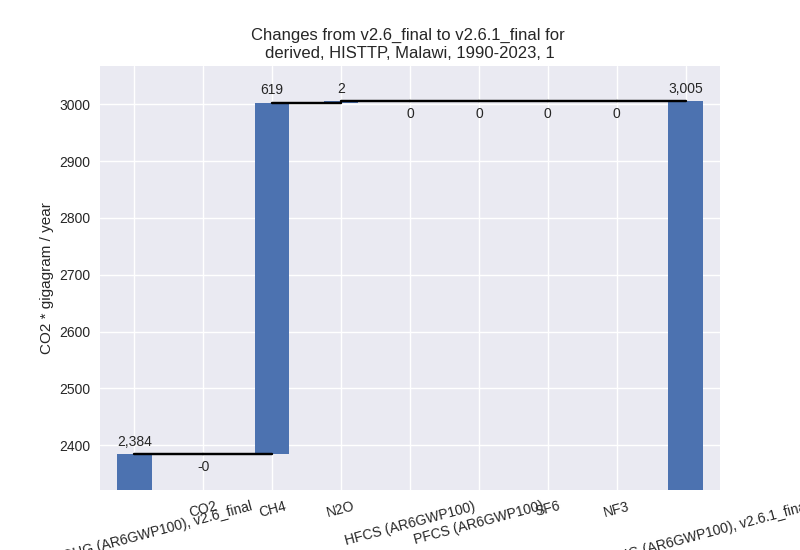
The changes come from the following subsectors:- 1.A: Total sectoral emissions in 2022 are 2401.38
Gg CO2 / year which is 60.7% of category 1 emissions. 2023 Emissions
have changed by -12.9% (-363.38 Gg
CO2 / year). 1990-2023 Emissions have changed by -4.2% (-78.64 Gg CO2 / year). For 2023 the
changes per gas
are:
For 1990-2023 the changes per gas are:
There is no subsector information available in PRIMAP-hist. - 1.B.1: Total sectoral emissions in 2022 are 1553.95
Gg CO2 / year which is 39.3% of category 1 emissions. 2023 Emissions
have changed by 113.9% (829.70 Gg
CO2 / year). 1990-2023 Emissions have changed by 132.8% (699.62 Gg CO2 / year). For 2023
the changes per gas
are:

For 1990-2023 the changes per gas are: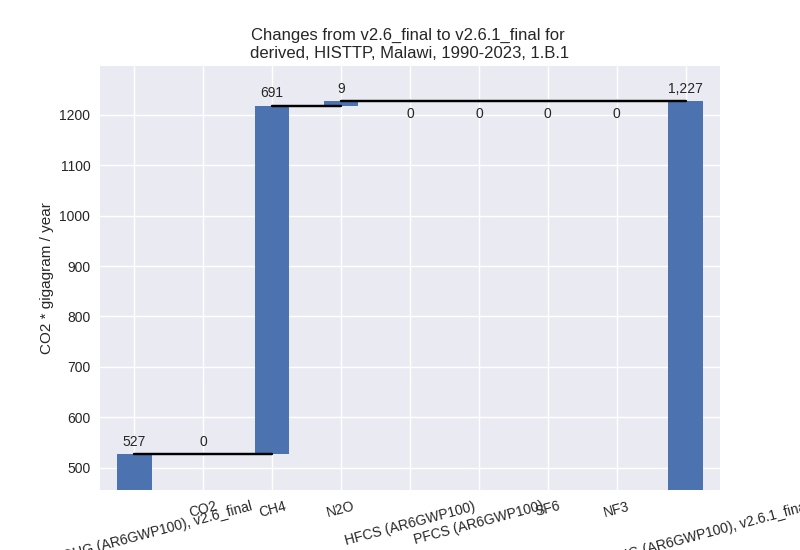
There is no subsector information available in PRIMAP-hist. - 1.B.2: Total sectoral emissions in 2022 are 1.17 Gg
CO2 / year which is 0.0% of category 1 emissions. 2023 Emissions have
changed by 978.4% (1.13 Gg CO2 /
year). 1990-2023 Emissions have changed by -34.2% (-0.20 Gg CO2 / year). For 2023 the
changes per gas
are:

For 1990-2023 the changes per gas are: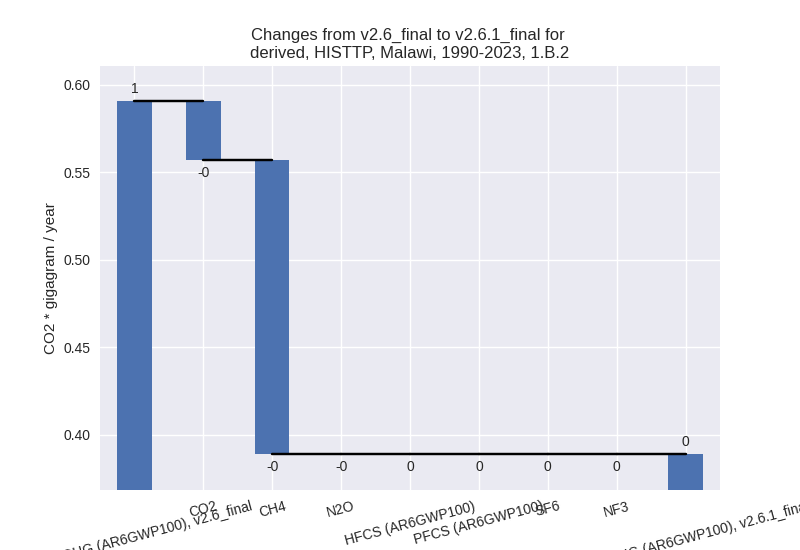
There is no subsector information available in PRIMAP-hist.
- 1.A: Total sectoral emissions in 2022 are 2401.38
Gg CO2 / year which is 60.7% of category 1 emissions. 2023 Emissions
have changed by -12.9% (-363.38 Gg
CO2 / year). 1990-2023 Emissions have changed by -4.2% (-78.64 Gg CO2 / year). For 2023 the
changes per gas
are:
- 2: Total sectoral emissions in 2022 are 840.19 Gg
CO2 / year which is 5.4% of M.0.EL emissions. 2023 Emissions have
changed by -9.0% (-86.51 Gg CO2 /
year). 1990-2023 Emissions have changed by -2.3% (-7.93 Gg CO2 / year). For 2023 the
changes per gas
are:
For 1990-2023 the changes per gas are:
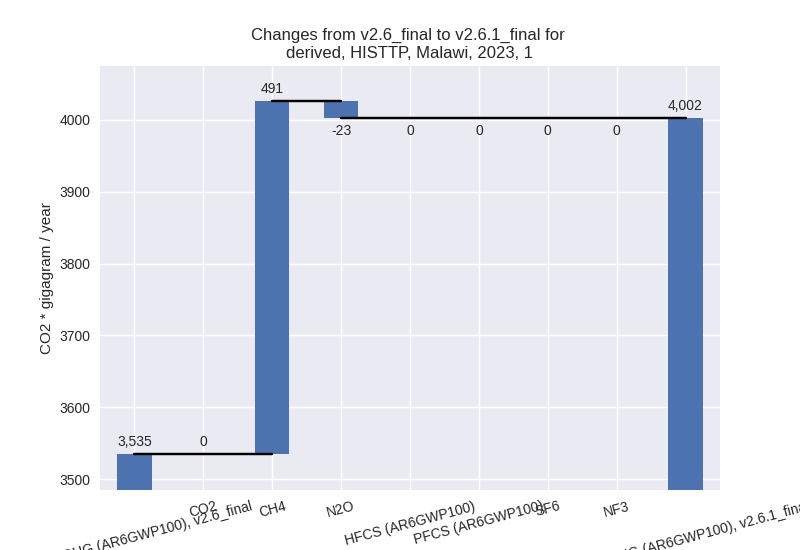
- M.AG: Total sectoral emissions in 2022 are 9152.61
Gg CO2 / year which is 59.1% of M.0.EL emissions. 2023 Emissions have
changed by -15.4% (-1773.61 Gg CO2 /
year). 1990-2023 Emissions have changed by -3.2% (-144.62 Gg CO2 / year). For 2023
the changes per gas
are:

For 1990-2023 the changes per gas are:
The changes come from the following subsectors:- 3.A: Total sectoral emissions in 2022 are 5112.40 Gg CO2 / year which is 55.9% of category M.AG emissions. 2023 Emissions have changed by -0.8% (-45.36 Gg CO2 / year). 1990-2023 Emissions have changed by -0.2% (-3.76 Gg CO2 / year).
- M.AG.ELV: Total sectoral emissions in 2022 are
4040.21 Gg CO2 / year which is 44.1% of category M.AG emissions. 2023
Emissions have changed by -28.8%
(-1728.25 Gg CO2 / year). 1990-2023 Emissions have changed by -5.8% (-140.86 Gg CO2 / year). For 2023
the changes per gas
are:
For 1990-2023 the changes per gas are:
There is no subsector information available in PRIMAP-hist.
- 4: Total sectoral emissions in 2022 are 1382.06 Gg
CO2 / year which is 8.9% of M.0.EL emissions. 2023 Emissions have
changed by -61.3% (-2257.16 Gg CO2 /
year). 1990-2023 Emissions have changed by -63.6% (-1479.32 Gg CO2 / year). For 2023
the changes per gas
are:

For 1990-2023 the changes per gas are: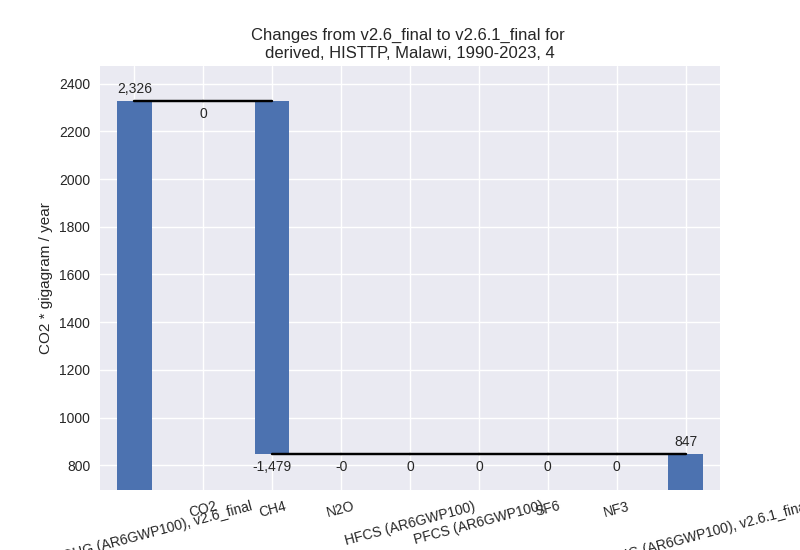
- 5: Total sectoral emissions in 2022 are 143.81 Gg
CO2 / year which is 0.9% of M.0.EL emissions. 2023 Emissions have
changed by -5.9% (-8.18 Gg CO2 /
year). 1990-2023 Emissions have changed by 9.9% (11.56 Gg CO2 / year). For 2023 the
changes per gas
are:
For 1990-2023 the changes per gas are: