Changes in PRIMAP-hist v2.6.1_final compared to v2.6_final for Nicaragua
2025-03-19
Johannes Gütschow
Change analysis for Nicaragua for PRIMAP-hist v2.6.1_final compared to v2.6_final
Overview over emissions by sector and gas
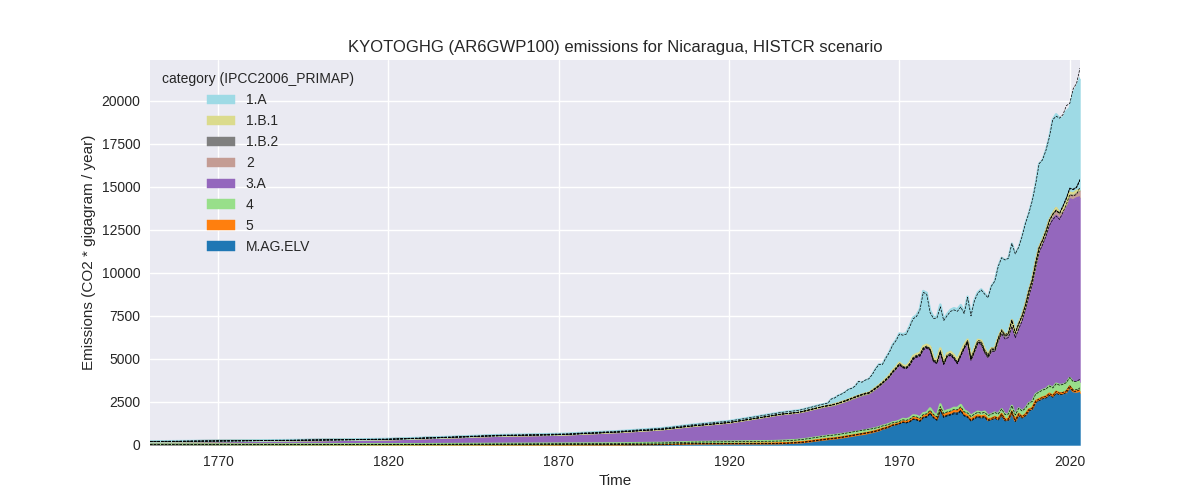
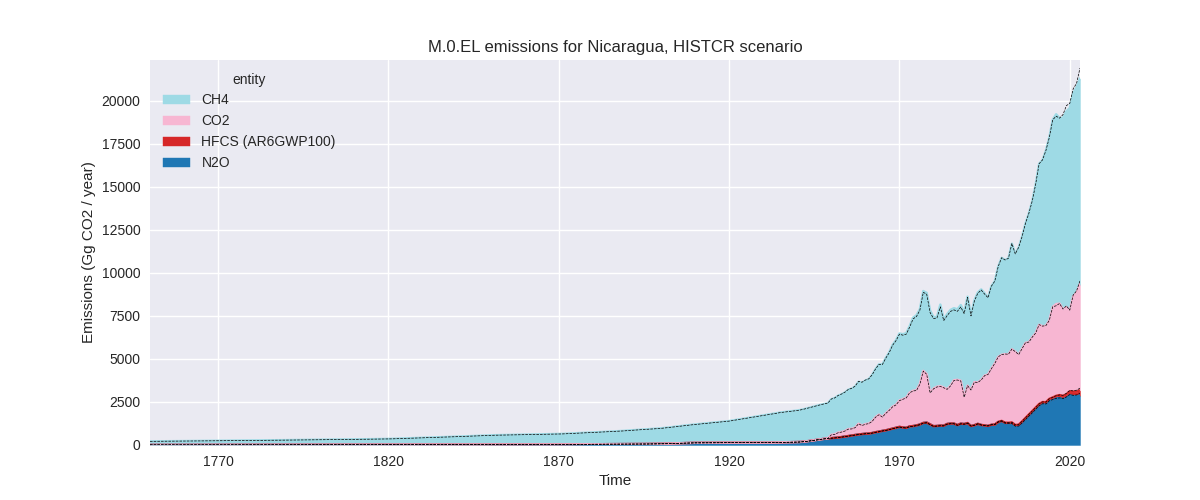
The following figures show the aggregate national total emissions excluding LULUCF AR6GWP100 for the country reported priority scenario. The dotted linesshow the v2.6_final data.
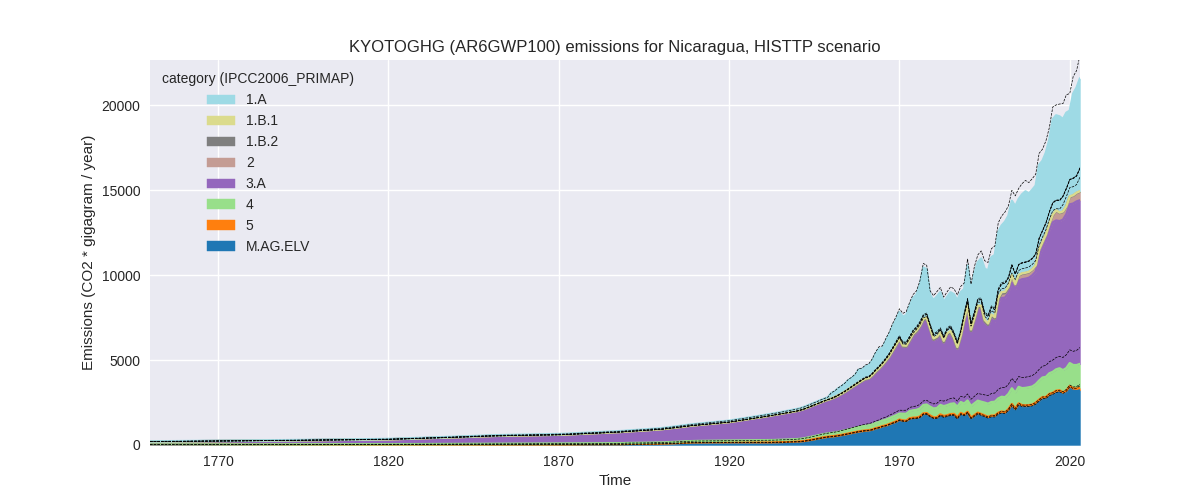
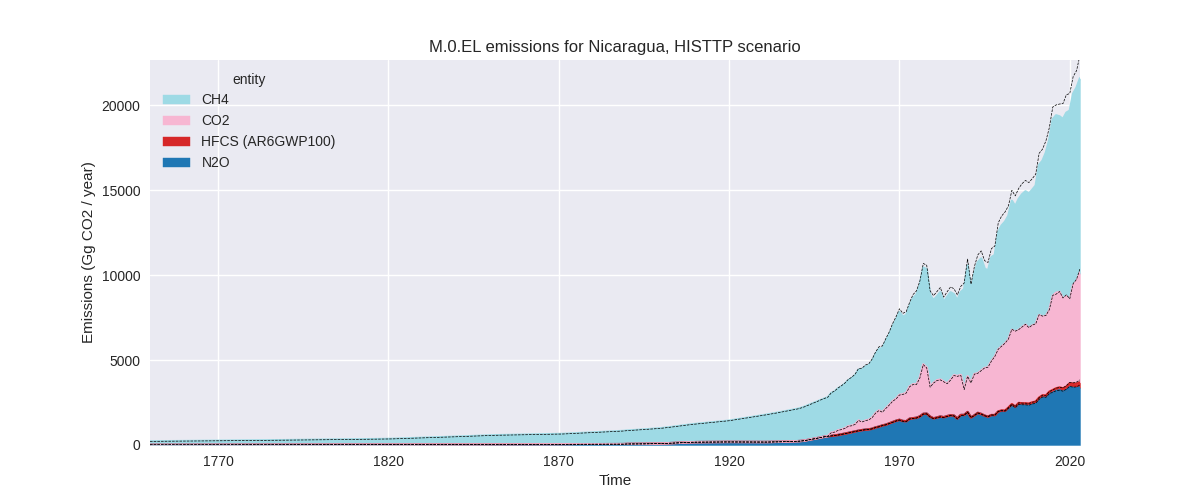
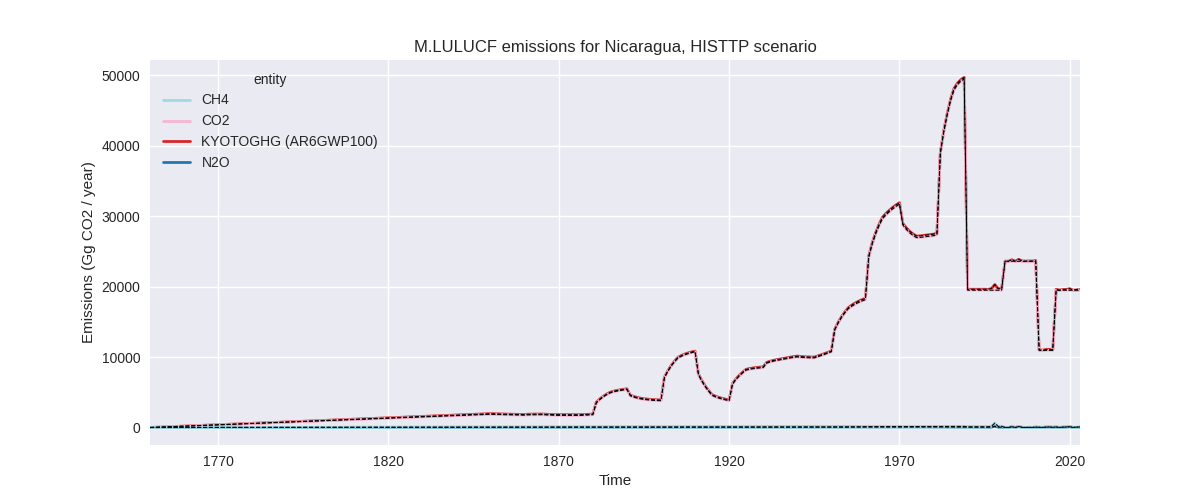
The following figures show the aggregate national total emissions excluding LULUCF AR6GWP100 for the third party priority scenario. The dotted linesshow the v2.6_final data.
Overview over changes
In the country reported priority scenario we have the following changes for aggregate Kyoto GHG and national total emissions excluding LULUCF (M.0.EL):
- Emissions in 2023 have changed by -2.7%% (-598.25 Gg CO2 / year)
- Emissions in 1990-2023 have changed by -0.4%% (-48.97 Gg CO2 / year)
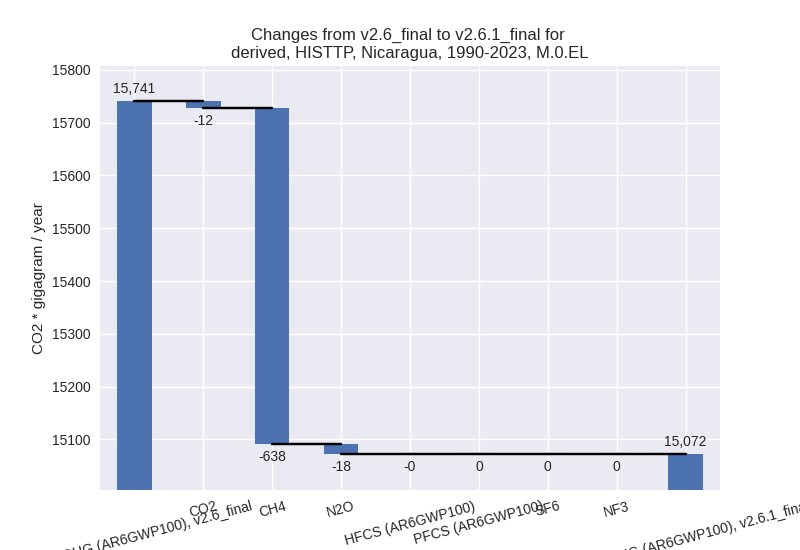
In the third party priority scenario we have the following changes for aggregate Kyoto GHG and national total emissions excluding LULUCF (M.0.EL):
- Emissions in 2023 have changed by -6.0%% (-1382.32 Gg CO2 / year)
- Emissions in 1990-2023 have changed by -4.2%% (-668.62 Gg CO2 / year)
Most important changes per scenario and time frame
In the country reported priority scenario the following sector-gas combinations have the highest absolute impact on national total KyotoGHG (AR6GWP100) emissions in 2023 (top 5):
- 1: 3.A, CH4 with -455.30 Gg CO2 / year (-4.1%)
- 2: M.AG.ELV, N2O with -174.07 Gg CO2 / year (-6.3%)
- 3: M.AG.ELV, CO2 with -45.97 Gg CO2 / year (-31.5%)
- 4: 5, N2O with 42.18 Gg CO2 / year (48.9%)
- 5: 4, CH4 with 21.00 Gg CO2 / year (4.2%)
In the country reported priority scenario the following sector-gas combinations have the highest absolute impact on national total KyotoGHG (AR6GWP100) emissions in 1990-2023 (top 5):
- 1: 3.A, CH4 with -44.46 Gg CO2 / year (-0.7%)
- 2: M.AG.ELV, N2O with -12.03 Gg CO2 / year (-0.8%)
- 3: M.AG.ELV, CH4 with 6.37 Gg CO2 / year (1.2%)
- 4: 5, N2O with -6.28 Gg CO2 / year (-7.4%)
- 5: 4, CH4 with 5.87 Gg CO2 / year (1.8%)
In the third party priority scenario the following sector-gas combinations have the highest absolute impact on national total KyotoGHG (AR6GWP100) emissions in 2023 (top 5):
- 1: 4, CH4 with -753.87 Gg CO2 / year (-36.1%)
- 2: 3.A, CH4 with -407.94 Gg CO2 / year (-4.1%)
- 3: M.AG.ELV, N2O with -201.21 Gg CO2 / year (-6.3%)
- 4: M.AG.ELV, CO2 with -62.52 Gg CO2 / year (-31.5%)
- 5: 5, N2O with 42.18 Gg CO2 / year (48.9%)
In the third party priority scenario the following sector-gas combinations have the highest absolute impact on national total KyotoGHG (AR6GWP100) emissions in 1990-2023 (top 5):
- 1: 4, CH4 with -598.66 Gg CO2 / year (-38.2%)
- 2: 3.A, CH4 with -39.84 Gg CO2 / year (-0.6%)
- 3: M.AG.ELV, N2O with -13.55 Gg CO2 / year (-0.6%)
- 4: 2, CO2 with -13.25 Gg CO2 / year (-5.8%)
- 5: 5, N2O with -6.28 Gg CO2 / year (-7.4%)
Notes on data changes
Here we list notes explaining important emissions changes for the country.
- No new country reported data has been included. Country reported data covers only 2000, 2005, and 2010 thus the third party data has a high influence on the CR time-series. CR time-series changes are mostly in the agricultural sector and come from updates to FAO and EDGAR (CO2 in M.AG.ELV) data for the latest years. Changes in sector 5 come directly from EDGAR as there is no country reported data available. Changes in cumulative emissions are very small (with the exception of sector 5).
- Changes in the TP scenario are mostly for the same sectors, but with the addition of much lower waste CH4 emissions which come directly from EDGAR and are the cause for the higher changes in total emissions in the TP scenario.
Changes by sector and gas
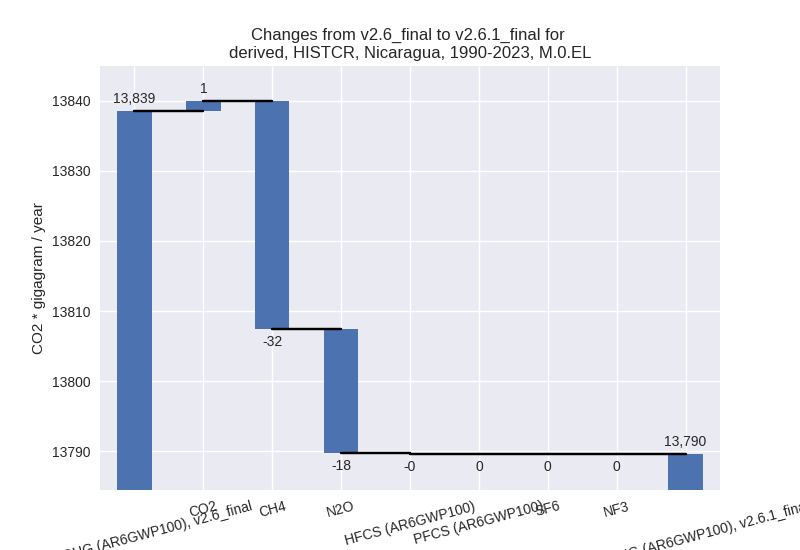
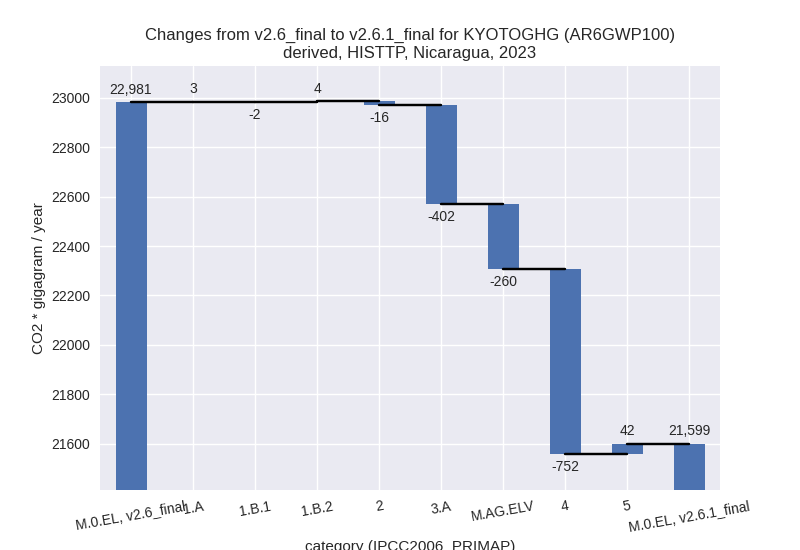
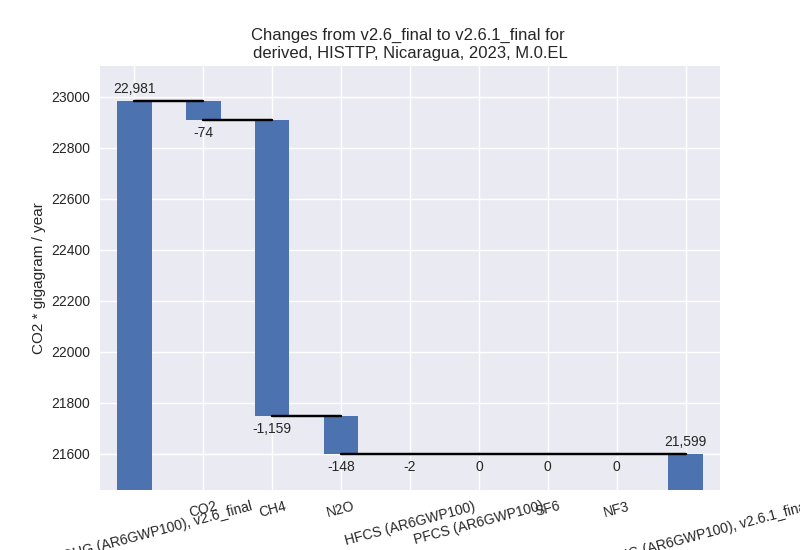
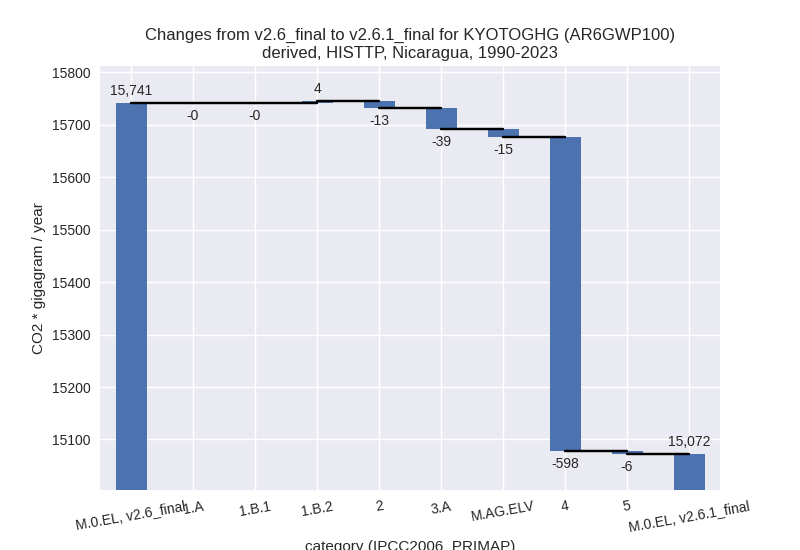
For each scenario and time frame the changes are displayed for all individual sectors and all individual gases. In the sector plot we use aggregate Kyoto GHGs in AR6GWP100. In the gas plot we usenational total emissions without LULUCF.
country reported scenario
2023

1990-2023
third party scenario
2023
1990-2023
Detailed changes for the scenarios:
country reported scenario (HISTCR):
Most important changes per time frame
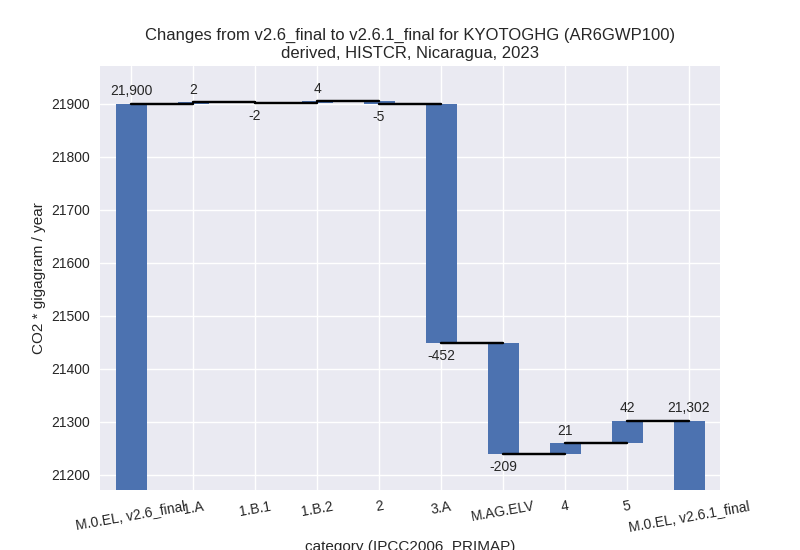
For 2023 the following sector-gas combinations have the highest absolute impact on national total KyotoGHG (AR6GWP100) emissions in 2023 (top 5):
- 1: 3.A, CH4 with -455.30 Gg CO2 / year (-4.1%)
- 2: M.AG.ELV, N2O with -174.07 Gg CO2 / year (-6.3%)
- 3: M.AG.ELV, CO2 with -45.97 Gg CO2 / year (-31.5%)
- 4: 5, N2O with 42.18 Gg CO2 / year (48.9%)
- 5: 4, CH4 with 21.00 Gg CO2 / year (4.2%)
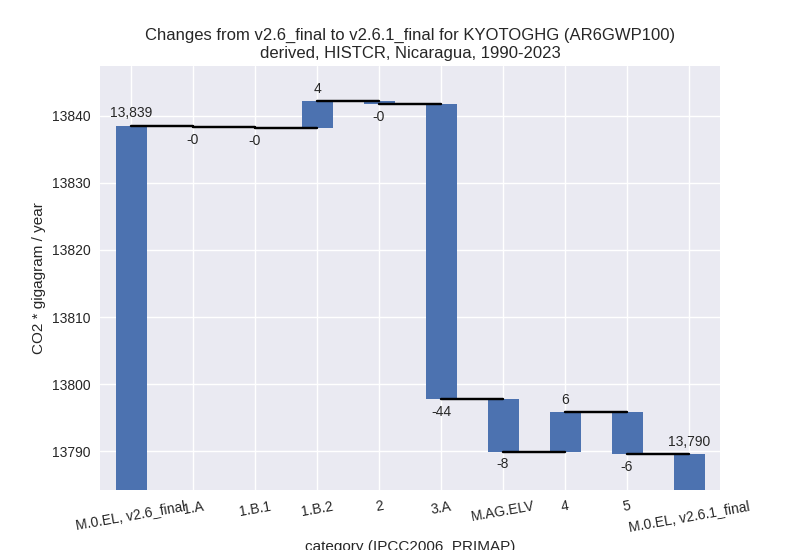
For 1990-2023 the following sector-gas combinations have the highest absolute impact on national total KyotoGHG (AR6GWP100) emissions in 1990-2023 (top 5):
- 1: 3.A, CH4 with -44.46 Gg CO2 / year (-0.7%)
- 2: M.AG.ELV, N2O with -12.03 Gg CO2 / year (-0.8%)
- 3: M.AG.ELV, CH4 with 6.37 Gg CO2 / year (1.2%)
- 4: 5, N2O with -6.28 Gg CO2 / year (-7.4%)
- 5: 4, CH4 with 5.87 Gg CO2 / year (1.8%)
Changes in the main sectors for aggregate KyotoGHG (AR6GWP100) are
- 1: Total sectoral emissions in 2022 are 6057.55 Gg CO2 / year which is 29.2% of M.0.EL emissions. 2023 Emissions have changed by 0.1% (4.31 Gg CO2 / year). 1990-2023 Emissions have changed by 0.1% (3.64 Gg CO2 / year).
- 2: Total sectoral emissions in 2022 are 392.36 Gg CO2 / year which is 1.9% of M.0.EL emissions. 2023 Emissions have changed by -1.1% (-4.70 Gg CO2 / year). 1990-2023 Emissions have changed by -0.2% (-0.45 Gg CO2 / year).
- M.AG: Total sectoral emissions in 2022 are 13729.93
Gg CO2 / year which is 66.1% of M.0.EL emissions. 2023 Emissions have
changed by -4.6% (-661.14 Gg CO2 /
year). 1990-2023 Emissions have changed by -0.6% (-51.76 Gg CO2 / year). For 2023 the
changes per gas
are:
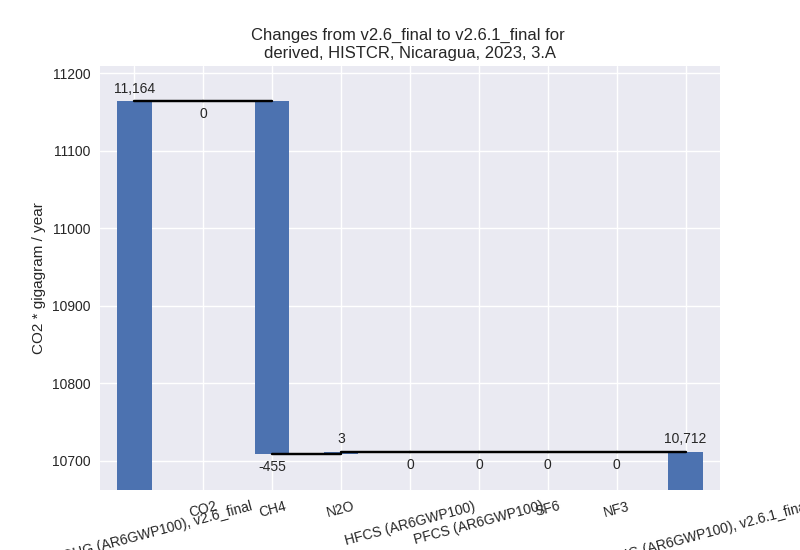
The changes come from the following subsectors:- 3.A: Total sectoral emissions in 2022 are 10711.30
Gg CO2 / year which is 78.0% of category M.AG emissions. 2023 Emissions
have changed by -4.0% (-451.98 Gg
CO2 / year). 1990-2023 Emissions have changed by -0.7% (-43.94 Gg CO2 / year). For 2023 the
changes per gas
are:
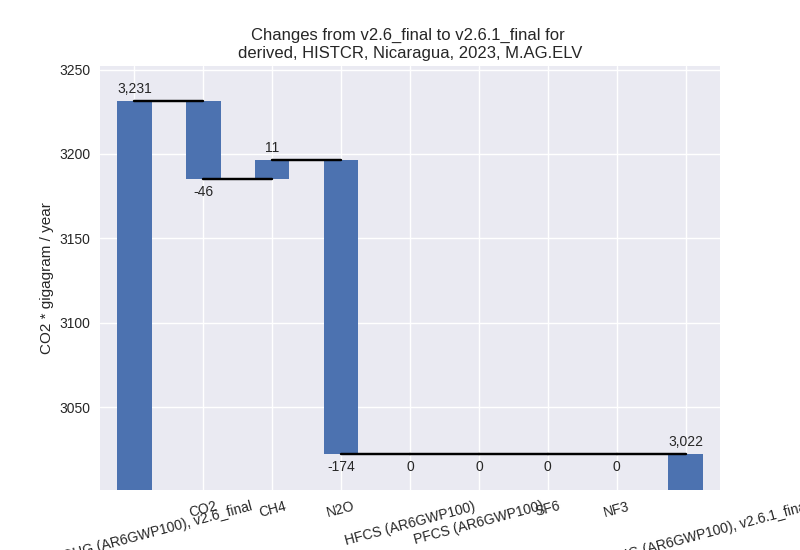
There is no subsector information available in PRIMAP-hist. - M.AG.ELV: Total sectoral emissions in 2022 are
3018.63 Gg CO2 / year which is 22.0% of category M.AG emissions. 2023
Emissions have changed by -6.5%
(-209.15 Gg CO2 / year). 1990-2023 Emissions have changed by -0.4% (-7.81 Gg CO2 / year). For 2023 the
changes per gas
are:
There is no subsector information available in PRIMAP-hist.
- 3.A: Total sectoral emissions in 2022 are 10711.30
Gg CO2 / year which is 78.0% of category M.AG emissions. 2023 Emissions
have changed by -4.0% (-451.98 Gg
CO2 / year). 1990-2023 Emissions have changed by -0.7% (-43.94 Gg CO2 / year). For 2023 the
changes per gas
are:
- 4: Total sectoral emissions in 2022 are 514.38 Gg
CO2 / year which is 2.5% of M.0.EL emissions. 2023 Emissions have
changed by 4.2% (21.10 Gg CO2 /
year). 1990-2023 Emissions have changed by 1.7% (5.88 Gg CO2 / year). For 2023 the
changes per gas
are:
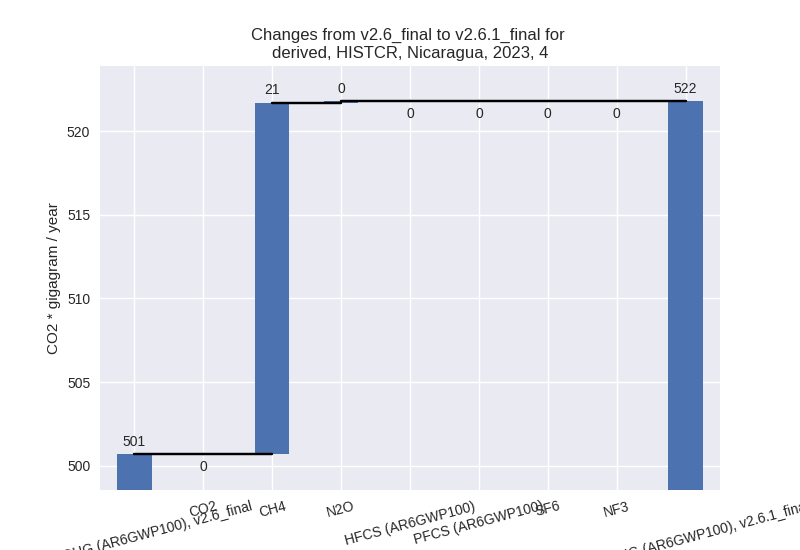
- 5: Total sectoral emissions in 2022 are 82.91 Gg
CO2 / year which is 0.4% of M.0.EL emissions. 2023 Emissions have
changed by 48.9% (42.18 Gg CO2 /
year). 1990-2023 Emissions have changed by -7.4% (-6.28 Gg CO2 / year). For 2023 the
changes per gas
are:

For 1990-2023 the changes per gas are: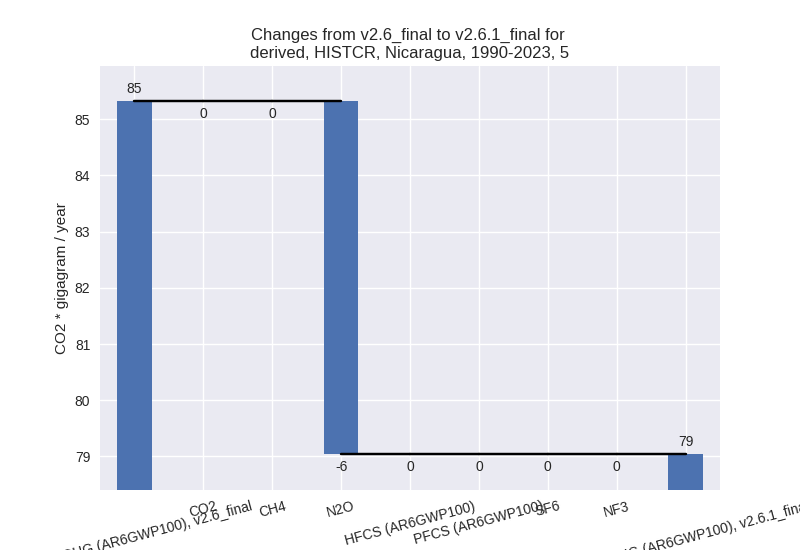
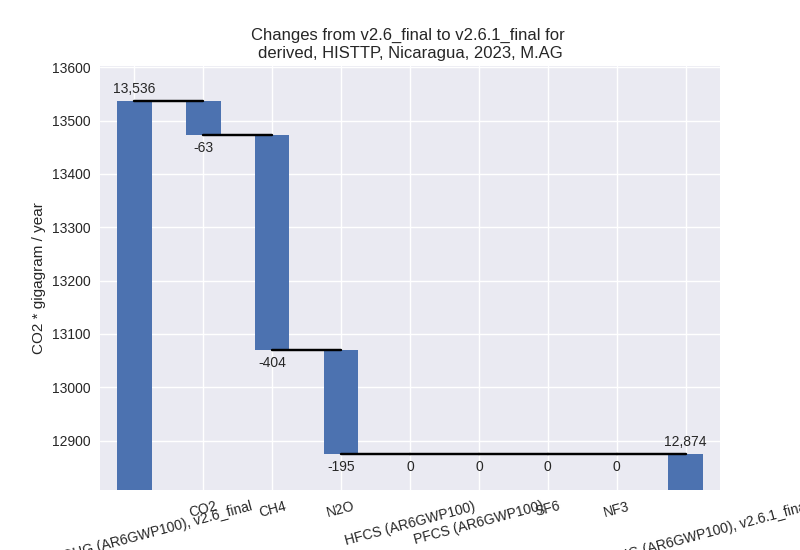
third party scenario (HISTTP):
Most important changes per time frame
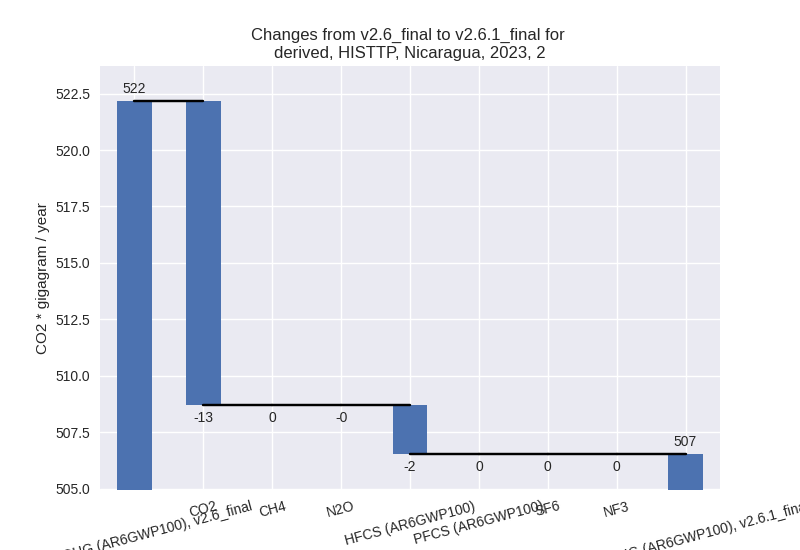
For 2023 the following sector-gas combinations have the highest absolute impact on national total KyotoGHG (AR6GWP100) emissions in 2023 (top 5):
- 1: 4, CH4 with -753.87 Gg CO2 / year (-36.1%)
- 2: 3.A, CH4 with -407.94 Gg CO2 / year (-4.1%)
- 3: M.AG.ELV, N2O with -201.21 Gg CO2 / year (-6.3%)
- 4: M.AG.ELV, CO2 with -62.52 Gg CO2 / year (-31.5%)
- 5: 5, N2O with 42.18 Gg CO2 / year (48.9%)
For 1990-2023 the following sector-gas combinations have the highest absolute impact on national total KyotoGHG (AR6GWP100) emissions in 1990-2023 (top 5):
- 1: 4, CH4 with -598.66 Gg CO2 / year (-38.2%)
- 2: 3.A, CH4 with -39.84 Gg CO2 / year (-0.6%)
- 3: M.AG.ELV, N2O with -13.55 Gg CO2 / year (-0.6%)
- 4: 2, CO2 with -13.25 Gg CO2 / year (-5.8%)
- 5: 5, N2O with -6.28 Gg CO2 / year (-7.4%)
Changes in the main sectors for aggregate KyotoGHG (AR6GWP100) are
- 1: Total sectoral emissions in 2022 are 6219.31 Gg CO2 / year which is 29.5% of M.0.EL emissions. 2023 Emissions have changed by 0.1% (4.85 Gg CO2 / year). 1990-2023 Emissions have changed by 0.1% (3.81 Gg CO2 / year).
- 2: Total sectoral emissions in 2022 are 486.20 Gg
CO2 / year which is 2.3% of M.0.EL emissions. 2023 Emissions have
changed by -3.0% (-15.64 Gg CO2 /
year). 1990-2023 Emissions have changed by -4.1% (-13.40 Gg CO2 / year). For 2023 the
changes per gas
are:
For 1990-2023 the changes per gas are: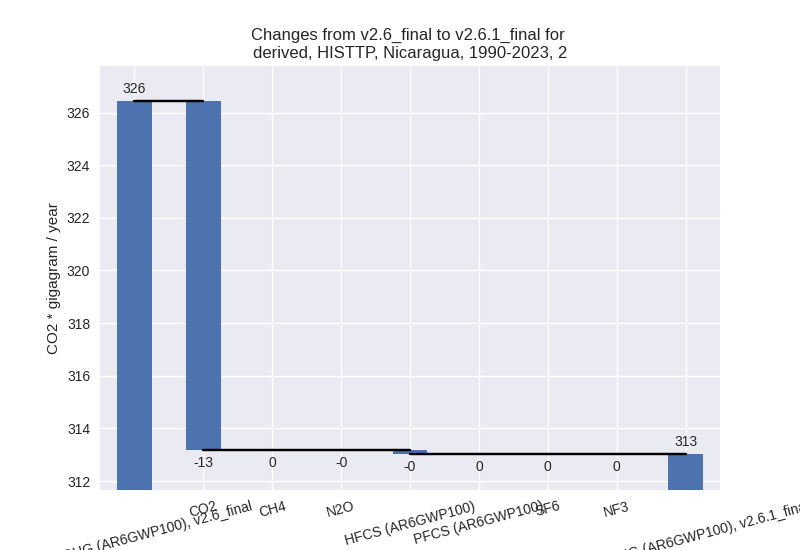
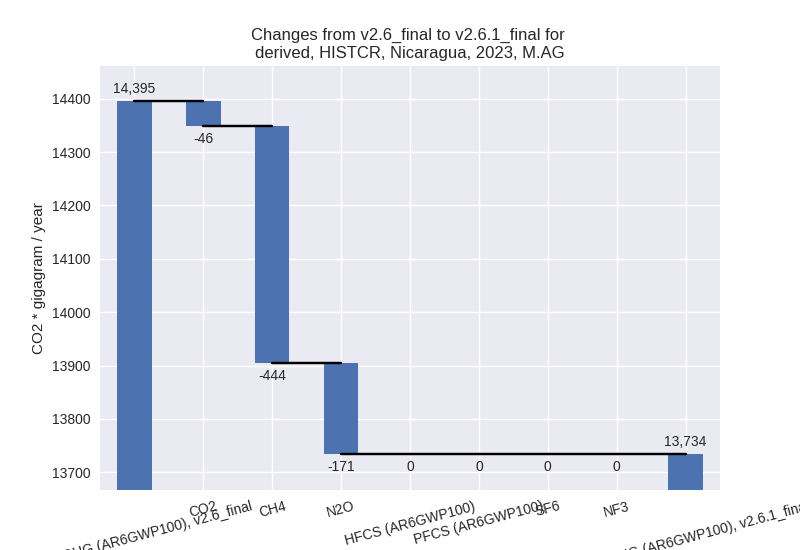
- M.AG: Total sectoral emissions in 2022 are 12870.28
Gg CO2 / year which is 61.1% of M.0.EL emissions. 2023 Emissions have
changed by -4.9% (-661.85 Gg CO2 /
year). 1990-2023 Emissions have changed by -0.6% (-54.33 Gg CO2 / year). For 2023 the
changes per gas
are:
The changes come from the following subsectors:- 3.A: Total sectoral emissions in 2022 are 9639.87
Gg CO2 / year which is 74.9% of category M.AG emissions. 2023 Emissions
have changed by -4.0% (-401.67 Gg
CO2 / year). 1990-2023 Emissions have changed by -0.6% (-38.86 Gg CO2 / year). For 2023 the
changes per gas
are:

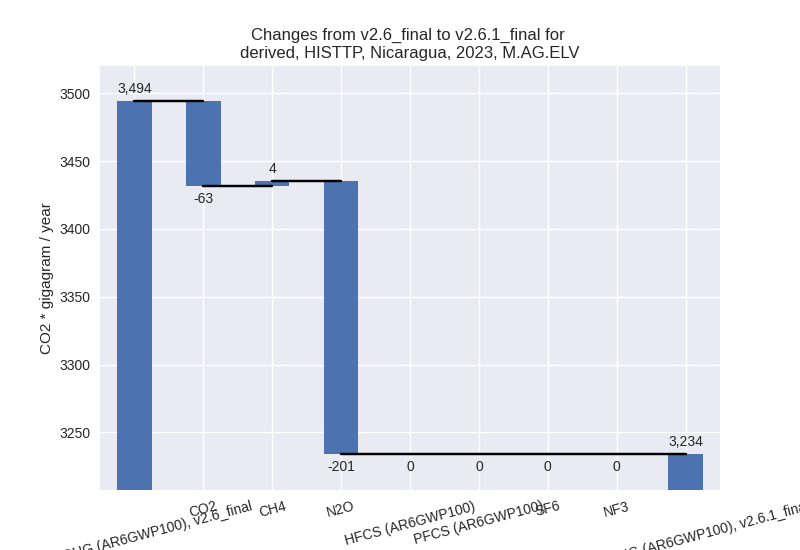
There is no subsector information available in PRIMAP-hist. - M.AG.ELV: Total sectoral emissions in 2022 are
3230.41 Gg CO2 / year which is 25.1% of category M.AG emissions. 2023
Emissions have changed by -7.4%
(-260.17 Gg CO2 / year). 1990-2023 Emissions have changed by -0.6% (-15.47 Gg CO2 / year). For 2023 the
changes per gas
are:
There is no subsector information available in PRIMAP-hist.
- 3.A: Total sectoral emissions in 2022 are 9639.87
Gg CO2 / year which is 74.9% of category M.AG emissions. 2023 Emissions
have changed by -4.0% (-401.67 Gg
CO2 / year). 1990-2023 Emissions have changed by -0.6% (-38.86 Gg CO2 / year). For 2023 the
changes per gas
are:
- 4: Total sectoral emissions in 2022 are 1391.22 Gg
CO2 / year which is 6.6% of M.0.EL emissions. 2023 Emissions have
changed by -34.8% (-751.87 Gg CO2 /
year). 1990-2023 Emissions have changed by -36.9% (-598.42 Gg CO2 / year). For 2023
the changes per gas
are:

For 1990-2023 the changes per gas are:
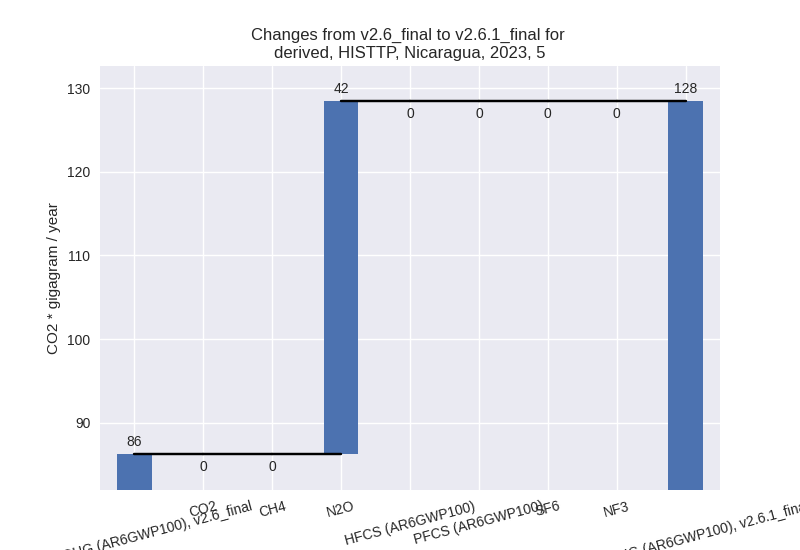
- 5: Total sectoral emissions in 2022 are 82.91 Gg
CO2 / year which is 0.4% of M.0.EL emissions. 2023 Emissions have
changed by 48.9% (42.18 Gg CO2 /
year). 1990-2023 Emissions have changed by -7.4% (-6.28 Gg CO2 / year). For 2023 the
changes per gas
are:
For 1990-2023 the changes per gas are: