Changes in PRIMAP-hist v2.6.1_final compared to v2.6_final for Netherlands
2025-03-19
Johannes Gütschow
Change analysis for Netherlands for PRIMAP-hist v2.6.1_final compared to v2.6_final
Overview over emissions by sector and gas
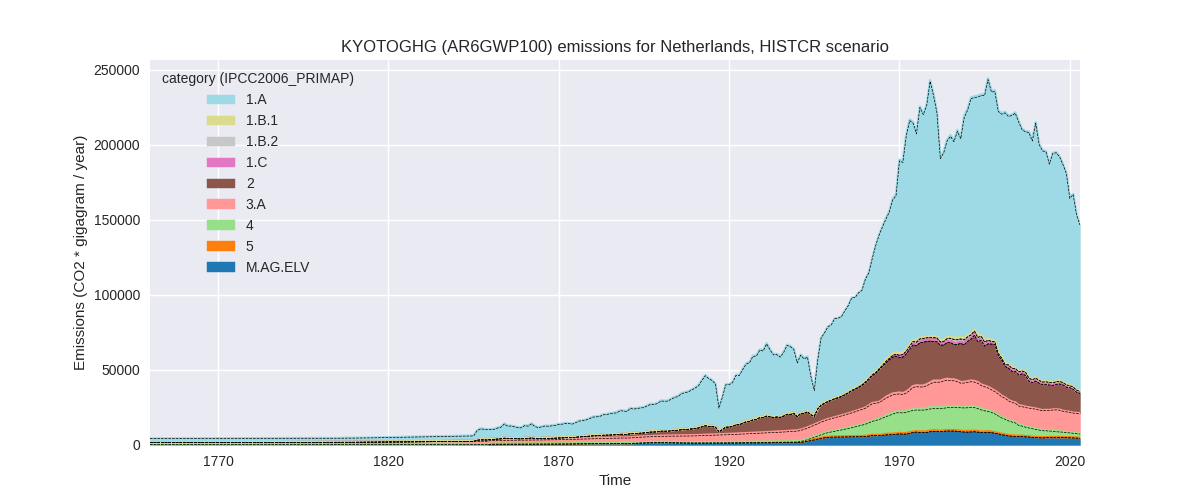
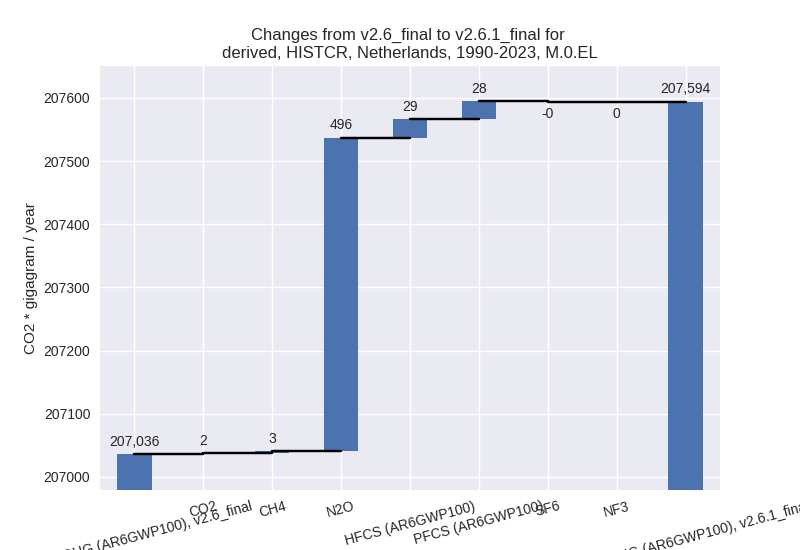
The following figures show the aggregate national total emissions excluding LULUCF AR6GWP100 for the country reported priority scenario. The dotted linesshow the v2.6_final data.

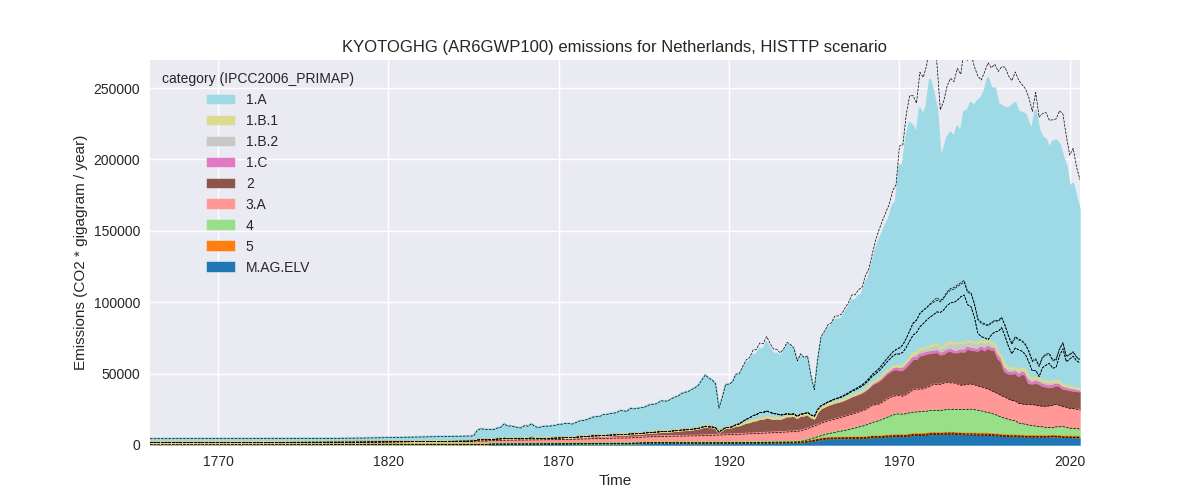
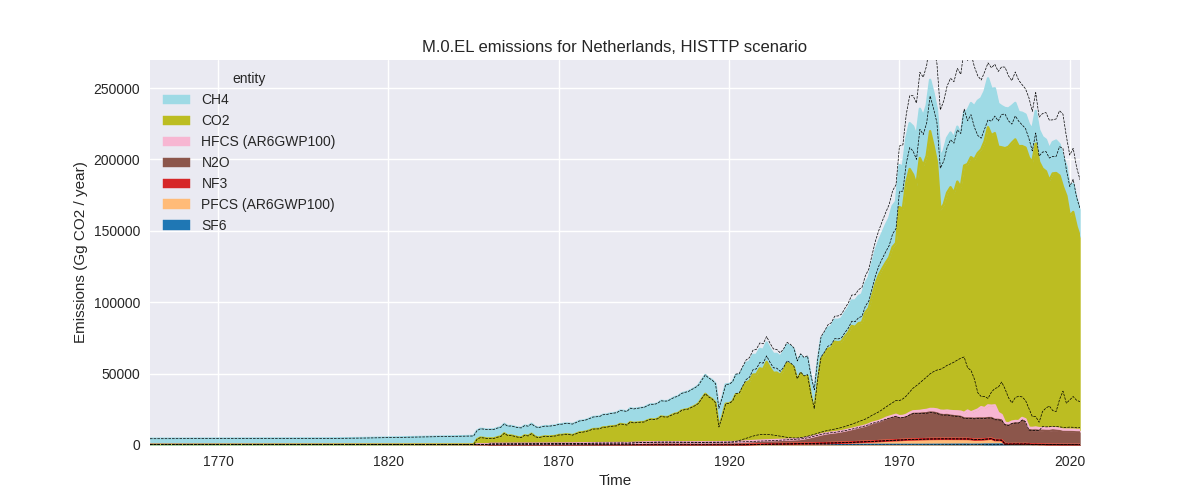
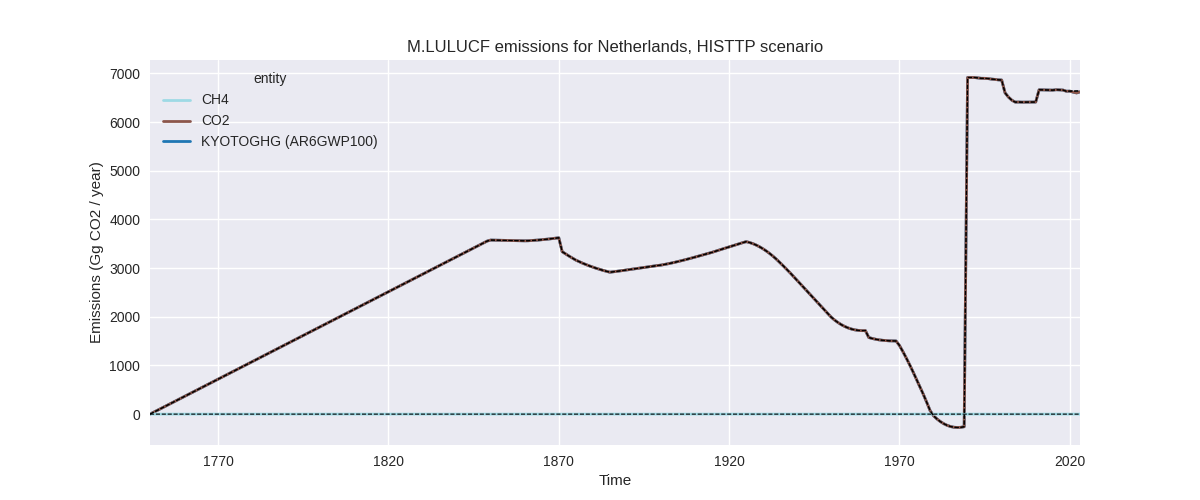
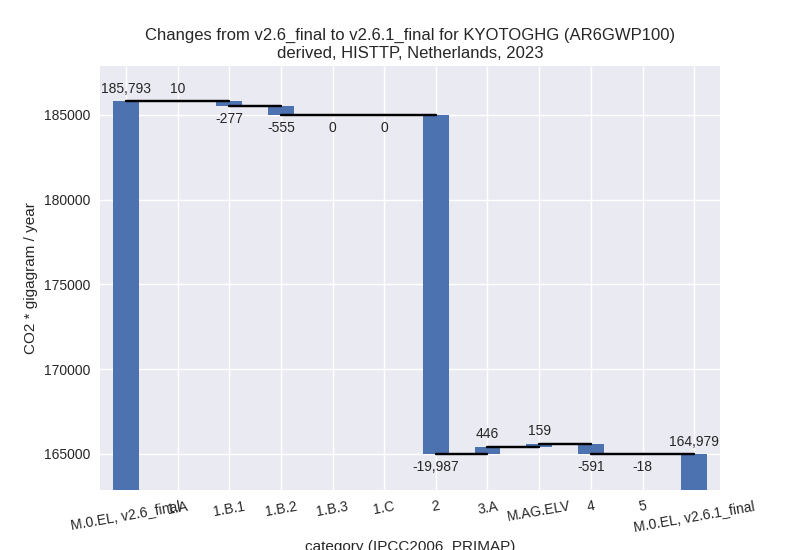
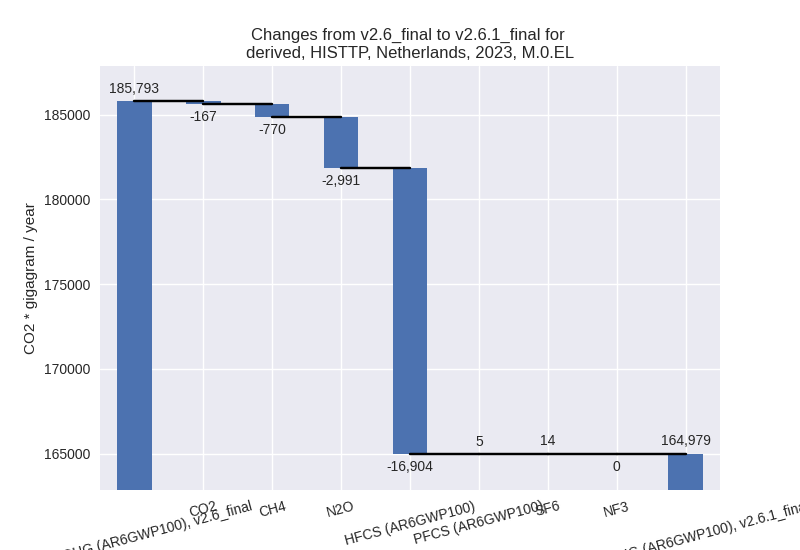
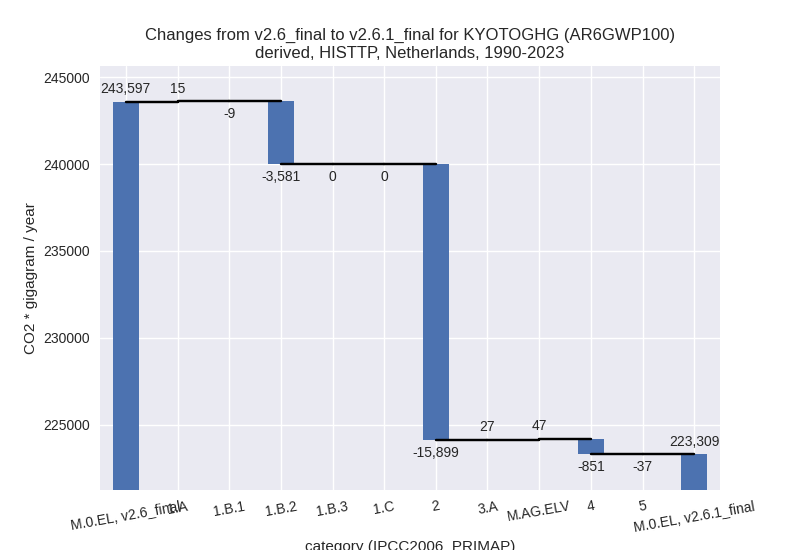
The following figures show the aggregate national total emissions excluding LULUCF AR6GWP100 for the third party priority scenario. The dotted linesshow the v2.6_final data.
Overview over changes
In the country reported priority scenario we have the following changes for aggregate Kyoto GHG and national total emissions excluding LULUCF (M.0.EL):
- Emissions in 2023 have changed by 0.4%% (530.96 Gg CO2 / year)
- Emissions in 1990-2023 have changed by 0.3%% (558.45 Gg CO2 / year)
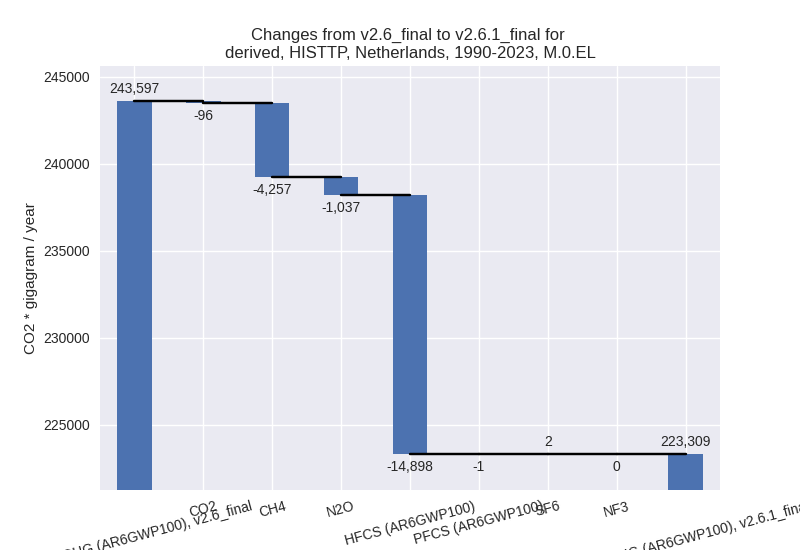
In the third party priority scenario we have the following changes for aggregate Kyoto GHG and national total emissions excluding LULUCF (M.0.EL):
- Emissions in 2023 have changed by -11.2%% (-20813.46 Gg CO2 / year)
- Emissions in 1990-2023 have changed by -8.3%% (-20287.43 Gg CO2 / year)
Most important changes per scenario and time frame
In the country reported priority scenario the following sector-gas combinations have the highest absolute impact on national total KyotoGHG (AR6GWP100) emissions in 2023 (top 5):
- 1: 5, N2O with 223.77 Gg CO2 / year (inf%)
- 2: 1.A, CH4 with -197.06 Gg CO2 / year (-11.1%)
- 3: 3.A, CH4 with 170.74 Gg CO2 / year (1.3%)
- 4: 4, CH4 with 83.30 Gg CO2 / year (3.8%)
- 5: 2, CO2 with 73.76 Gg CO2 / year (0.6%)
In the country reported priority scenario the following sector-gas combinations have the highest absolute impact on national total KyotoGHG (AR6GWP100) emissions in 1990-2023 (top 5):
- 1: 5, N2O with 492.85 Gg CO2 / year (inf%)
- 2: 2, HFCS (AR6GWP100) with 29.24 Gg CO2 / year (0.8%)
- 3: 2, PFCS (AR6GWP100) with 28.42 Gg CO2 / year (2.8%)
- 4: 3.A, CH4 with 6.66 Gg CO2 / year (0.0%)
- 5: 1.A, CH4 with -5.80 Gg CO2 / year (-0.4%)
In the third party priority scenario the following sector-gas combinations have the highest absolute impact on national total KyotoGHG (AR6GWP100) emissions in 2023 (top 5):
- 1: 2, HFCS (AR6GWP100) with -16903.69 Gg CO2 / year (-92.9%)
- 2: 2, N2O with -3021.37 Gg CO2 / year (-69.3%)
- 3: 4, CH4 with -614.30 Gg CO2 / year (-12.1%)
- 4: 1.B.2, CH4 with -555.09 Gg CO2 / year (-28.5%)
- 5: 3.A, CH4 with 410.97 Gg CO2 / year (3.3%)
In the third party priority scenario the following sector-gas combinations have the highest absolute impact on national total KyotoGHG (AR6GWP100) emissions in 1990-2023 (top 5):
- 1: 2, HFCS (AR6GWP100) with -14897.73 Gg CO2 / year (-82.3%)
- 2: 1.B.2, CH4 with -3440.40 Gg CO2 / year (-54.0%)
- 3: 2, N2O with -1008.61 Gg CO2 / year (-23.2%)
- 4: 4, CH4 with -852.10 Gg CO2 / year (-8.8%)
- 5: 1.B.2, CO2 with -141.59 Gg CO2 / year (-83.8%)
Notes on data changes
Here we list notes explaining important emissions changes for the country.
- CRT data has been included but replaces official data reported to
the EU which does not show noteworthy differences. Changes in the CR
time-series are small and come from updated third party data (EDGAR,
FAO) which is used to extrapolate the country reported data.
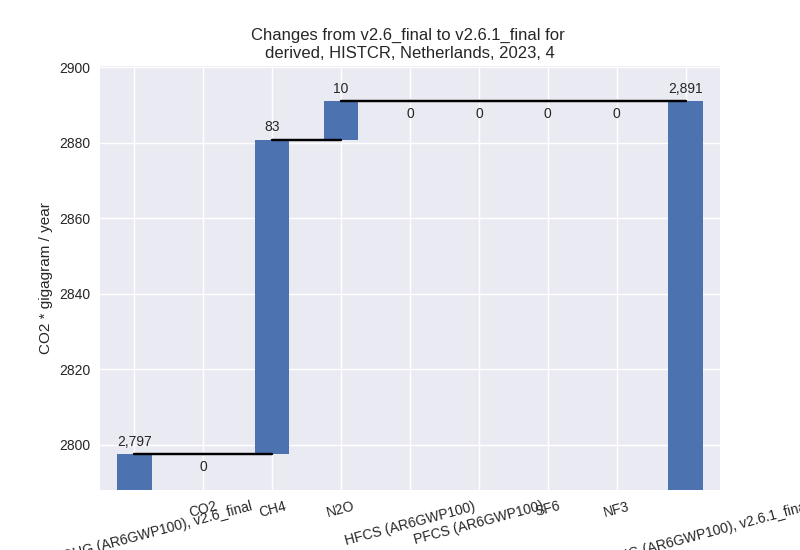
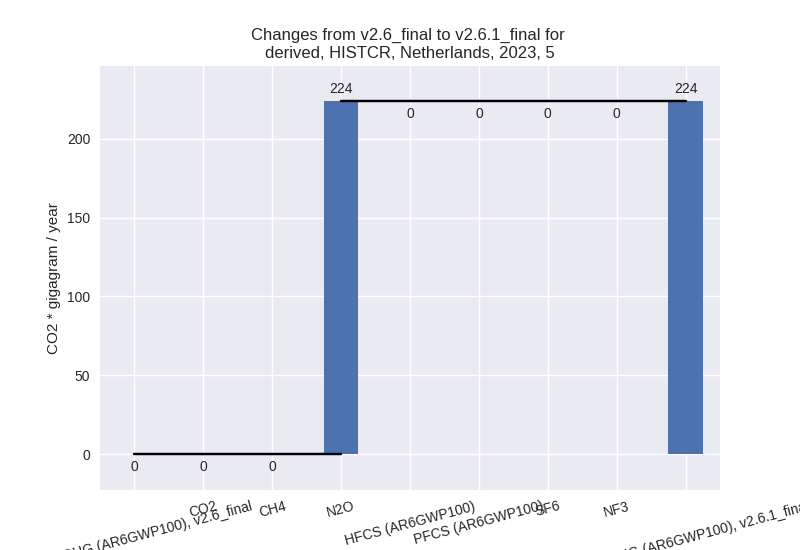
- Emissions in sector 5 are now non-zero because the CRT submissions leave the sector empty while in CRF data used before it was zero. As the sector is missing in country reported data it is filled from EDGAR data.
- Emissions in the TP time-series are much lower, mostly because the HFC emission in the new EDGAR data are 82% (cumulative) and 93% (2023) lower than in the previous version. Other sectors contributing to lower emissions are also based on EDGAR data.
Changes by sector and gas
For each scenario and time frame the changes are displayed for all individual sectors and all individual gases. In the sector plot we use aggregate Kyoto GHGs in AR6GWP100. In the gas plot we usenational total emissions without LULUCF.
country reported scenario
2023
1990-2023
third party scenario
2023
1990-2023
Detailed changes for the scenarios:
country reported scenario (HISTCR):
Most important changes per time frame
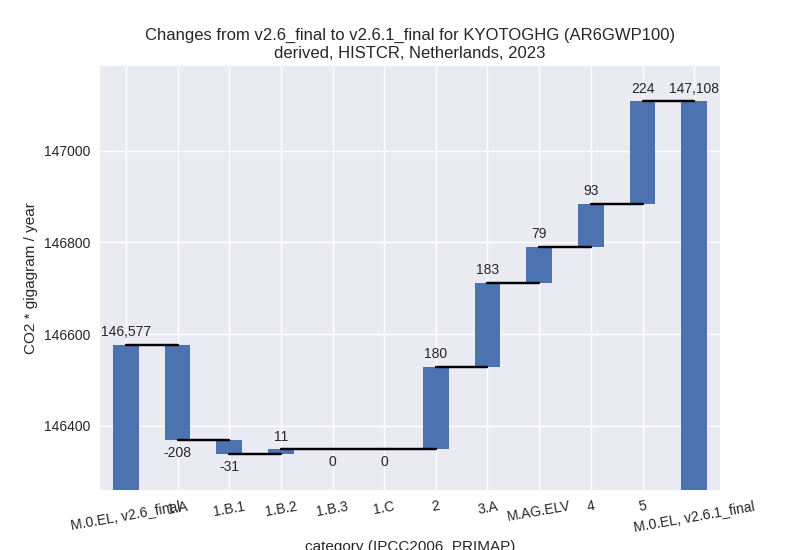
For 2023 the following sector-gas combinations have the highest absolute impact on national total KyotoGHG (AR6GWP100) emissions in 2023 (top 5):
- 1: 5, N2O with 223.77 Gg CO2 / year (inf%)
- 2: 1.A, CH4 with -197.06 Gg CO2 / year (-11.1%)
- 3: 3.A, CH4 with 170.74 Gg CO2 / year (1.3%)
- 4: 4, CH4 with 83.30 Gg CO2 / year (3.8%)
- 5: 2, CO2 with 73.76 Gg CO2 / year (0.6%)
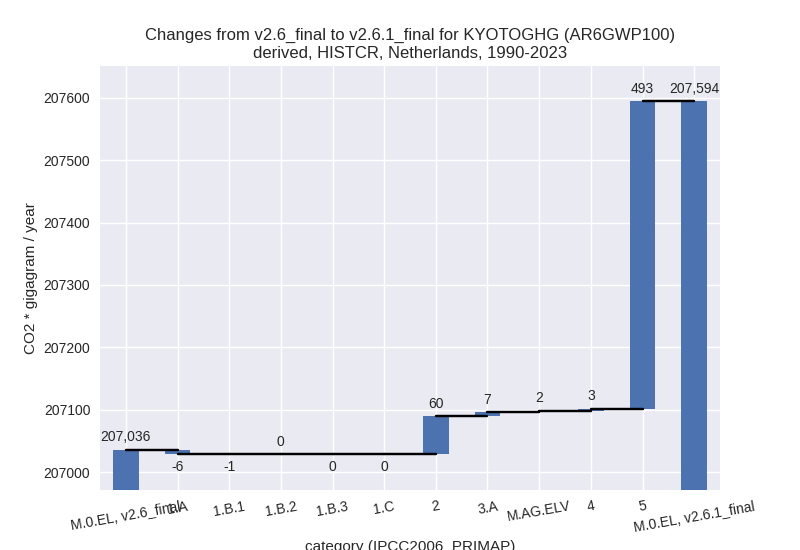
For 1990-2023 the following sector-gas combinations have the highest absolute impact on national total KyotoGHG (AR6GWP100) emissions in 1990-2023 (top 5):
- 1: 5, N2O with 492.85 Gg CO2 / year (inf%)
- 2: 2, HFCS (AR6GWP100) with 29.24 Gg CO2 / year (0.8%)
- 3: 2, PFCS (AR6GWP100) with 28.42 Gg CO2 / year (2.8%)
- 4: 3.A, CH4 with 6.66 Gg CO2 / year (0.0%)
- 5: 1.A, CH4 with -5.80 Gg CO2 / year (-0.4%)
Changes in the main sectors for aggregate KyotoGHG (AR6GWP100) are
- 1: Total sectoral emissions in 2022 are 118170.05 Gg CO2 / year which is 77.0% of M.0.EL emissions. 2023 Emissions have changed by -0.2% (-227.93 Gg CO2 / year). 1990-2023 Emissions have changed by -0.0% (-6.70 Gg CO2 / year).
- 2: Total sectoral emissions in 2022 are 14001.79 Gg CO2 / year which is 9.1% of M.0.EL emissions. 2023 Emissions have changed by 1.3% (180.17 Gg CO2 / year). 1990-2023 Emissions have changed by 0.3% (60.22 Gg CO2 / year).
- M.AG: Total sectoral emissions in 2022 are 18137.52 Gg CO2 / year which is 11.8% of M.0.EL emissions. 2023 Emissions have changed by 1.5% (261.45 Gg CO2 / year). 1990-2023 Emissions have changed by 0.0% (9.33 Gg CO2 / year).
- 4: Total sectoral emissions in 2022 are 2950.10 Gg
CO2 / year which is 1.9% of M.0.EL emissions. 2023 Emissions have
changed by 3.3% (93.50 Gg CO2 /
year). 1990-2023 Emissions have changed by 0.0% (2.75 Gg CO2 / year). For 2023 the
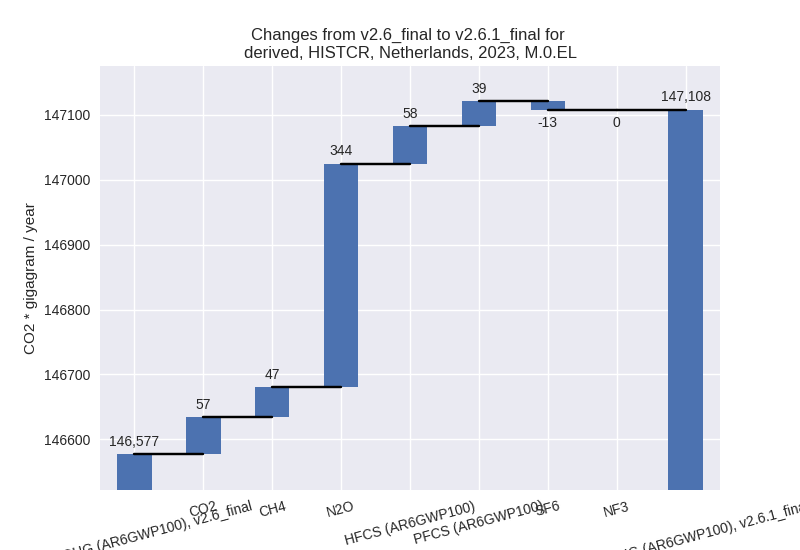
changes per gas
are:
- 5: Total sectoral emissions in 2022 are 235.82 Gg
CO2 / year which is 0.2% of M.0.EL emissions. 2023 Emissions have
changed by inf% (223.77 Gg CO2 /
year). 1990-2023 Emissions have changed by inf% (492.85 Gg CO2 / year). For 2023 the
changes per gas
are:
For 1990-2023 the changes per gas are: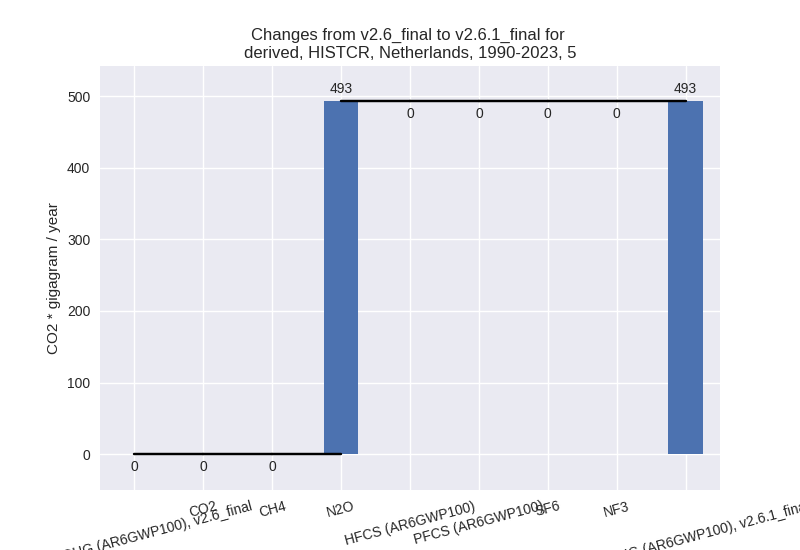
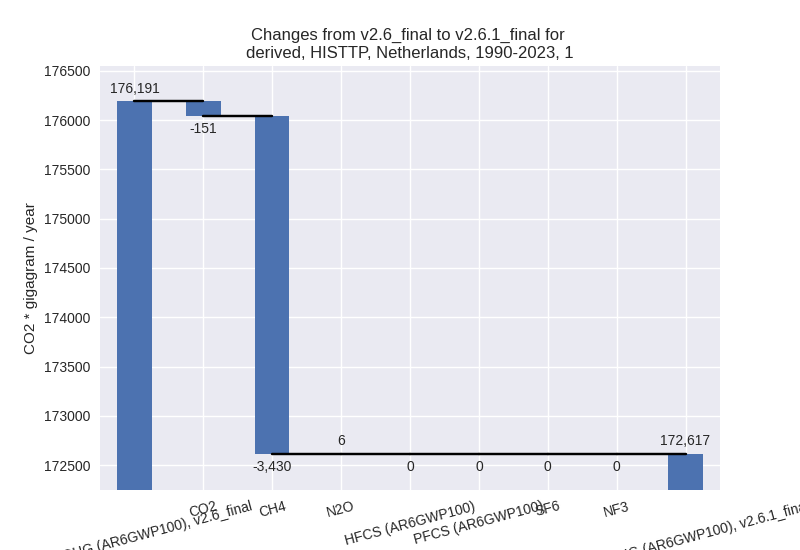
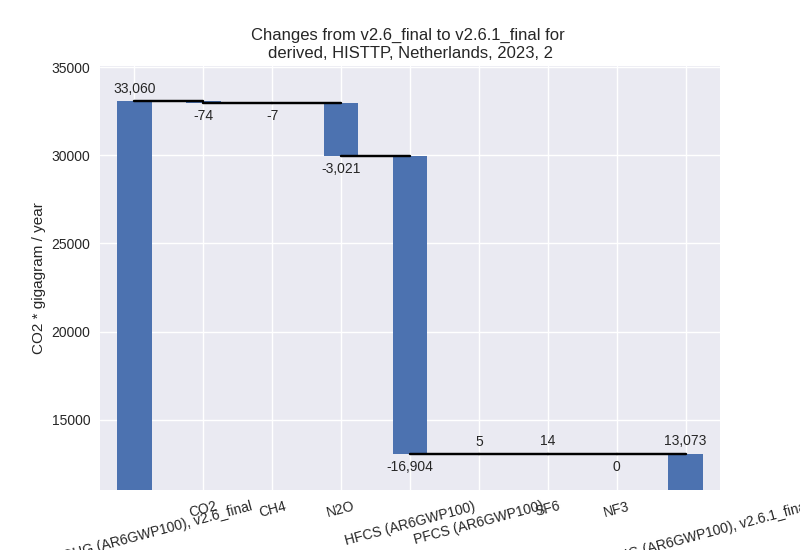
third party scenario (HISTTP):
Most important changes per time frame
For 2023 the following sector-gas combinations have the highest absolute impact on national total KyotoGHG (AR6GWP100) emissions in 2023 (top 5):
- 1: 2, HFCS (AR6GWP100) with -16903.69 Gg CO2 / year (-92.9%)
- 2: 2, N2O with -3021.37 Gg CO2 / year (-69.3%)
- 3: 4, CH4 with -614.30 Gg CO2 / year (-12.1%)
- 4: 1.B.2, CH4 with -555.09 Gg CO2 / year (-28.5%)
- 5: 3.A, CH4 with 410.97 Gg CO2 / year (3.3%)
For 1990-2023 the following sector-gas combinations have the highest absolute impact on national total KyotoGHG (AR6GWP100) emissions in 1990-2023 (top 5):
- 1: 2, HFCS (AR6GWP100) with -14897.73 Gg CO2 / year (-82.3%)
- 2: 1.B.2, CH4 with -3440.40 Gg CO2 / year (-54.0%)
- 3: 2, N2O with -1008.61 Gg CO2 / year (-23.2%)
- 4: 4, CH4 with -852.10 Gg CO2 / year (-8.8%)
- 5: 1.B.2, CO2 with -141.59 Gg CO2 / year (-83.8%)
Changes in the main sectors for aggregate KyotoGHG (AR6GWP100) are
- 1: Total sectoral emissions in 2022 are 134613.50
Gg CO2 / year which is 78.0% of M.0.EL emissions. 2023 Emissions have
changed by -0.6% (-821.48 Gg CO2 /
year). 1990-2023 Emissions have changed by -2.0% (-3574.49 Gg CO2 / year). For
1990-2023 the changes per gas
are:
The changes come from the following subsectors:- 1.A: Total sectoral emissions in 2022 are 132843.58 Gg CO2 / year which is 98.7% of category 1 emissions. 2023 Emissions have changed by 0.0% (10.12 Gg CO2 / year). 1990-2023 Emissions have changed by 0.0% (15.46 Gg CO2 / year).
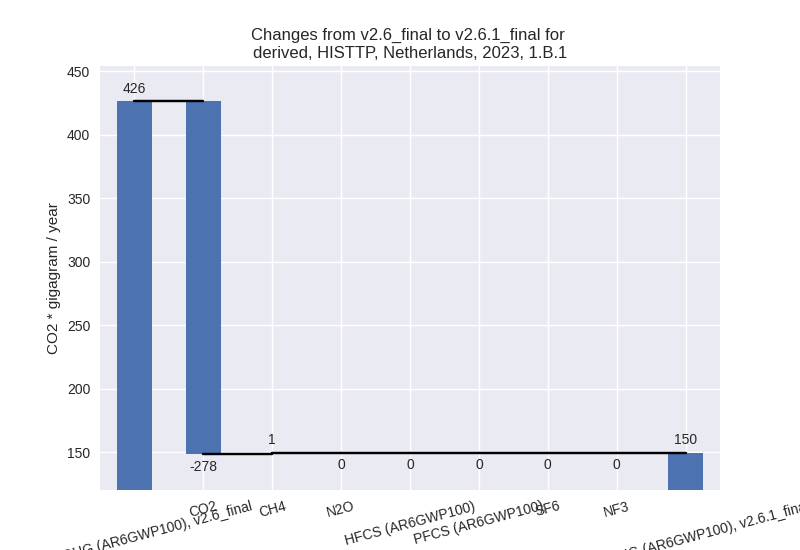
- 1.B.1: Total sectoral emissions in 2022 are 221.01
Gg CO2 / year which is 0.2% of category 1 emissions. 2023 Emissions have
changed by -64.9% (-276.71 Gg CO2 /
year). 1990-2023 Emissions have changed by -1.3% (-9.00 Gg CO2 / year). For 2023 the
changes per gas
are:
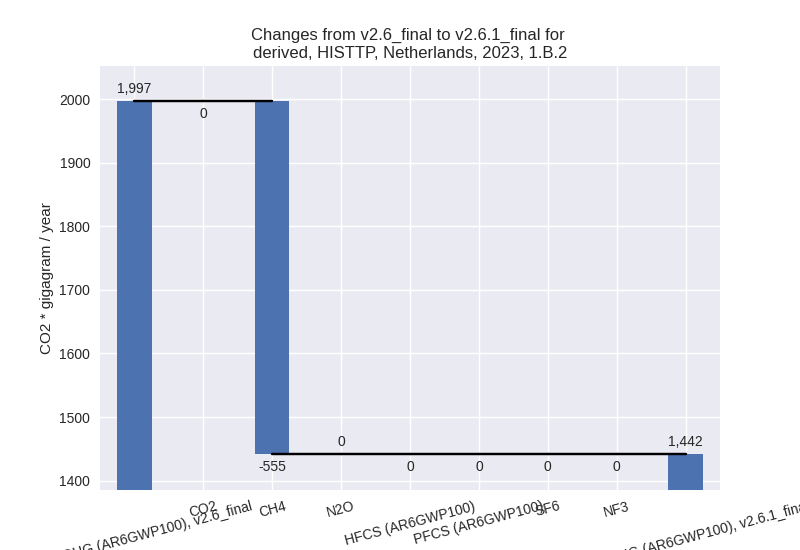
There is no subsector information available in PRIMAP-hist. - 1.B.2: Total sectoral emissions in 2022 are 1548.91
Gg CO2 / year which is 1.2% of category 1 emissions. 2023 Emissions have
changed by -27.8% (-554.89 Gg CO2 /
year). 1990-2023 Emissions have changed by -54.8% (-3580.95 Gg CO2 / year). For 2023
the changes per gas
are:
For 1990-2023 the changes per gas are: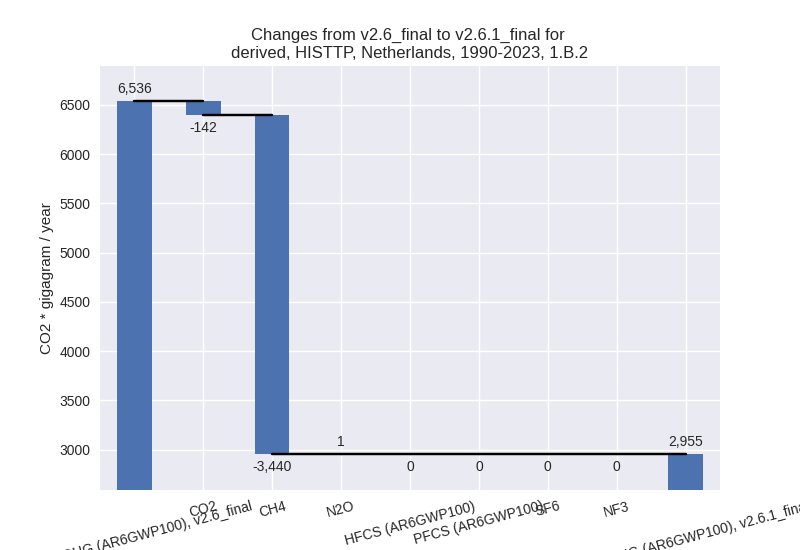
There is no subsector information available in PRIMAP-hist.
- 2: Total sectoral emissions in 2022 are 13280.32 Gg
CO2 / year which is 7.7% of M.0.EL emissions. 2023 Emissions have
changed by -60.5% (-19986.86 Gg CO2
/ year). 1990-2023 Emissions have changed by -44.6% (-15899.38 Gg CO2 / year). For 2023
the changes per gas
are:
For 1990-2023 the changes per gas are: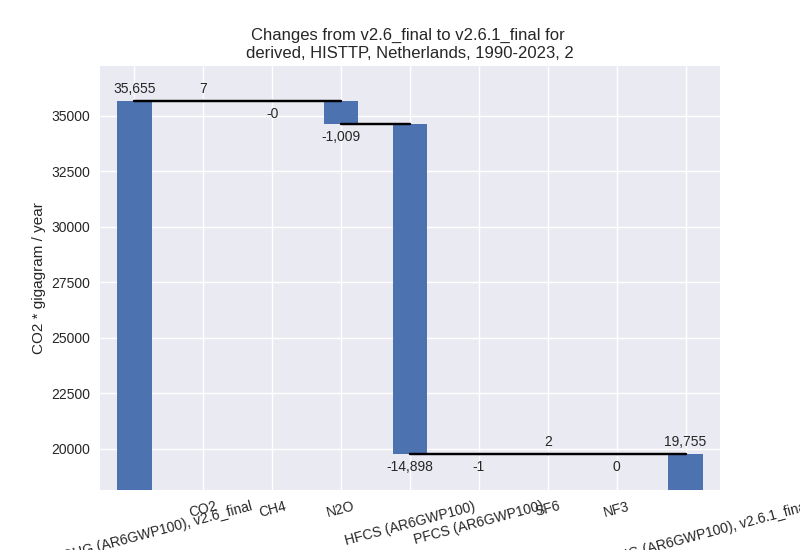
- M.AG: Total sectoral emissions in 2022 are 19172.52
Gg CO2 / year which is 11.1% of M.0.EL emissions. 2023 Emissions have
changed by 3.3% (604.16 Gg CO2 /
year). 1990-2023 Emissions have changed by 0.4% (74.05 Gg CO2 / year). For 2023 the
changes per gas
are:
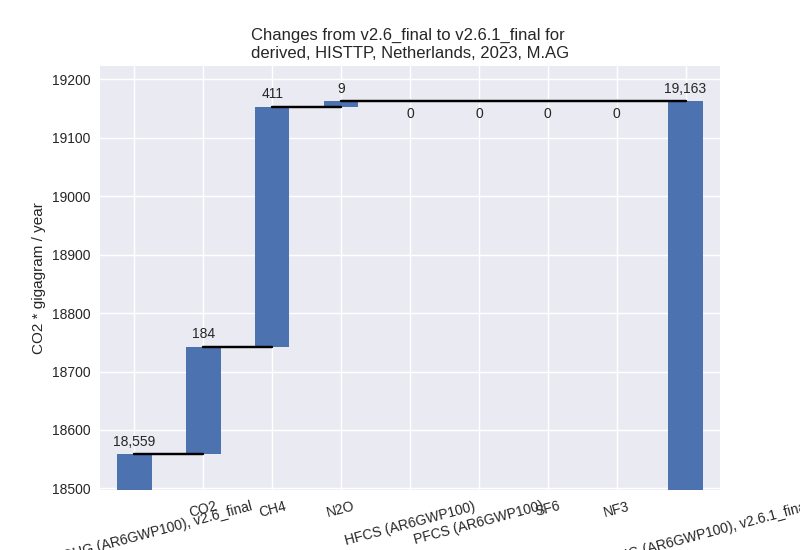
The changes come from the following subsectors:- 3.A: Total sectoral emissions in 2022 are 13830.95
Gg CO2 / year which is 72.1% of category M.AG emissions. 2023 Emissions
have changed by 3.3% (445.64 Gg CO2
/ year). 1990-2023 Emissions have changed by 0.2% (27.01 Gg CO2 / year). For 2023 the
changes per gas
are:
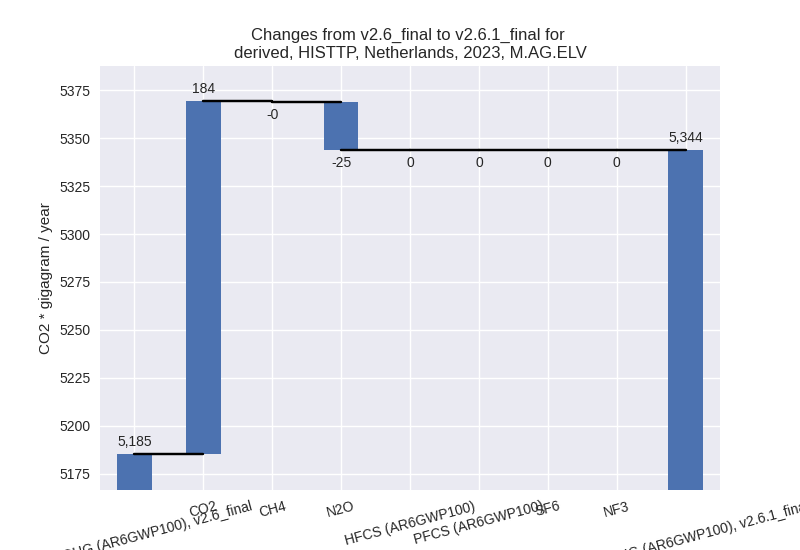
There is no subsector information available in PRIMAP-hist. - M.AG.ELV: Total sectoral emissions in 2022 are
5341.58 Gg CO2 / year which is 27.9% of category M.AG emissions. 2023
Emissions have changed by 3.1%
(158.52 Gg CO2 / year). 1990-2023 Emissions have changed by 0.8% (47.04 Gg CO2 / year). For 2023 the
changes per gas
are:
There is no subsector information available in PRIMAP-hist.
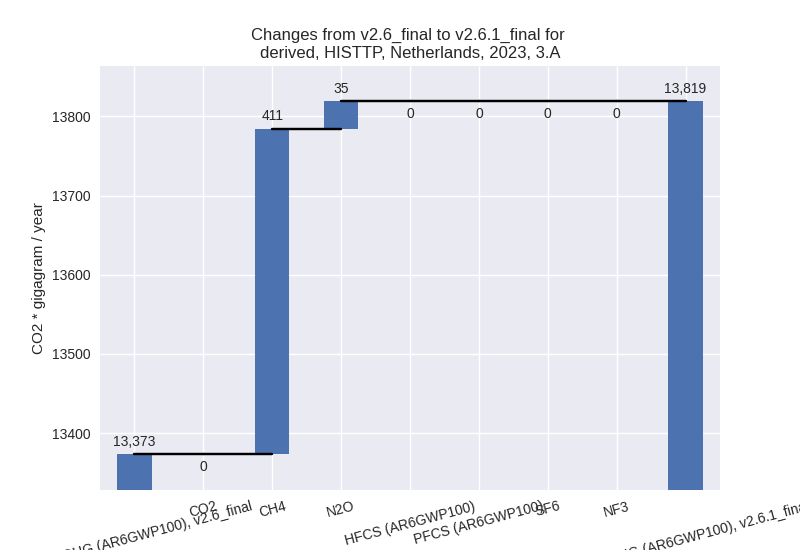
- 3.A: Total sectoral emissions in 2022 are 13830.95
Gg CO2 / year which is 72.1% of category M.AG emissions. 2023 Emissions
have changed by 3.3% (445.64 Gg CO2
/ year). 1990-2023 Emissions have changed by 0.2% (27.01 Gg CO2 / year). For 2023 the
changes per gas
are:
- 4: Total sectoral emissions in 2022 are 5214.90 Gg
CO2 / year which is 3.0% of M.0.EL emissions. 2023 Emissions have
changed by -10.4% (-591.00 Gg CO2 /
year). 1990-2023 Emissions have changed by -8.3% (-850.67 Gg CO2 / year). For 2023
the changes per gas
are:
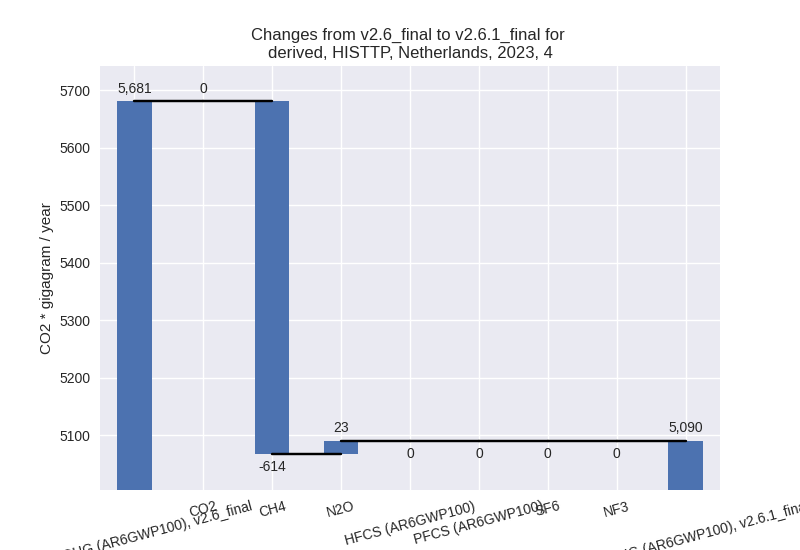
For 1990-2023 the changes per gas are:
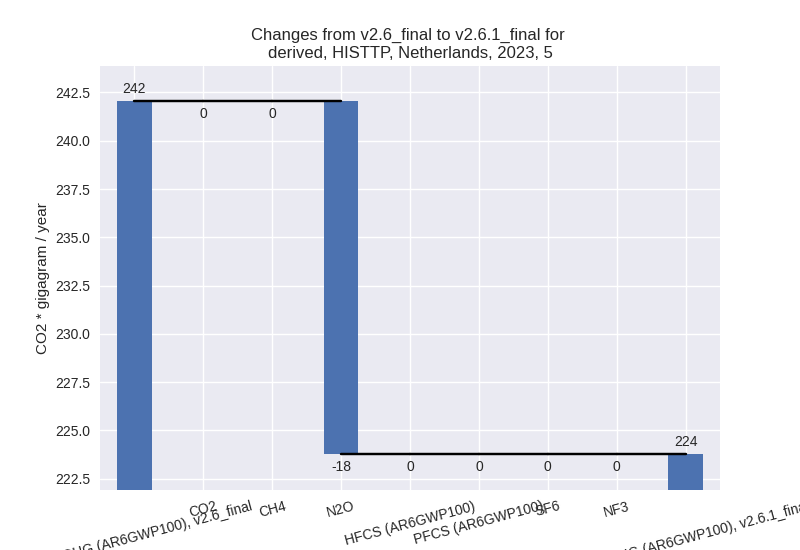
- 5: Total sectoral emissions in 2022 are 235.82 Gg
CO2 / year which is 0.1% of M.0.EL emissions. 2023 Emissions have
changed by -7.5% (-18.27 Gg CO2 /
year). 1990-2023 Emissions have changed by -7.0% (-36.94 Gg CO2 / year). For 2023 the
changes per gas
are:
For 1990-2023 the changes per gas are: