Changes in PRIMAP-hist v2.6.1_final compared to v2.6_final for Norway
2025-03-19
Johannes Gütschow
Change analysis for Norway for PRIMAP-hist v2.6.1_final compared to v2.6_final
Overview over emissions by sector and gas
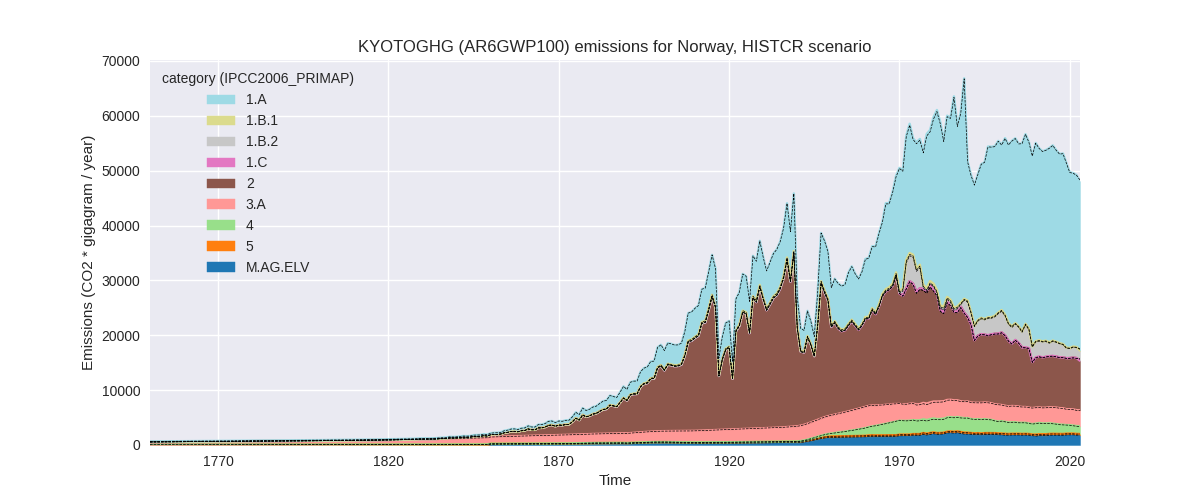
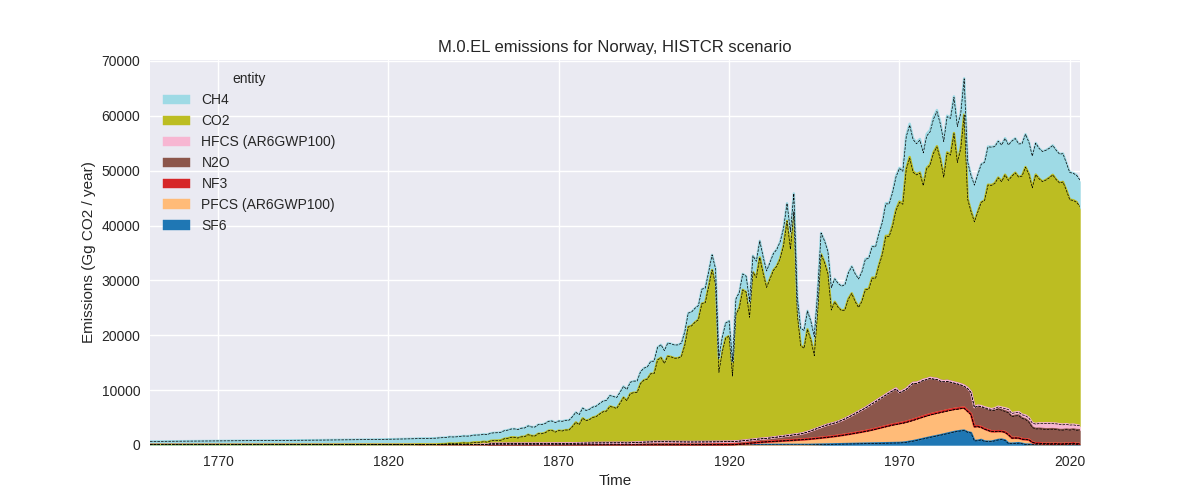
The following figures show the aggregate national total emissions excluding LULUCF AR6GWP100 for the country reported priority scenario. The dotted linesshow the v2.6_final data.
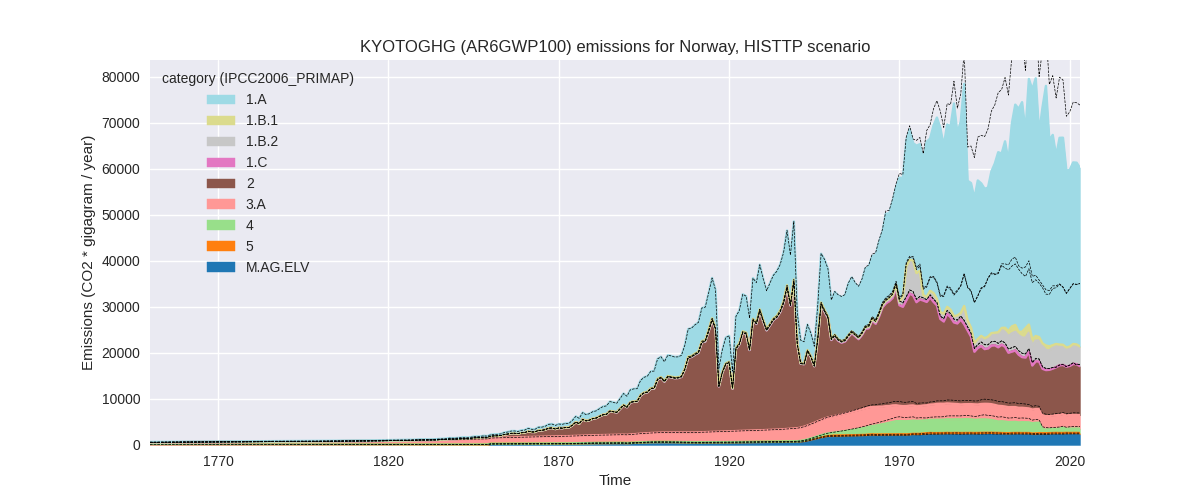
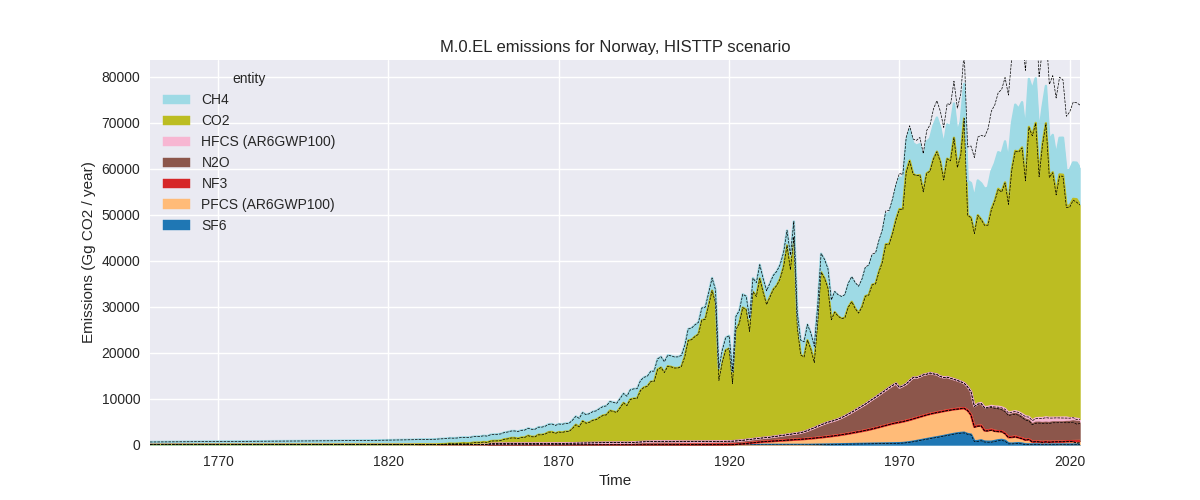
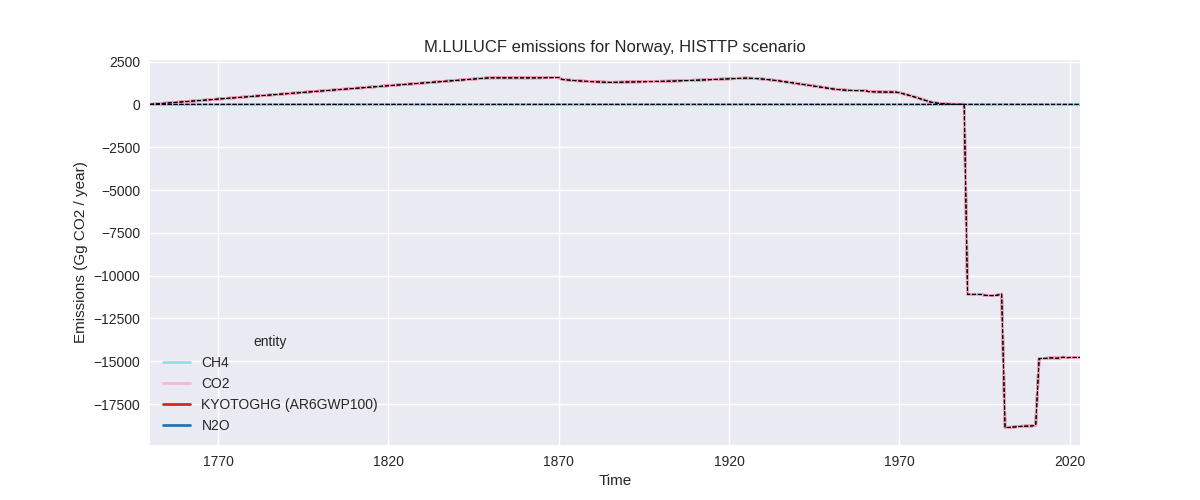
The following figures show the aggregate national total emissions excluding LULUCF AR6GWP100 for the third party priority scenario. The dotted linesshow the v2.6_final data.
Overview over changes
In the country reported priority scenario we have the following changes for aggregate Kyoto GHG and national total emissions excluding LULUCF (M.0.EL):
- Emissions in 2023 have changed by -0.6%% (-295.07 Gg CO2 / year)
- Emissions in 1990-2023 have changed by 0.1%% (30.01 Gg CO2 / year)
In the third party priority scenario we have the following changes for aggregate Kyoto GHG and national total emissions excluding LULUCF (M.0.EL):
- Emissions in 2023 have changed by -18.5%% (-13654.01 Gg CO2 / year)
- Emissions in 1990-2023 have changed by -16.1%% (-12521.42 Gg CO2 / year)
Most important changes per scenario and time frame
In the country reported priority scenario the following sector-gas combinations have the highest absolute impact on national total KyotoGHG (AR6GWP100) emissions in 2023 (top 5):
- 1: 2, CO2 with -311.80 Gg CO2 / year (-3.9%)
- 2: 4, CH4 with 53.34 Gg CO2 / year (4.8%)
- 3: 2, HFCS (AR6GWP100) with -49.96 Gg CO2 / year (-6.0%)
- 4: 2, PFCS (AR6GWP100) with -43.28 Gg CO2 / year (-23.7%)
- 5: 2, N2O with 41.65 Gg CO2 / year (19.6%)
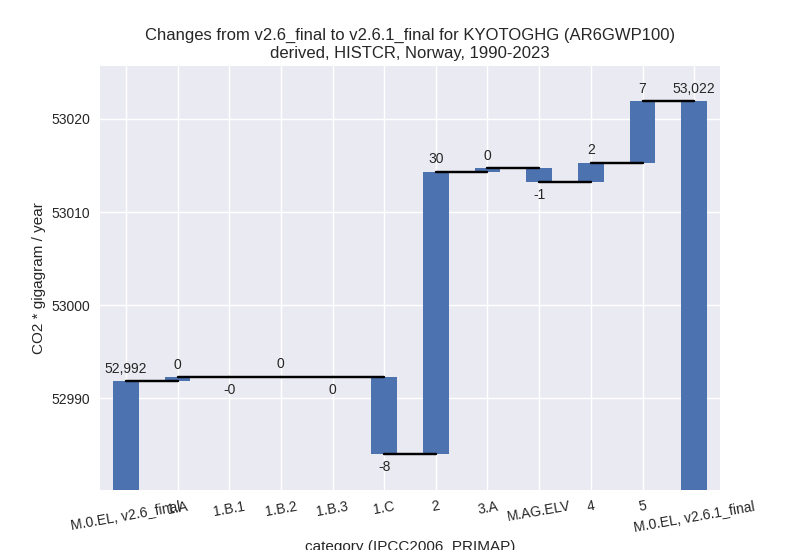
In the country reported priority scenario the following sector-gas combinations have the highest absolute impact on national total KyotoGHG (AR6GWP100) emissions in 1990-2023 (top 5):
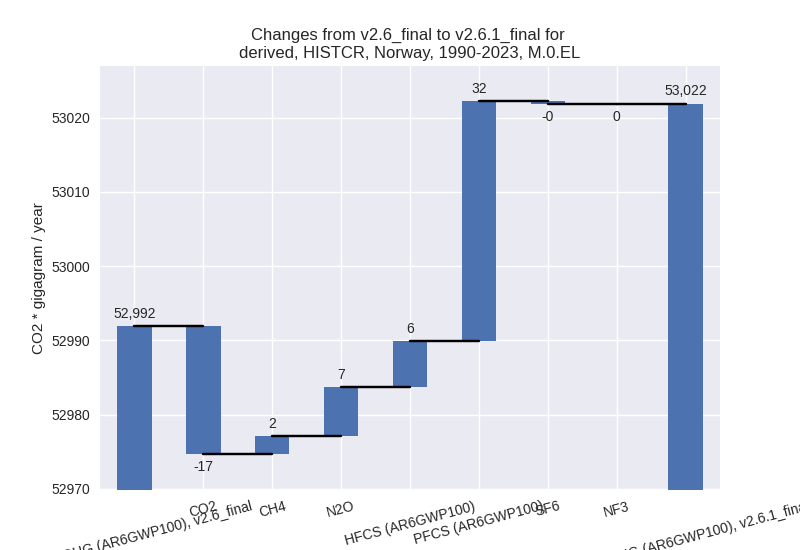
- 1: 2, PFCS (AR6GWP100) with 32.30 Gg CO2 / year (3.0%)
- 2: 2, CO2 with -9.17 Gg CO2 / year (-0.1%)
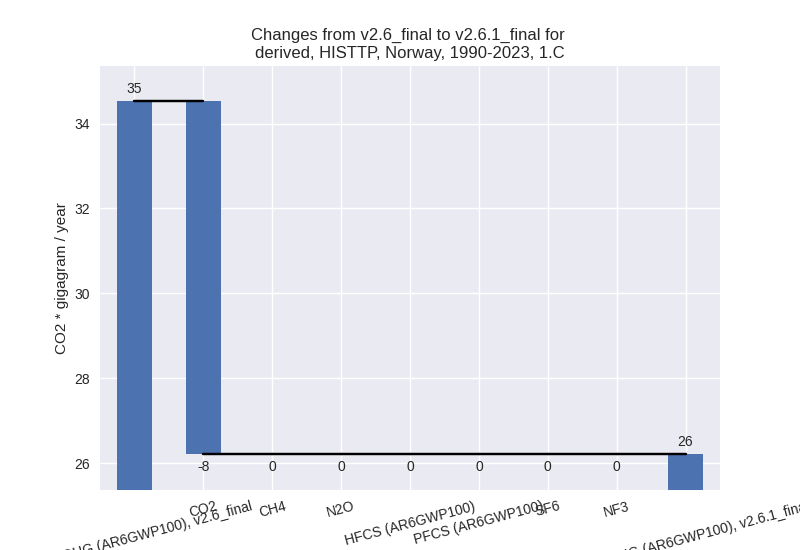
- 3: 1.C, CO2 with -8.31 Gg CO2 / year (-24.1%)
- 4: 5, N2O with 6.58 Gg CO2 / year (2.9%)
- 5: 2, HFCS (AR6GWP100) with 6.25 Gg CO2 / year (1.0%)
In the third party priority scenario the following sector-gas combinations have the highest absolute impact on national total KyotoGHG (AR6GWP100) emissions in 2023 (top 5):
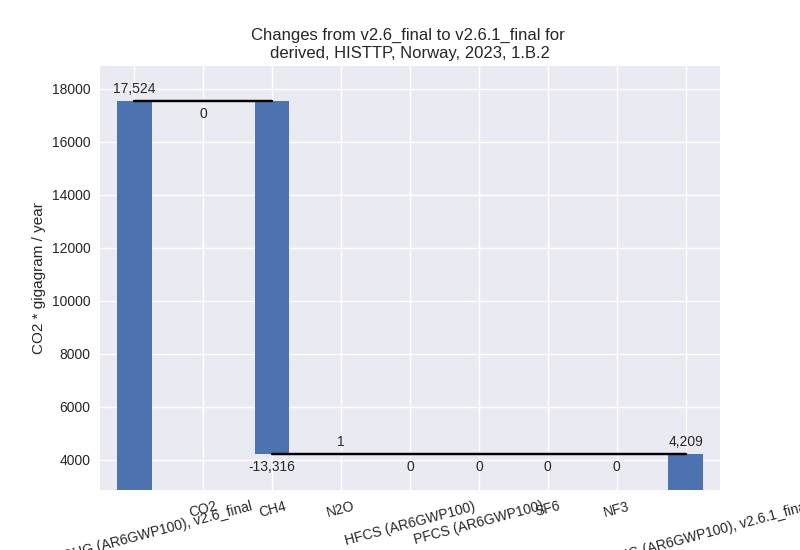
- 1: 1.B.2, CH4 with -13316.18 Gg CO2 / year (-77.2%)
- 2: 4, CH4 with -457.81 Gg CO2 / year (-37.6%)
- 3: 2, HFCS (AR6GWP100) with -354.32 Gg CO2 / year (-37.8%)
- 4: 2, PFCS (AR6GWP100) with 342.79 Gg CO2 / year (79.7%)
- 5: 2, CO2 with 89.94 Gg CO2 / year (1.1%)
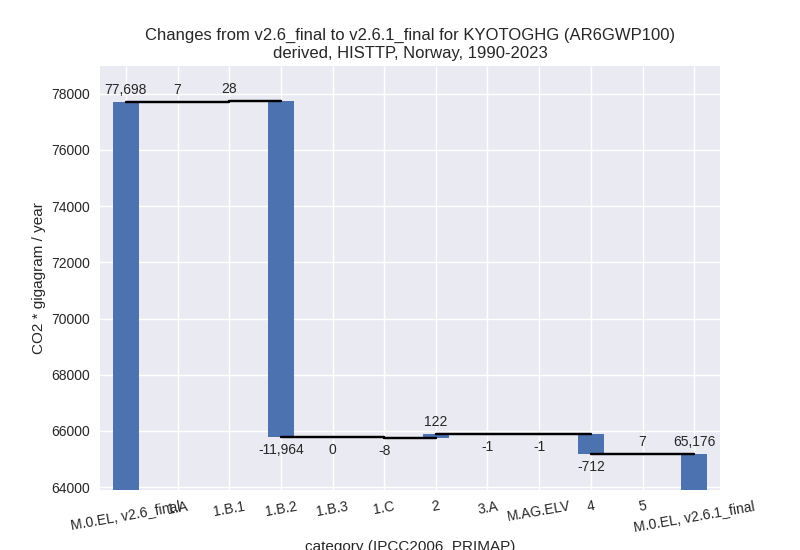
In the third party priority scenario the following sector-gas combinations have the highest absolute impact on national total KyotoGHG (AR6GWP100) emissions in 1990-2023 (top 5):
- 1: 1.B.2, CH4 with -11963.42 Gg CO2 / year (-81.4%)
- 2: 4, CH4 with -723.99 Gg CO2 / year (-28.4%)
- 3: 2, CO2 with 66.63 Gg CO2 / year (0.9%)
- 4: 2, SF6 with 62.32 Gg CO2 / year (14.4%)
- 5: 2, HFCS (AR6GWP100) with -32.11 Gg CO2 / year (-4.9%)
Notes on data changes
Here we list notes explaining important emissions changes for the country.
- CRT data has been included but replaces official data reported to the EU which does not show noteworthy differences. Changes in the CR time-series are small and come from updated third party data (EDGAR, FAO) which is used to extrapolate the country reported data.
- The most significant change in the TP scenario is that CH4 in 1.B.2
is over 75% lower in the new EDGAR release following discussions about
the validity of the EDGAR data which is much higher than the country
reported data.
- Changes in waste CH4 come directly from EDGAR.
- Changes in f-gas emissions come from the new EDGAR data which shows higher PFC and lower HFC emissions than the old PRIMAP-hist version based on EDGAR7.0 and numerical extrapolation.
Changes by sector and gas
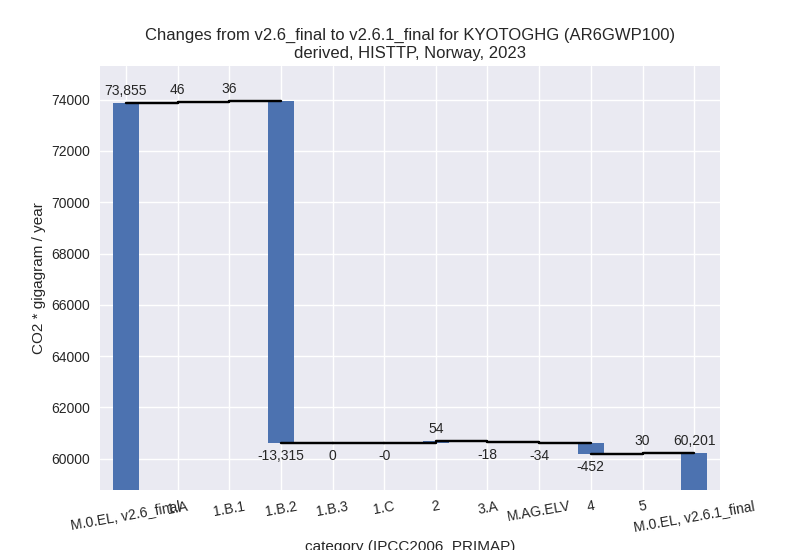
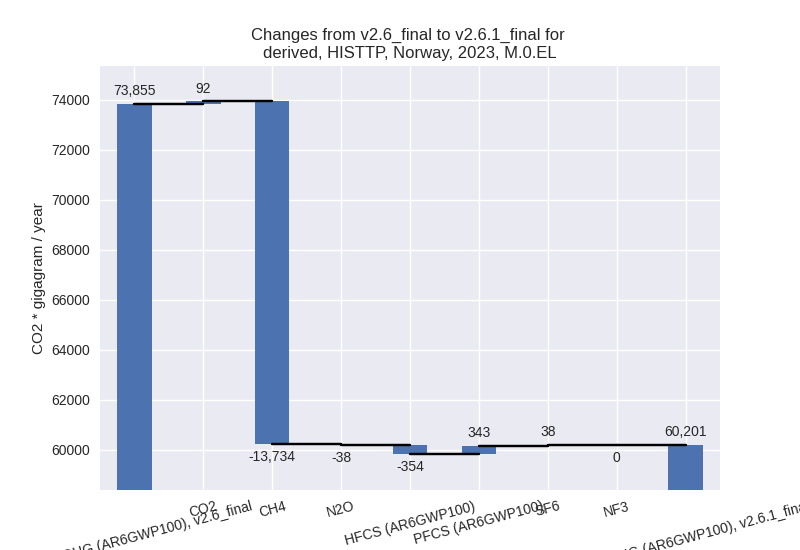
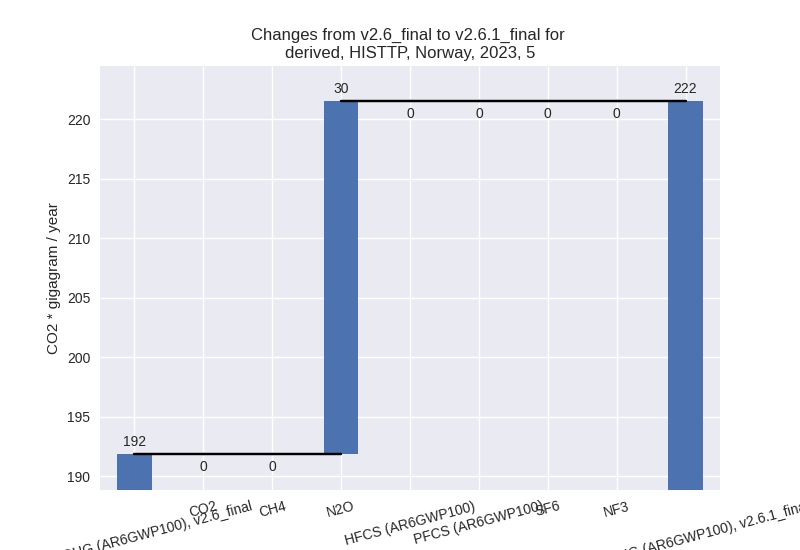
For each scenario and time frame the changes are displayed for all individual sectors and all individual gases. In the sector plot we use aggregate Kyoto GHGs in AR6GWP100. In the gas plot we usenational total emissions without LULUCF.
country reported scenario
2023
1990-2023
third party scenario
2023
1990-2023

Detailed changes for the scenarios:
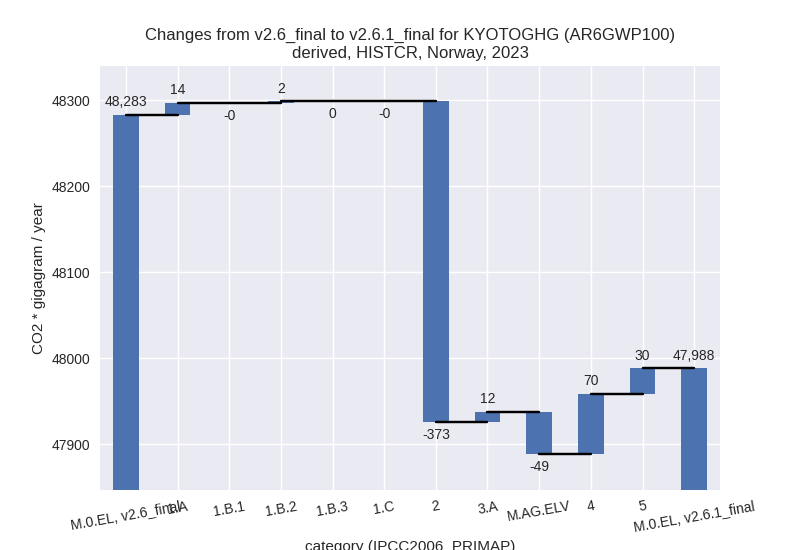
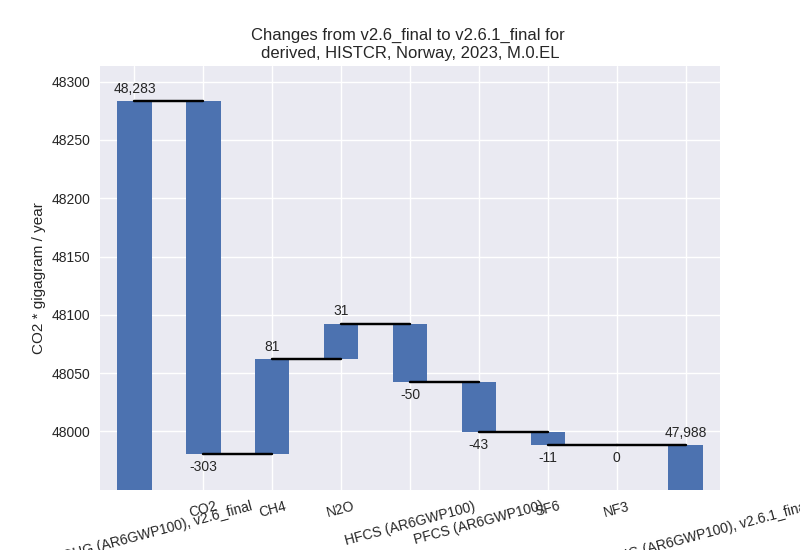
country reported scenario (HISTCR):
Most important changes per time frame
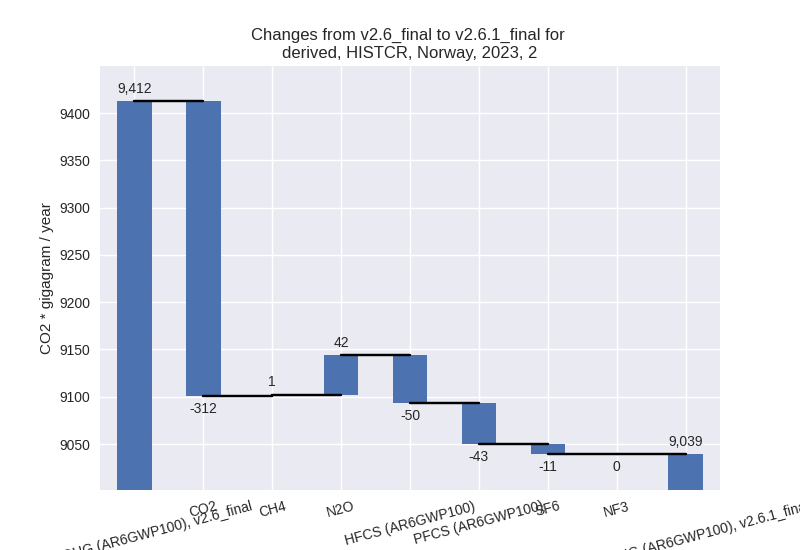
For 2023 the following sector-gas combinations have the highest absolute impact on national total KyotoGHG (AR6GWP100) emissions in 2023 (top 5):
- 1: 2, CO2 with -311.80 Gg CO2 / year (-3.9%)
- 2: 4, CH4 with 53.34 Gg CO2 / year (4.8%)
- 3: 2, HFCS (AR6GWP100) with -49.96 Gg CO2 / year (-6.0%)
- 4: 2, PFCS (AR6GWP100) with -43.28 Gg CO2 / year (-23.7%)
- 5: 2, N2O with 41.65 Gg CO2 / year (19.6%)
For 1990-2023 the following sector-gas combinations have the highest absolute impact on national total KyotoGHG (AR6GWP100) emissions in 1990-2023 (top 5):
- 1: 2, PFCS (AR6GWP100) with 32.30 Gg CO2 / year (3.0%)
- 2: 2, CO2 with -9.17 Gg CO2 / year (-0.1%)
- 3: 1.C, CO2 with -8.31 Gg CO2 / year (-24.1%)
- 4: 5, N2O with 6.58 Gg CO2 / year (2.9%)
- 5: 2, HFCS (AR6GWP100) with 6.25 Gg CO2 / year (1.0%)
Changes in the main sectors for aggregate KyotoGHG (AR6GWP100) are
- 1: Total sectoral emissions in 2022 are 33360.74 Gg CO2 / year which is 67.8% of M.0.EL emissions. 2023 Emissions have changed by 0.0% (15.75 Gg CO2 / year). 1990-2023 Emissions have changed by -0.0% (-7.85 Gg CO2 / year).
- 2: Total sectoral emissions in 2022 are 9484.96 Gg
CO2 / year which is 19.3% of M.0.EL emissions. 2023 Emissions have
changed by -4.0% (-373.19 Gg CO2 /
year). 1990-2023 Emissions have changed by 0.3% (30.32 Gg CO2 / year). For 2023 the
changes per gas
are:
- M.AG: Total sectoral emissions in 2022 are 4684.05 Gg CO2 / year which is 9.5% of M.0.EL emissions. 2023 Emissions have changed by -0.8% (-37.43 Gg CO2 / year). 1990-2023 Emissions have changed by -0.0% (-1.10 Gg CO2 / year).
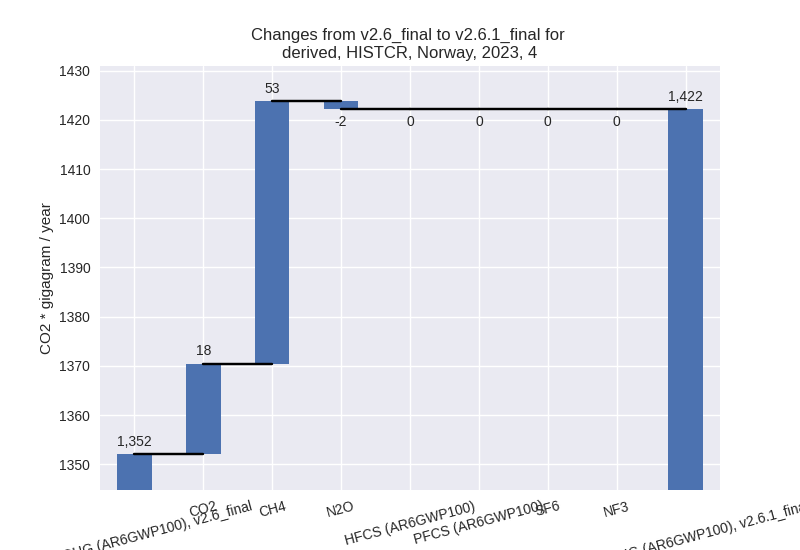
- 4: Total sectoral emissions in 2022 are 1428.43 Gg
CO2 / year which is 2.9% of M.0.EL emissions. 2023 Emissions have
changed by 5.2% (70.15 Gg CO2 /
year). 1990-2023 Emissions have changed by 0.1% (2.06 Gg CO2 / year). For 2023 the
changes per gas
are:
- 5: Total sectoral emissions in 2022 are 233.82 Gg
CO2 / year which is 0.5% of M.0.EL emissions. 2023 Emissions have
changed by 15.5% (29.65 Gg CO2 /
year). 1990-2023 Emissions have changed by 2.9% (6.58 Gg CO2 / year). For 2023 the
changes per gas
are:

For 1990-2023 the changes per gas are:
third party scenario (HISTTP):
Most important changes per time frame
For 2023 the following sector-gas combinations have the highest absolute impact on national total KyotoGHG (AR6GWP100) emissions in 2023 (top 5):
- 1: 1.B.2, CH4 with -13316.18 Gg CO2 / year (-77.2%)
- 2: 4, CH4 with -457.81 Gg CO2 / year (-37.6%)
- 3: 2, HFCS (AR6GWP100) with -354.32 Gg CO2 / year (-37.8%)
- 4: 2, PFCS (AR6GWP100) with 342.79 Gg CO2 / year (79.7%)
- 5: 2, CO2 with 89.94 Gg CO2 / year (1.1%)
For 1990-2023 the following sector-gas combinations have the highest absolute impact on national total KyotoGHG (AR6GWP100) emissions in 1990-2023 (top 5):
- 1: 1.B.2, CH4 with -11963.42 Gg CO2 / year (-81.4%)
- 2: 4, CH4 with -723.99 Gg CO2 / year (-28.4%)
- 3: 2, CO2 with 66.63 Gg CO2 / year (0.9%)
- 4: 2, SF6 with 62.32 Gg CO2 / year (14.4%)
- 5: 2, HFCS (AR6GWP100) with -32.11 Gg CO2 / year (-4.9%)
Changes in the main sectors for aggregate KyotoGHG (AR6GWP100) are
- 1: Total sectoral emissions in 2022 are 43815.41 Gg
CO2 / year which is 71.4% of M.0.EL emissions. 2023 Emissions have
changed by -23.5% (-13233.32 Gg CO2
/ year). 1990-2023 Emissions have changed by -20.6% (-11936.39 Gg CO2 / year). For 2023
the changes per gas
are:

For 1990-2023 the changes per gas are:
The changes come from the following subsectors:- 1.A: Total sectoral emissions in 2022 are 39504.12 Gg CO2 / year which is 90.2% of category 1 emissions. 2023 Emissions have changed by 0.1% (45.82 Gg CO2 / year). 1990-2023 Emissions have changed by 0.0% (7.12 Gg CO2 / year).
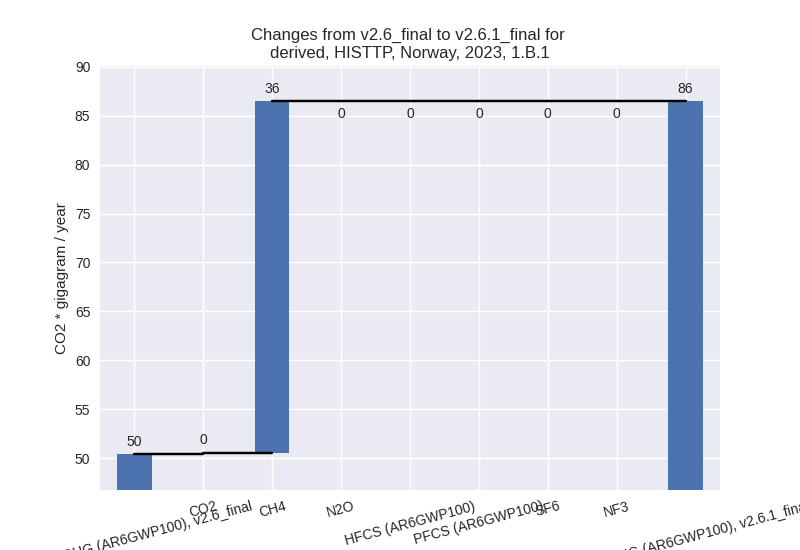
- 1.B.1: Total sectoral emissions in 2022 are 87.83
Gg CO2 / year which is 0.2% of category 1 emissions. 2023 Emissions have
changed by 71.6% (36.09 Gg CO2 /
year). 1990-2023 Emissions have changed by 4.9% (28.38 Gg CO2 / year). For 2023 the
changes per gas
are:
For 1990-2023 the changes per gas are: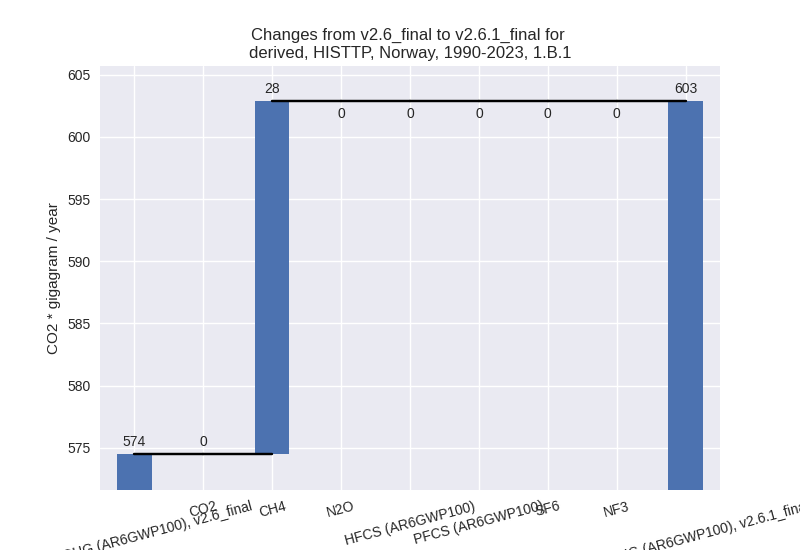
There is no subsector information available in PRIMAP-hist. - 1.B.2: Total sectoral emissions in 2022 are 4209.88
Gg CO2 / year which is 9.6% of category 1 emissions. 2023 Emissions have
changed by -76.0% (-13315.22 Gg CO2
/ year). 1990-2023 Emissions have changed by -76.9% (-11963.57 Gg CO2 / year). For 2023
the changes per gas
are:
For 1990-2023 the changes per gas are:
There is no subsector information available in PRIMAP-hist. - 1.C: Total sectoral emissions in 2022 are 13.57 Gg
CO2 / year which is 0.0% of category 1 emissions. 2023 Emissions have
changed by -0.0% (-0.00 Gg CO2 /
year). 1990-2023 Emissions have changed by -24.1% (-8.31 Gg CO2 / year). For
1990-2023 the changes per gas
are:
There is no subsector information available in PRIMAP-hist.
- 2: Total sectoral emissions in 2022 are 11013.94 Gg CO2 / year which is 18.0% of M.0.EL emissions. 2023 Emissions have changed by 0.5% (54.02 Gg CO2 / year). 1990-2023 Emissions have changed by 1.1% (122.19 Gg CO2 / year).
- M.AG: Total sectoral emissions in 2022 are 5333.49 Gg CO2 / year which is 8.7% of M.0.EL emissions. 2023 Emissions have changed by -1.0% (-51.97 Gg CO2 / year). 1990-2023 Emissions have changed by -0.0% (-2.28 Gg CO2 / year).
- 4: Total sectoral emissions in 2022 are 943.37 Gg
CO2 / year which is 1.5% of M.0.EL emissions. 2023 Emissions have
changed by -32.3% (-452.40 Gg CO2 /
year). 1990-2023 Emissions have changed by -26.4% (-711.52 Gg CO2 / year). For 2023
the changes per gas
are:

For 1990-2023 the changes per gas are: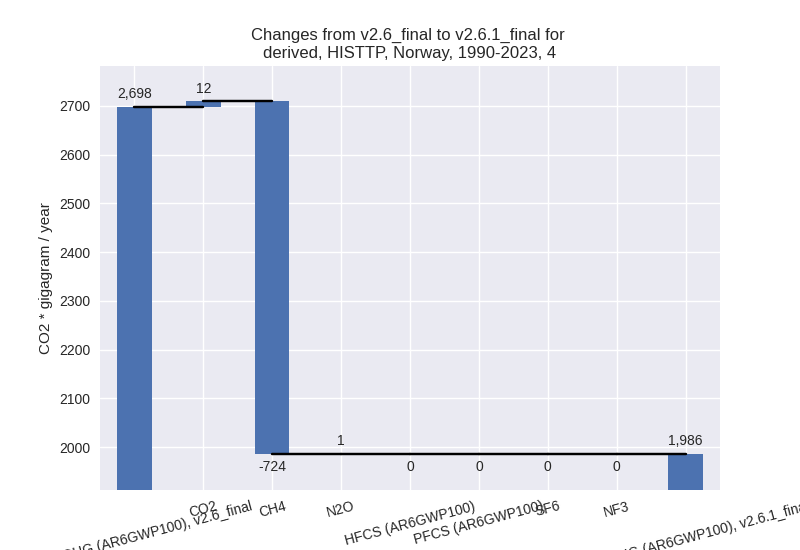
- 5: Total sectoral emissions in 2022 are 233.82 Gg
CO2 / year which is 0.4% of M.0.EL emissions. 2023 Emissions have
changed by 15.5% (29.65 Gg CO2 /
year). 1990-2023 Emissions have changed by 2.9% (6.58 Gg CO2 / year). For 2023 the
changes per gas
are:
For 1990-2023 the changes per gas are: