Changes in PRIMAP-hist v2.6.1_final compared to v2.6_final for New Zealand
2025-03-19
Johannes Gütschow
Change analysis for New Zealand for PRIMAP-hist v2.6.1_final compared to v2.6_final
Overview over emissions by sector and gas
The following figures show the aggregate national total emissions excluding LULUCF AR6GWP100 for the country reported priority scenario. The dotted linesshow the v2.6_final data.
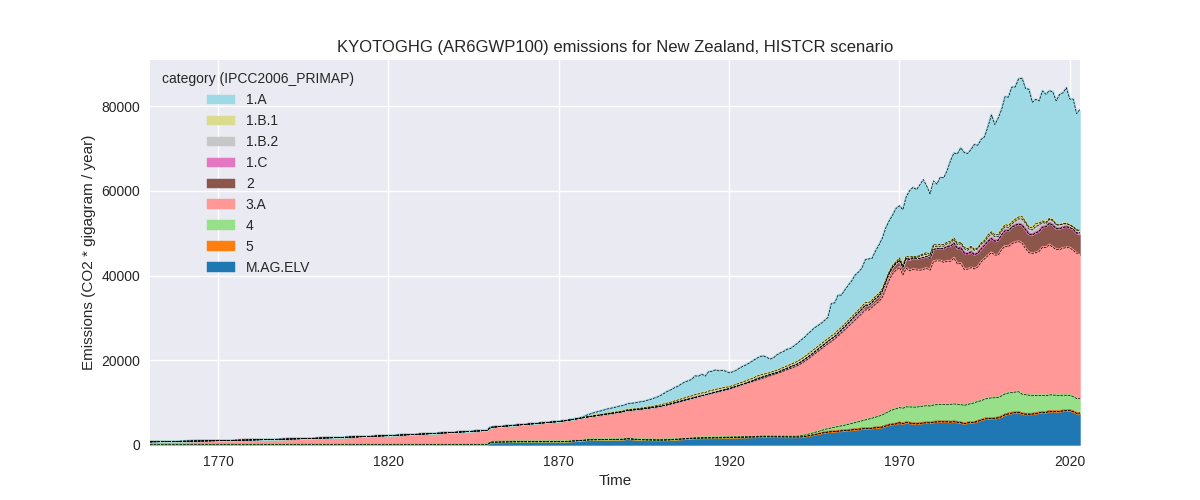
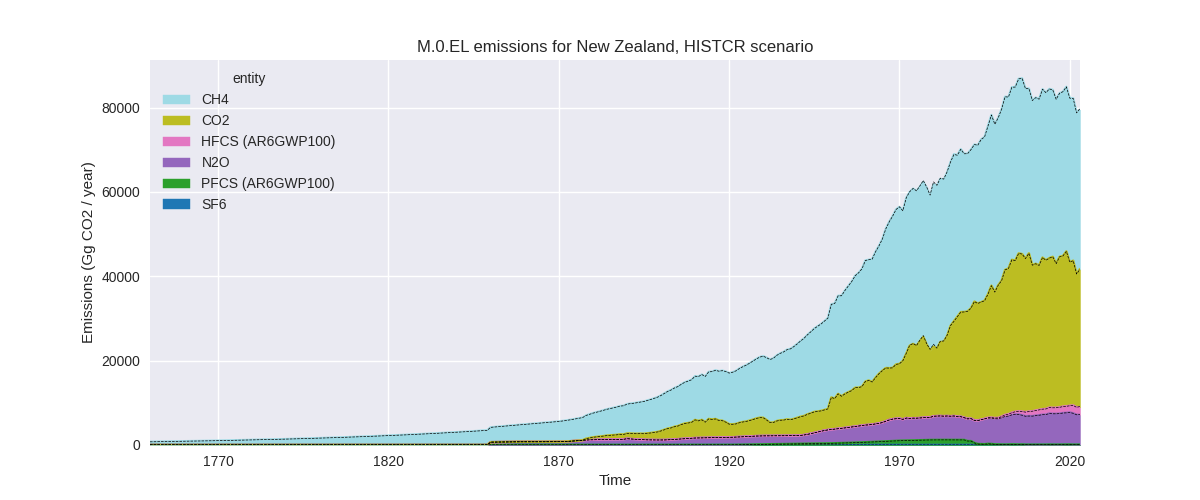
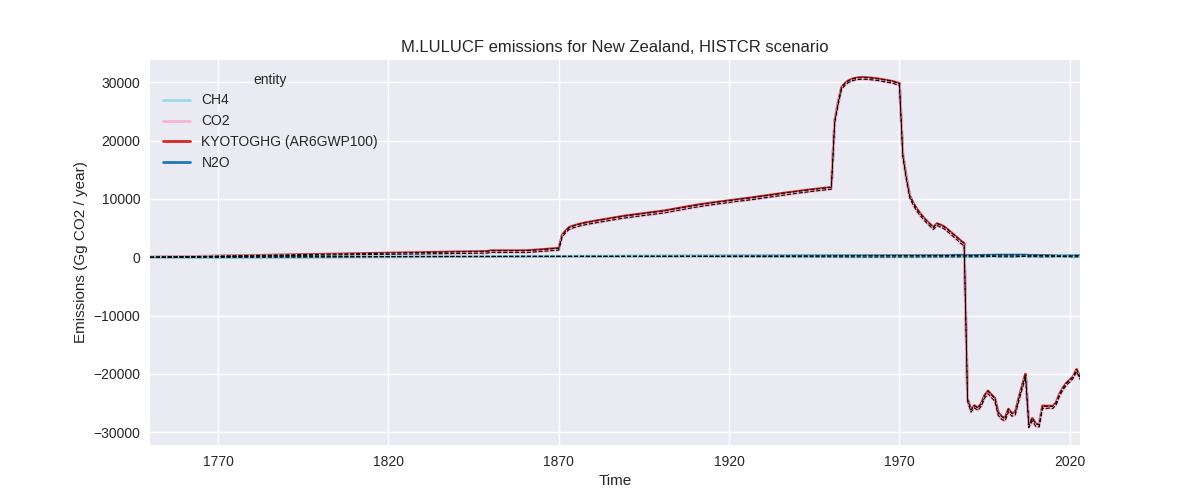
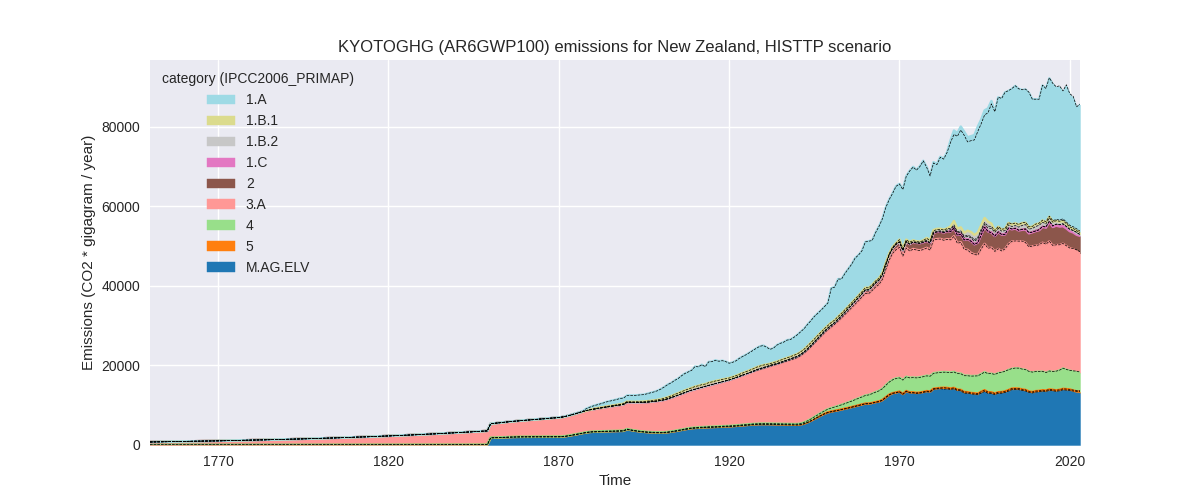
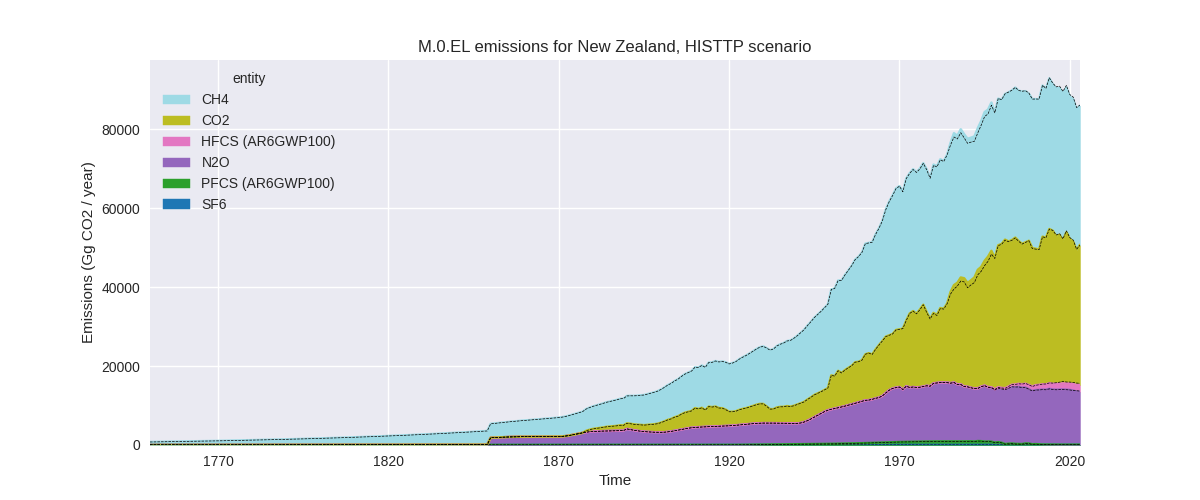
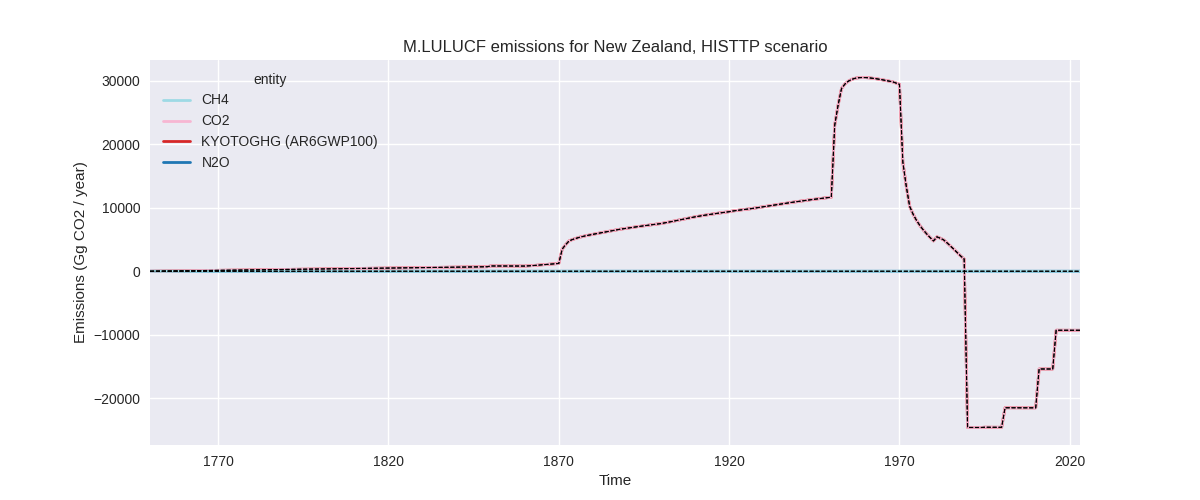
The following figures show the aggregate national total emissions excluding LULUCF AR6GWP100 for the third party priority scenario. The dotted linesshow the v2.6_final data.
Overview over changes
In the country reported priority scenario we have the following changes for aggregate Kyoto GHG and national total emissions excluding LULUCF (M.0.EL):
- Emissions in 2023 have changed by -0.3%% (-238.33 Gg CO2 / year)
- Emissions in 1990-2023 have changed by -0.0%% (-7.01 Gg CO2 / year)
In the third party priority scenario we have the following changes for aggregate Kyoto GHG and national total emissions excluding LULUCF (M.0.EL):
- Emissions in 2023 have changed by -0.1%% (-124.99 Gg CO2 / year)
- Emissions in 1990-2023 have changed by 0.1%% (110.07 Gg CO2 / year)
Most important changes per scenario and time frame
In the country reported priority scenario the following sector-gas combinations have the highest absolute impact on national total KyotoGHG (AR6GWP100) emissions in 2023 (top 5):
- 1: 3.A, CH4 with -402.56 Gg CO2 / year (-1.2%)
- 2: 1.B.2, CO2 with 119.62 Gg CO2 / year (38.4%)
- 3: M.AG.ELV, N2O with -117.34 Gg CO2 / year (-1.8%)
- 4: 2, CO2 with 110.39 Gg CO2 / year (4.1%)
- 5: 2, HFCS (AR6GWP100) with -84.07 Gg CO2 / year (-4.4%)
In the country reported priority scenario the following sector-gas combinations have the highest absolute impact on national total KyotoGHG (AR6GWP100) emissions in 1990-2023 (top 5):
- 1: 3.A, CH4 with -11.84 Gg CO2 / year (-0.0%)
- 2: 1.B.2, CO2 with 3.52 Gg CO2 / year (0.7%)
- 3: M.AG.ELV, N2O with -3.45 Gg CO2 / year (-0.1%)
- 4: 2, CO2 with 3.25 Gg CO2 / year (0.1%)
- 5: 2, HFCS (AR6GWP100) with -2.47 Gg CO2 / year (-0.3%)
In the third party priority scenario the following sector-gas combinations have the highest absolute impact on national total KyotoGHG (AR6GWP100) emissions in 2023 (top 5):
- 1: 2, CO2 with 280.56 Gg CO2 / year (13.0%)
- 2: 3.A, CH4 with -260.59 Gg CO2 / year (-0.9%)
- 3: 2, HFCS (AR6GWP100) with -238.39 Gg CO2 / year (-12.1%)
- 4: M.AG.ELV, N2O with -183.86 Gg CO2 / year (-1.5%)
- 5: 1.B.1, CO2 with 175.81 Gg CO2 / year (105.6%)
In the third party priority scenario the following sector-gas combinations have the highest absolute impact on national total KyotoGHG (AR6GWP100) emissions in 1990-2023 (top 5):
- 1: 1.B.2, CO2 with 333.18 Gg CO2 / year (459.5%)
- 2: 2, HFCS (AR6GWP100) with -102.41 Gg CO2 / year (-10.9%)
- 3: 1.B.2, CH4 with -80.09 Gg CO2 / year (-10.5%)
- 4: 4, CH4 with -37.26 Gg CO2 / year (-0.8%)
- 5: 2, SF6 with 17.05 Gg CO2 / year (75.0%)
Notes on data changes
Here we list notes explaining important emissions changes for the country.
- CRT data has been included but replaces official data which does not show noteworthy differences. Changes in the CR time-series are small and come from updated third party data (EDGAR, FAO) which is used to extrapolate the country reported data and replaces numerical extrapolation for 2023 in some sectors.
- TP time-series changes come from new EDGAR and FAO data.
Changes by sector and gas
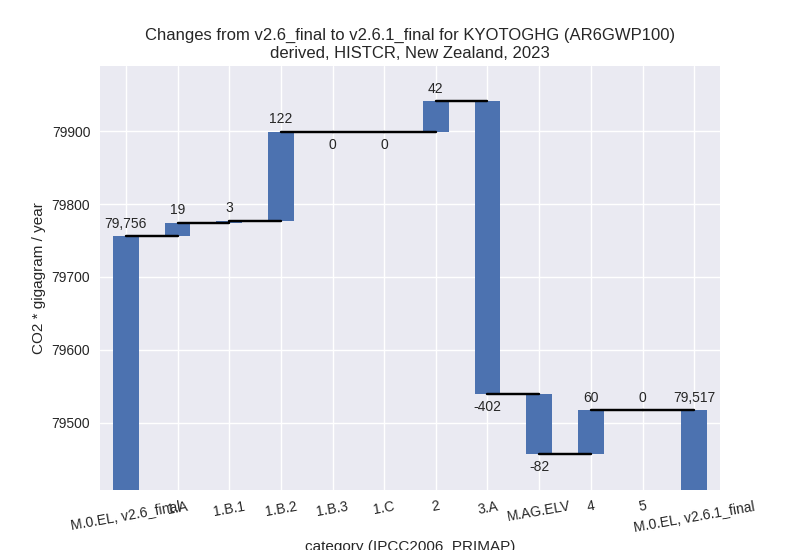
For each scenario and time frame the changes are displayed for all individual sectors and all individual gases. In the sector plot we use aggregate Kyoto GHGs in AR6GWP100. In the gas plot we usenational total emissions without LULUCF.
country reported scenario
2023
1990-2023
third party scenario
2023
1990-2023
Detailed changes for the scenarios:
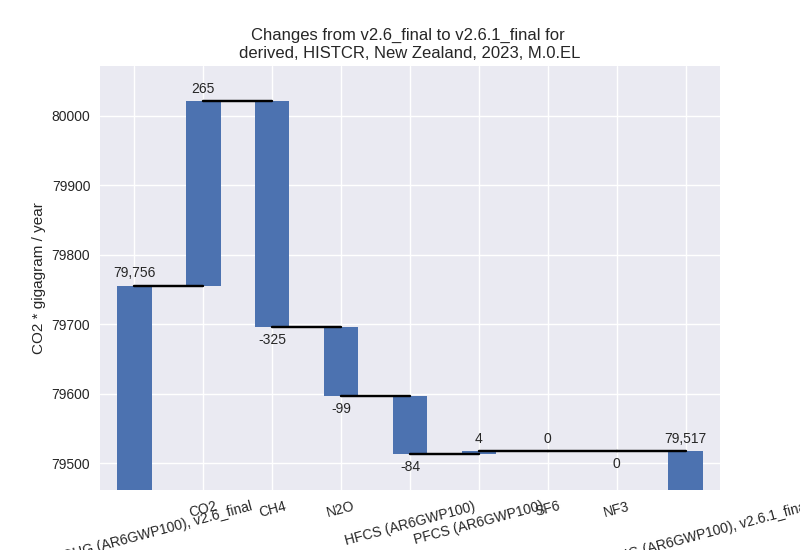
country reported scenario (HISTCR):
Most important changes per time frame
For 2023 the following sector-gas combinations have the highest absolute impact on national total KyotoGHG (AR6GWP100) emissions in 2023 (top 5):
- 1: 3.A, CH4 with -402.56 Gg CO2 / year (-1.2%)
- 2: 1.B.2, CO2 with 119.62 Gg CO2 / year (38.4%)
- 3: M.AG.ELV, N2O with -117.34 Gg CO2 / year (-1.8%)
- 4: 2, CO2 with 110.39 Gg CO2 / year (4.1%)
- 5: 2, HFCS (AR6GWP100) with -84.07 Gg CO2 / year (-4.4%)
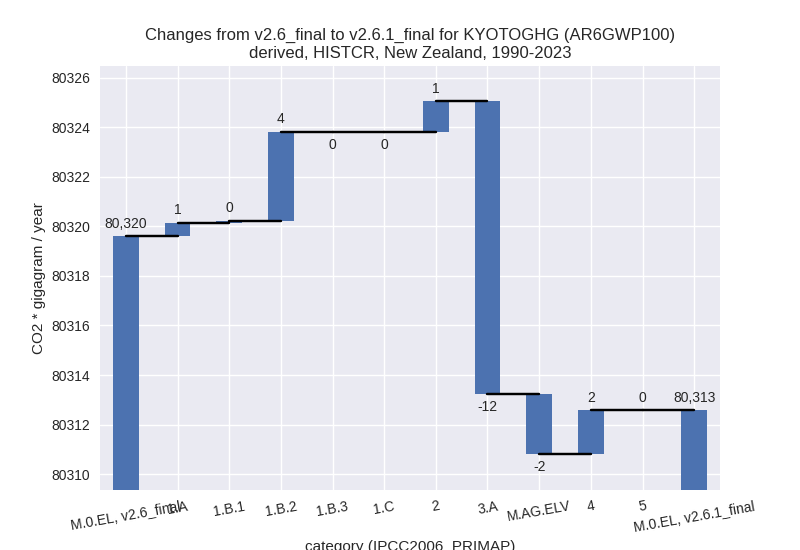
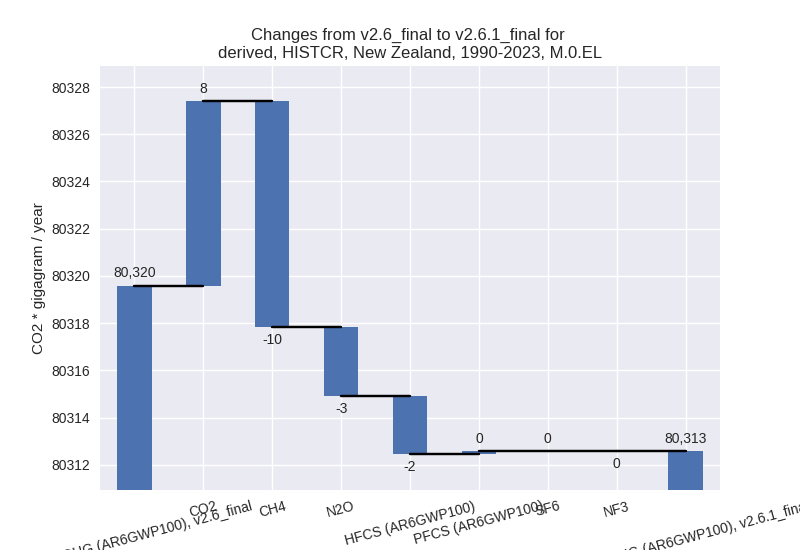
For 1990-2023 the following sector-gas combinations have the highest absolute impact on national total KyotoGHG (AR6GWP100) emissions in 1990-2023 (top 5):
- 1: 3.A, CH4 with -11.84 Gg CO2 / year (-0.0%)
- 2: 1.B.2, CO2 with 3.52 Gg CO2 / year (0.7%)
- 3: M.AG.ELV, N2O with -3.45 Gg CO2 / year (-0.1%)
- 4: 2, CO2 with 3.25 Gg CO2 / year (0.1%)
- 5: 2, HFCS (AR6GWP100) with -2.47 Gg CO2 / year (-0.3%)
Changes in the main sectors for aggregate KyotoGHG (AR6GWP100) are
- 1: Total sectoral emissions in 2022 are 28720.39 Gg CO2 / year which is 36.5% of M.0.EL emissions. 2023 Emissions have changed by 0.5% (143.53 Gg CO2 / year). 1990-2023 Emissions have changed by 0.0% (4.22 Gg CO2 / year).
- 2: Total sectoral emissions in 2022 are 4747.63 Gg CO2 / year which is 6.0% of M.0.EL emissions. 2023 Emissions have changed by 0.9% (41.82 Gg CO2 / year). 1990-2023 Emissions have changed by 0.0% (1.23 Gg CO2 / year).
- M.AG: Total sectoral emissions in 2022 are 41783.61 Gg CO2 / year which is 53.1% of M.0.EL emissions. 2023 Emissions have changed by -1.2% (-483.99 Gg CO2 / year). 1990-2023 Emissions have changed by -0.0% (-14.24 Gg CO2 / year).
- 4: Total sectoral emissions in 2022 are 3485.63 Gg CO2 / year which is 4.4% of M.0.EL emissions. 2023 Emissions have changed by 1.8% (60.32 Gg CO2 / year). 1990-2023 Emissions have changed by 0.0% (1.77 Gg CO2 / year).
- 5: Total sectoral emissions in 2022 are 4.47 Gg CO2 / year which is 0.0% of M.0.EL emissions. 2023 Emissions have changed by 0.0% (0.00 Gg CO2 / year). 1990-2023 Emissions have changed by 0.0% (0.00 Gg CO2 / year).
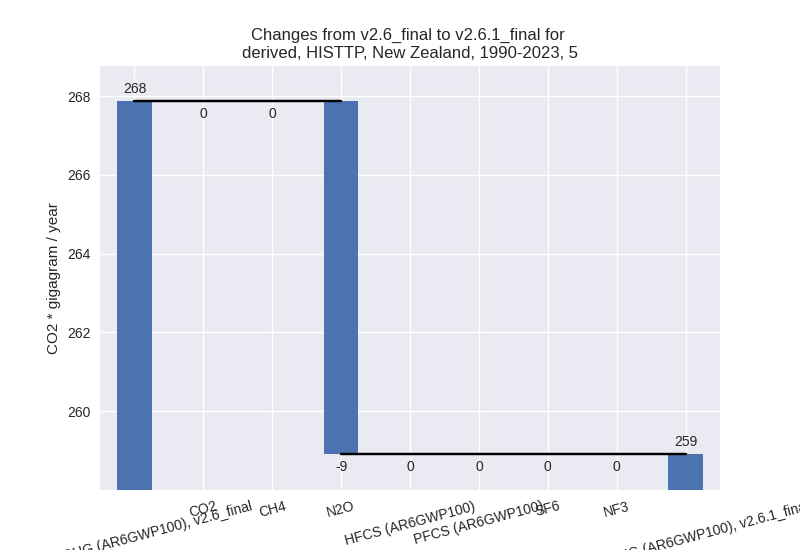
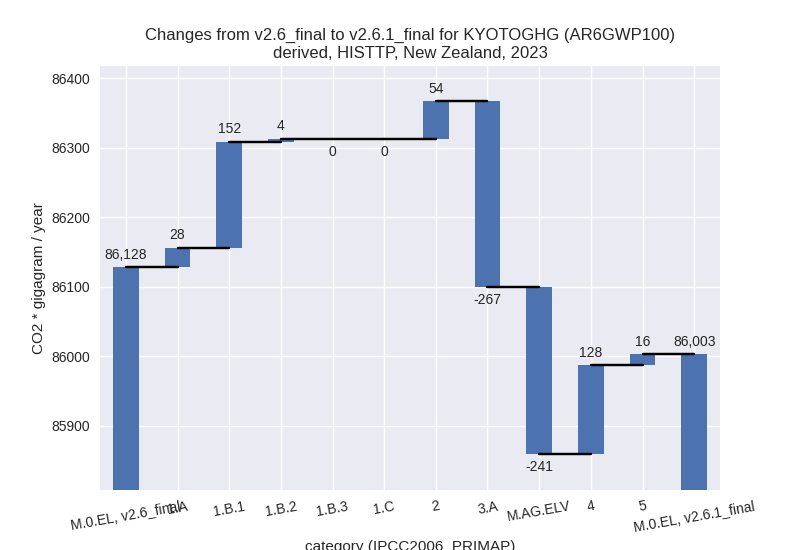
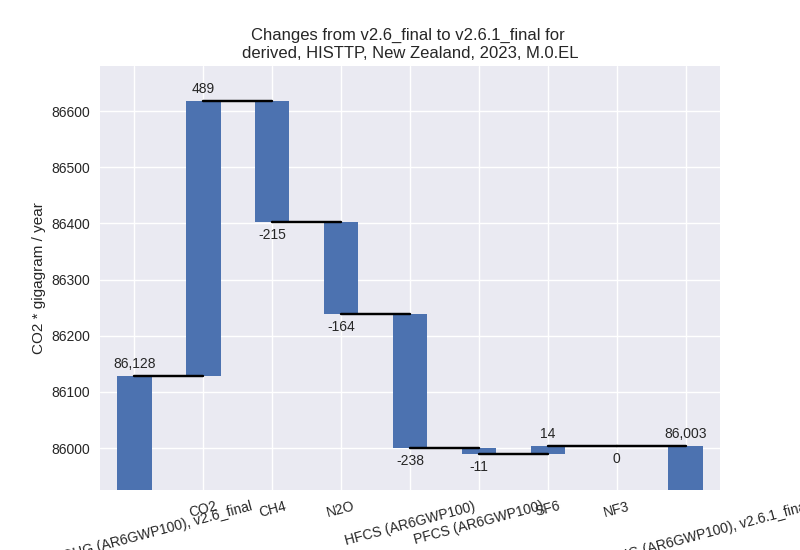
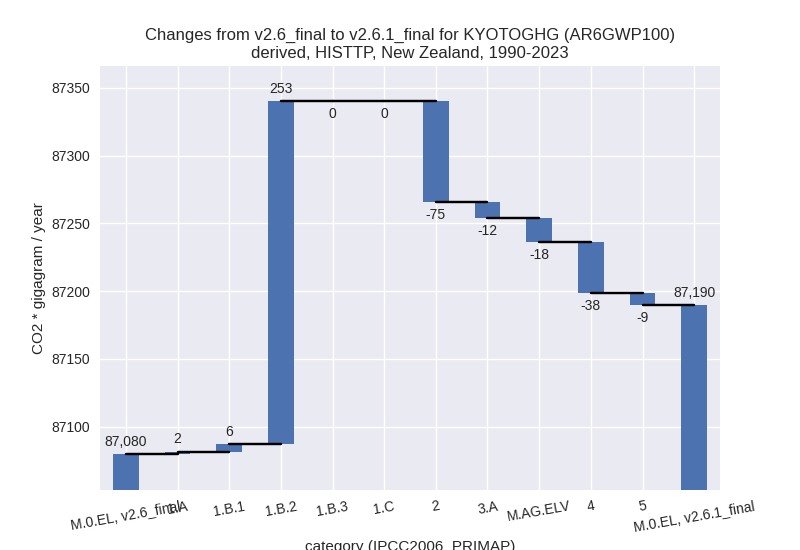
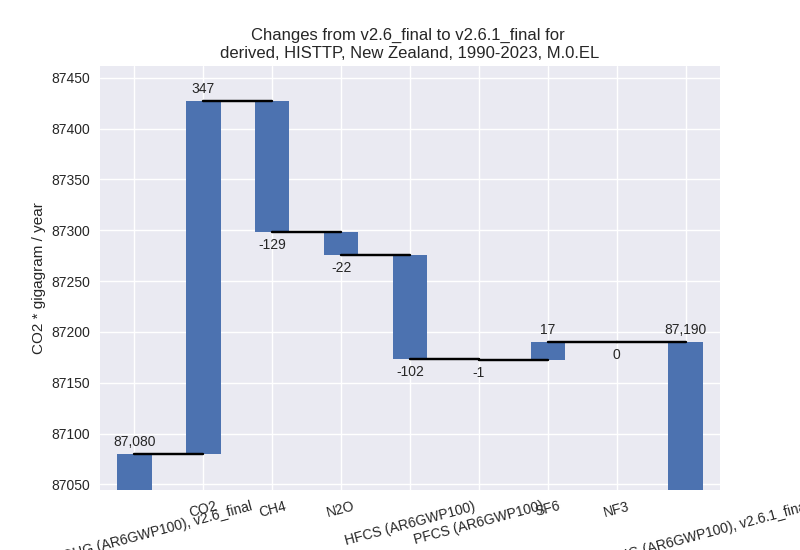
third party scenario (HISTTP):
Most important changes per time frame
For 2023 the following sector-gas combinations have the highest absolute impact on national total KyotoGHG (AR6GWP100) emissions in 2023 (top 5):
- 1: 2, CO2 with 280.56 Gg CO2 / year (13.0%)
- 2: 3.A, CH4 with -260.59 Gg CO2 / year (-0.9%)
- 3: 2, HFCS (AR6GWP100) with -238.39 Gg CO2 / year (-12.1%)
- 4: M.AG.ELV, N2O with -183.86 Gg CO2 / year (-1.5%)
- 5: 1.B.1, CO2 with 175.81 Gg CO2 / year (105.6%)
For 1990-2023 the following sector-gas combinations have the highest absolute impact on national total KyotoGHG (AR6GWP100) emissions in 1990-2023 (top 5):
- 1: 1.B.2, CO2 with 333.18 Gg CO2 / year (459.5%)
- 2: 2, HFCS (AR6GWP100) with -102.41 Gg CO2 / year (-10.9%)
- 3: 1.B.2, CH4 with -80.09 Gg CO2 / year (-10.5%)
- 4: 4, CH4 with -37.26 Gg CO2 / year (-0.8%)
- 5: 2, SF6 with 17.05 Gg CO2 / year (75.0%)
Changes in the main sectors for aggregate KyotoGHG (AR6GWP100) are
- 1: Total sectoral emissions in 2022 are 32182.08 Gg CO2 / year which is 37.9% of M.0.EL emissions. 2023 Emissions have changed by 0.6% (184.61 Gg CO2 / year). 1990-2023 Emissions have changed by 0.8% (260.44 Gg CO2 / year).
- 2: Total sectoral emissions in 2022 are 4236.13 Gg CO2 / year which is 5.0% of M.0.EL emissions. 2023 Emissions have changed by 1.3% (54.04 Gg CO2 / year). 1990-2023 Emissions have changed by -1.9% (-74.62 Gg CO2 / year).
- M.AG: Total sectoral emissions in 2022 are 43565.21 Gg CO2 / year which is 51.2% of M.0.EL emissions. 2023 Emissions have changed by -1.2% (-507.81 Gg CO2 / year). 1990-2023 Emissions have changed by -0.1% (-29.20 Gg CO2 / year).
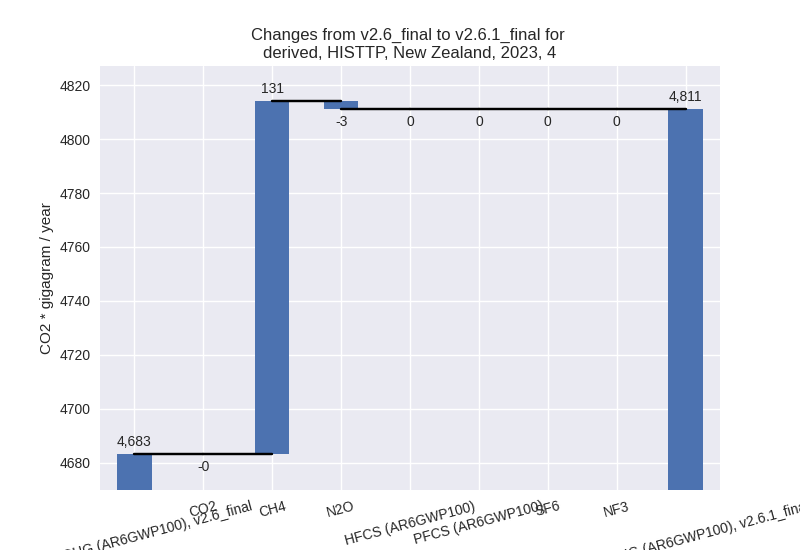
- 4: Total sectoral emissions in 2022 are 4802.37 Gg
CO2 / year which is 5.6% of M.0.EL emissions. 2023 Emissions have
changed by 2.7% (127.94 Gg CO2 /
year). 1990-2023 Emissions have changed by -0.8% (-37.60 Gg CO2 / year). For 2023 the
changes per gas
are:
- 5: Total sectoral emissions in 2022 are 230.52 Gg
CO2 / year which is 0.3% of M.0.EL emissions. 2023 Emissions have
changed by 7.2% (16.22 Gg CO2 /
year). 1990-2023 Emissions have changed by -3.3% (-8.96 Gg CO2 / year). For 2023 the
changes per gas
are:
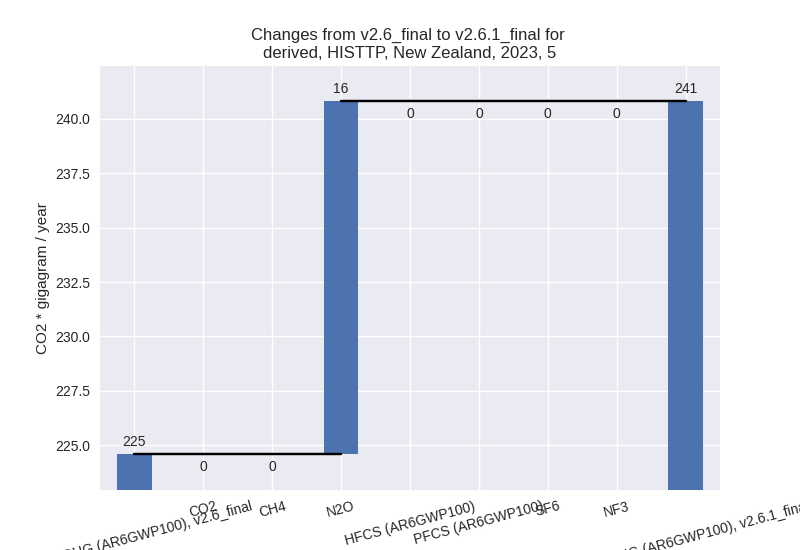
For 1990-2023 the changes per gas are: