Changes in PRIMAP-hist v2.6.1_final compared to v2.6_final for Oman
2025-03-19
Johannes Gütschow
Change analysis for Oman for PRIMAP-hist v2.6.1_final compared to v2.6_final
Overview over emissions by sector and gas
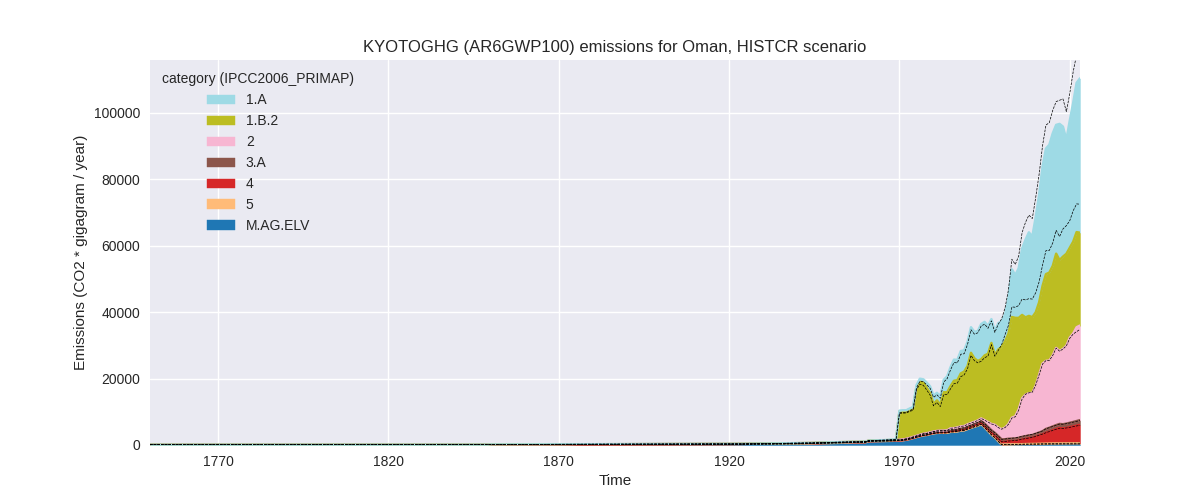
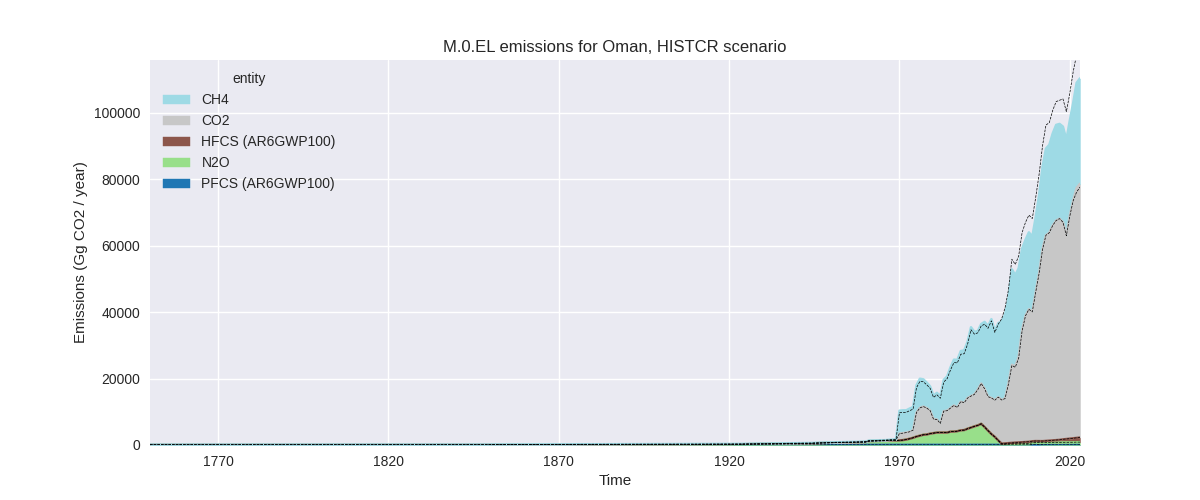
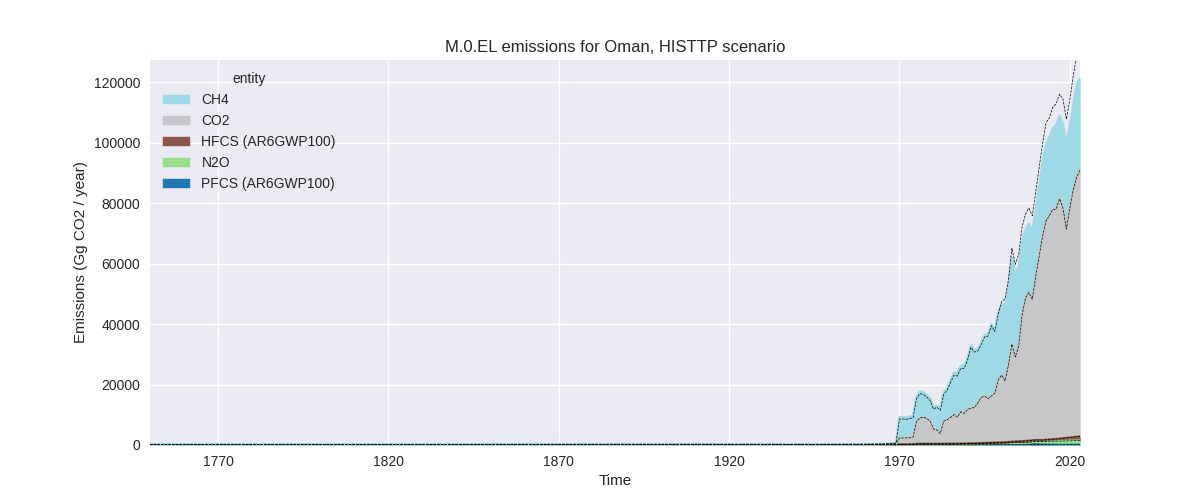
The following figures show the aggregate national total emissions excluding LULUCF AR6GWP100 for the country reported priority scenario. The dotted linesshow the v2.6_final data.
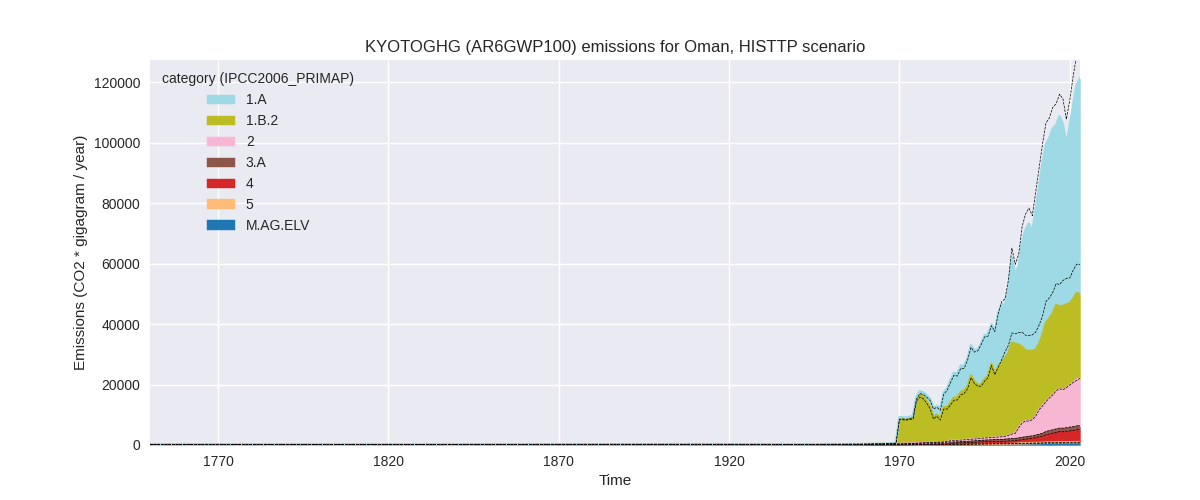
The following figures show the aggregate national total emissions excluding LULUCF AR6GWP100 for the third party priority scenario. The dotted linesshow the v2.6_final data.
Overview over changes
In the country reported priority scenario we have the following changes for aggregate Kyoto GHG and national total emissions excluding LULUCF (M.0.EL):
- Emissions in 2023 have changed by -7.2%% (-8580.56 Gg CO2 / year)
- Emissions in 1990-2023 have changed by -5.8%% (-3948.52 Gg CO2 / year)
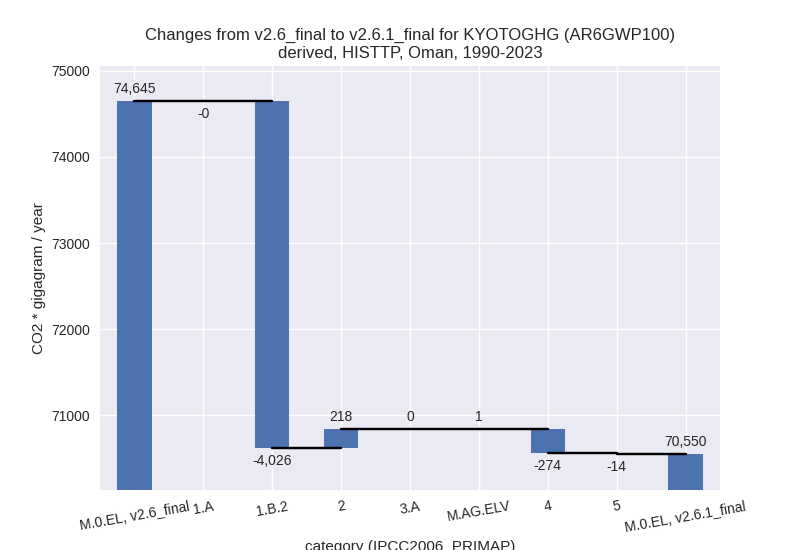
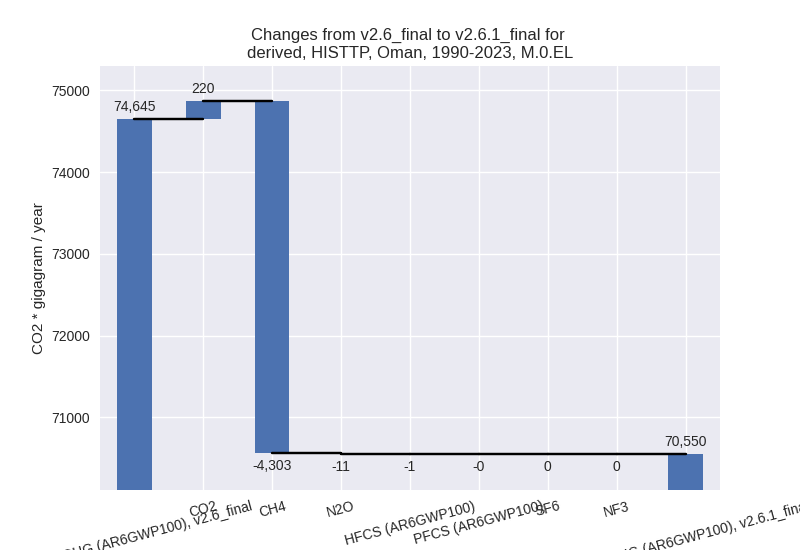
In the third party priority scenario we have the following changes for aggregate Kyoto GHG and national total emissions excluding LULUCF (M.0.EL):
- Emissions in 2023 have changed by -7.4%% (-9749.29 Gg CO2 / year)
- Emissions in 1990-2023 have changed by -5.5%% (-4095.25 Gg CO2 / year)
Most important changes per scenario and time frame
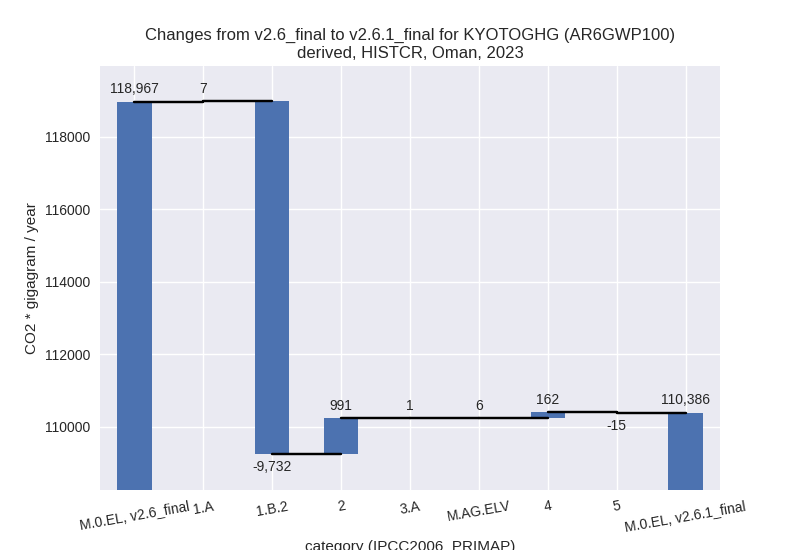
In the country reported priority scenario the following sector-gas combinations have the highest absolute impact on national total KyotoGHG (AR6GWP100) emissions in 2023 (top 5):
- 1: 1.B.2, CH4 with -9731.91 Gg CO2 / year (-28.7%)
- 2: 2, CO2 with 1027.24 Gg CO2 / year (4.0%)
- 3: 4, CH4 with 145.93 Gg CO2 / year (2.8%)
- 4: 2, CH4 with -17.83 Gg CO2 / year (-3.0%)
- 5: 4, N2O with 16.32 Gg CO2 / year (13.7%)
In the country reported priority scenario the following sector-gas combinations have the highest absolute impact on national total KyotoGHG (AR6GWP100) emissions in 1990-2023 (top 5):
- 1: 1.B.2, CH4 with -4027.99 Gg CO2 / year (-15.8%)
- 2: 2, CO2 with 119.00 Gg CO2 / year (1.1%)
- 3: 4, CH4 with -26.70 Gg CO2 / year (-1.2%)
- 4: 5, N2O with -14.18 Gg CO2 / year (-9.4%)
- 5: 4, N2O with 1.78 Gg CO2 / year (3.0%)
In the third party priority scenario the following sector-gas combinations have the highest absolute impact on national total KyotoGHG (AR6GWP100) emissions in 2023 (top 5):
- 1: 1.B.2, CH4 with -9731.91 Gg CO2 / year (-28.7%)
- 2: 2, CO2 with 381.08 Gg CO2 / year (2.9%)
- 3: 4, CH4 with -378.36 Gg CO2 / year (-9.1%)
- 4: 2, CH4 with -17.83 Gg CO2 / year (-3.0%)
- 5: 5, N2O with -15.26 Gg CO2 / year (-6.1%)
In the third party priority scenario the following sector-gas combinations have the highest absolute impact on national total KyotoGHG (AR6GWP100) emissions in 1990-2023 (top 5):
- 1: 1.B.2, CH4 with -4027.99 Gg CO2 / year (-15.8%)
- 2: 4, CH4 with -274.86 Gg CO2 / year (-15.5%)
- 3: 2, CO2 with 220.06 Gg CO2 / year (4.3%)
- 4: 5, N2O with -14.18 Gg CO2 / year (-9.4%)
- 5: 1.B.2, N2O with 1.60 Gg CO2 / year (9.1%)
Notes on data changes
Here we list notes explaining important emissions changes for the country.
- No new country reported data has been included for Oman.
- The most important changes come from CH4 in 1.B.2 where EDGAR data is used directly and CO2 in 2.A where Andrew cement data is used for extrapolation.
- Changes in the TP time-series are for the same sectors and of very similar magnitudes.
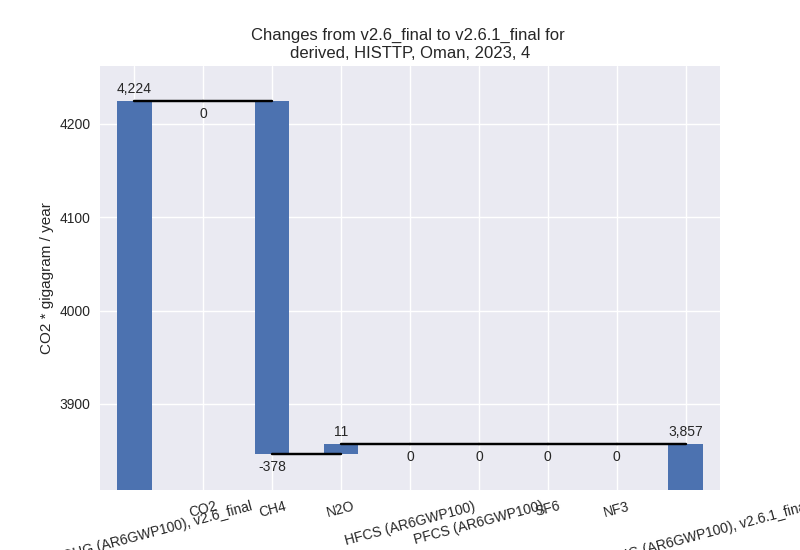
Changes by sector and gas
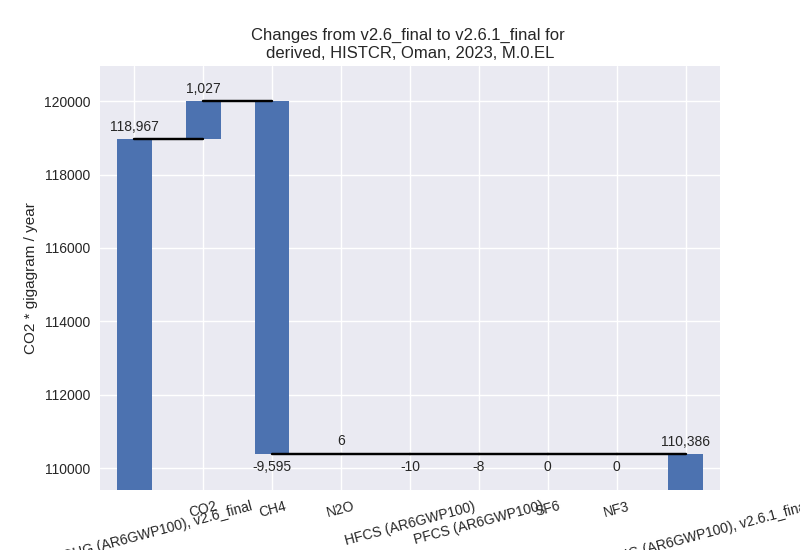
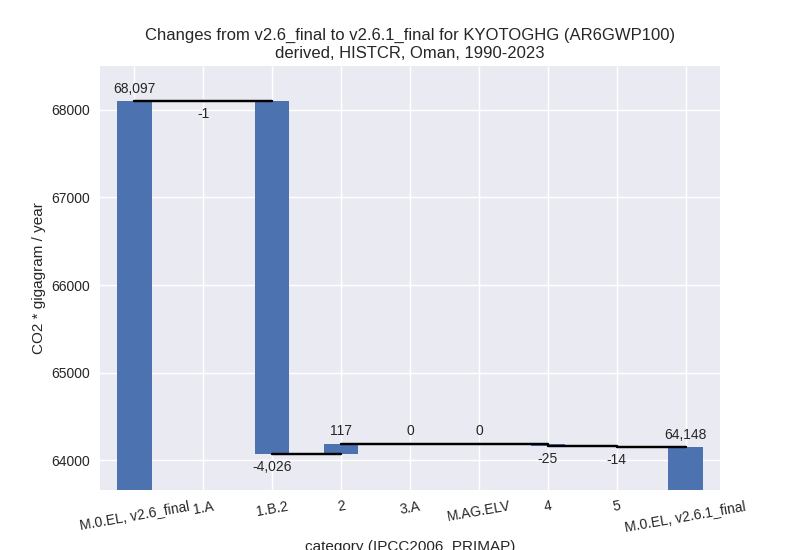
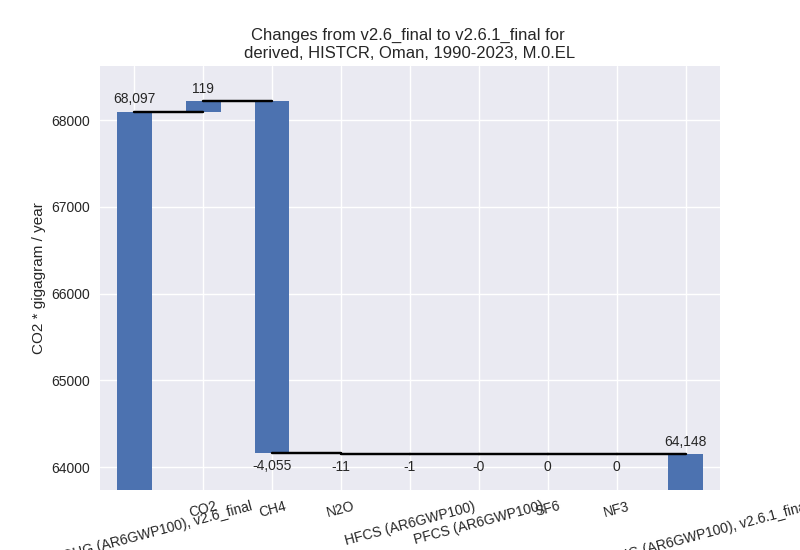
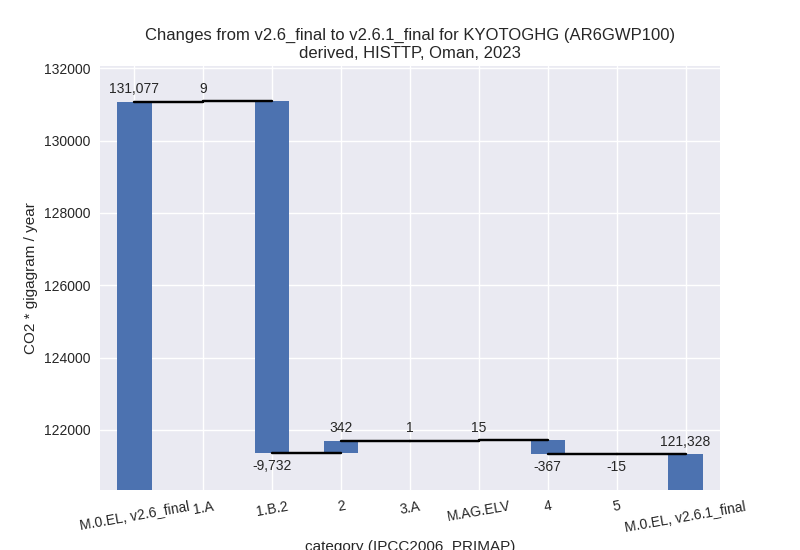
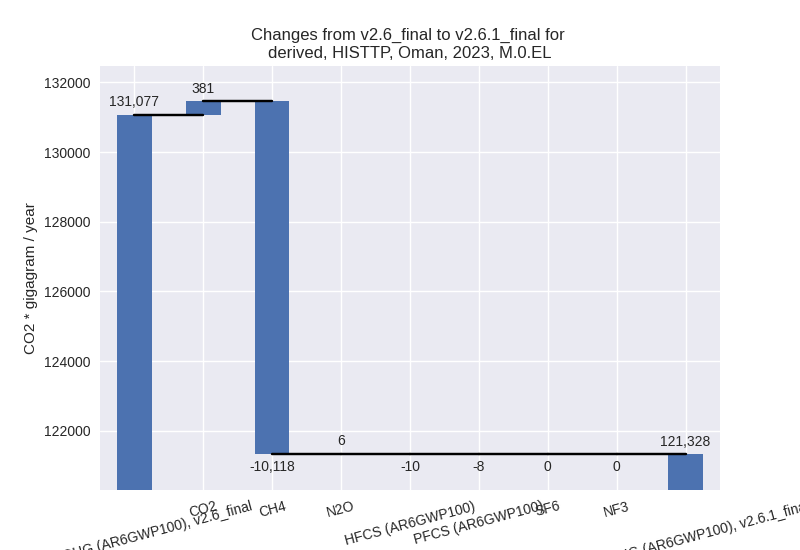
For each scenario and time frame the changes are displayed for all individual sectors and all individual gases. In the sector plot we use aggregate Kyoto GHGs in AR6GWP100. In the gas plot we usenational total emissions without LULUCF.
country reported scenario
2023
1990-2023
third party scenario
2023
1990-2023
Detailed changes for the scenarios:
country reported scenario (HISTCR):
Most important changes per time frame
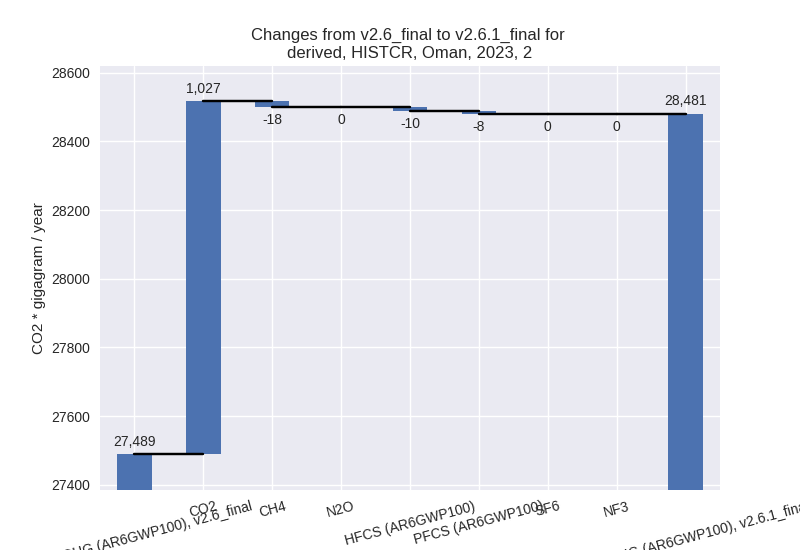
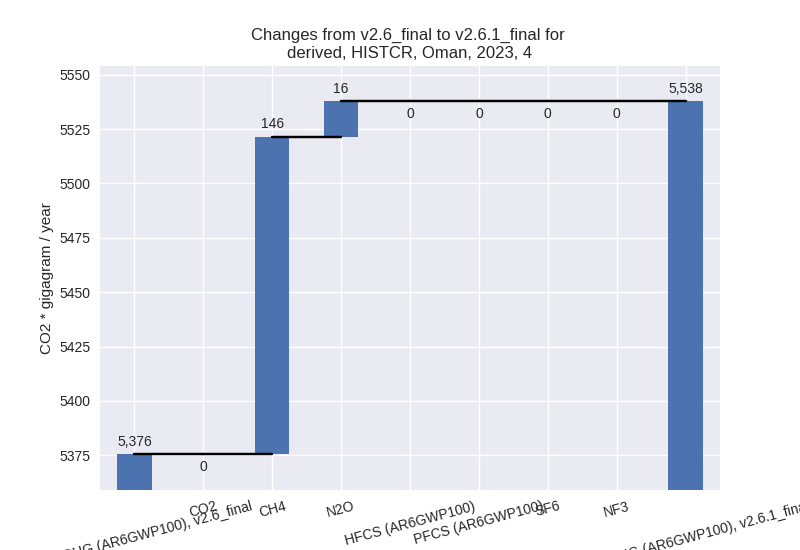
For 2023 the following sector-gas combinations have the highest absolute impact on national total KyotoGHG (AR6GWP100) emissions in 2023 (top 5):
- 1: 1.B.2, CH4 with -9731.91 Gg CO2 / year (-28.7%)
- 2: 2, CO2 with 1027.24 Gg CO2 / year (4.0%)
- 3: 4, CH4 with 145.93 Gg CO2 / year (2.8%)
- 4: 2, CH4 with -17.83 Gg CO2 / year (-3.0%)
- 5: 4, N2O with 16.32 Gg CO2 / year (13.7%)
For 1990-2023 the following sector-gas combinations have the highest absolute impact on national total KyotoGHG (AR6GWP100) emissions in 1990-2023 (top 5):
- 1: 1.B.2, CH4 with -4027.99 Gg CO2 / year (-15.8%)
- 2: 2, CO2 with 119.00 Gg CO2 / year (1.1%)
- 3: 4, CH4 with -26.70 Gg CO2 / year (-1.2%)
- 4: 5, N2O with -14.18 Gg CO2 / year (-9.4%)
- 5: 4, N2O with 1.78 Gg CO2 / year (3.0%)
Changes in the main sectors for aggregate KyotoGHG (AR6GWP100) are
- 1: Total sectoral emissions in 2022 are 73586.21 Gg
CO2 / year which is 67.5% of M.0.EL emissions. 2023 Emissions have
changed by -11.6% (-9724.98 Gg CO2 /
year). 1990-2023 Emissions have changed by -7.8% (-4027.06 Gg CO2 / year). For 2023
the changes per gas
are:

For 1990-2023 the changes per gas are: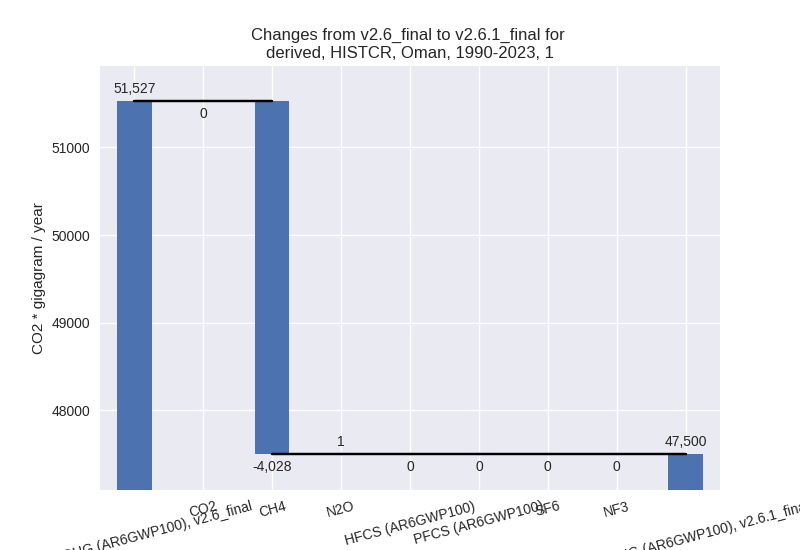
The changes come from the following subsectors:- 1.A: Total sectoral emissions in 2022 are 44944.11 Gg CO2 / year which is 61.1% of category 1 emissions. 2023 Emissions have changed by 0.0% (7.00 Gg CO2 / year). 1990-2023 Emissions have changed by -0.0% (-0.68 Gg CO2 / year).
- 1.B.2: Total sectoral emissions in 2022 are
28642.09 Gg CO2 / year which is 38.9% of category 1 emissions. 2023
Emissions have changed by -25.8%
(-9731.98 Gg CO2 / year). 1990-2023 Emissions have changed by -14.1% (-4026.38 Gg CO2 / year). For 2023
the changes per gas
are:

For 1990-2023 the changes per gas are:
There is no subsector information available in PRIMAP-hist.
- 2: Total sectoral emissions in 2022 are 28234.99 Gg
CO2 / year which is 25.9% of M.0.EL emissions. 2023 Emissions have
changed by 3.6% (991.14 Gg CO2 /
year). 1990-2023 Emissions have changed by 1.0% (117.29 Gg CO2 / year). For 2023 the
changes per gas
are:
- M.AG: Total sectoral emissions in 2022 are 1686.03 Gg CO2 / year which is 1.5% of M.0.EL emissions. 2023 Emissions have changed by 0.4% (6.27 Gg CO2 / year). 1990-2023 Emissions have changed by 0.0% (0.36 Gg CO2 / year).
- 4: Total sectoral emissions in 2022 are 5303.75 Gg
CO2 / year which is 4.9% of M.0.EL emissions. 2023 Emissions have
changed by 3.0% (162.25 Gg CO2 /
year). 1990-2023 Emissions have changed by -1.1% (-24.92 Gg CO2 / year). For 2023 the
changes per gas
are:
- 5: Total sectoral emissions in 2022 are 228.07 Gg
CO2 / year which is 0.2% of M.0.EL emissions. 2023 Emissions have
changed by -6.1% (-15.26 Gg CO2 /
year). 1990-2023 Emissions have changed by -9.4% (-14.18 Gg CO2 / year). For 2023 the
changes per gas
are:
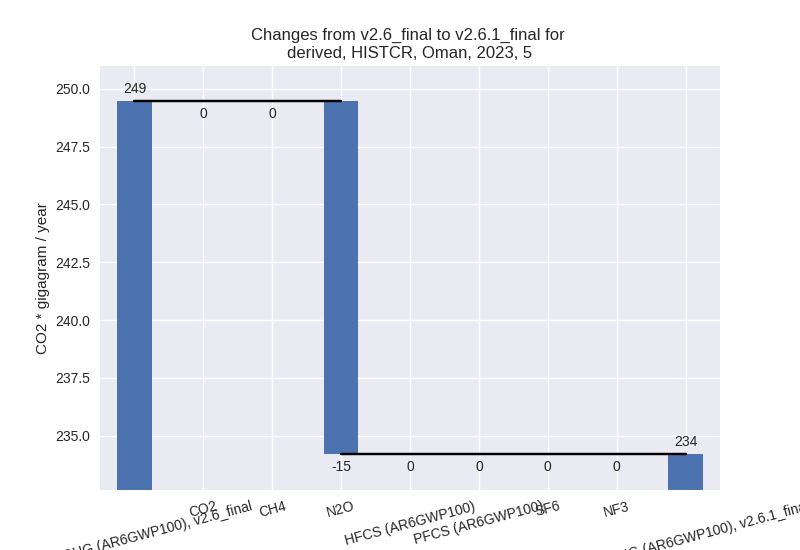
For 1990-2023 the changes per gas are:
third party scenario (HISTTP):
Most important changes per time frame
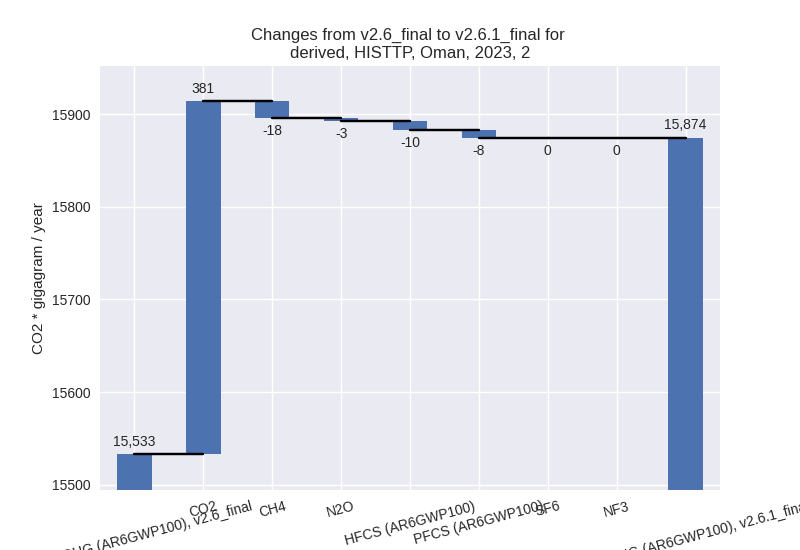
For 2023 the following sector-gas combinations have the highest absolute impact on national total KyotoGHG (AR6GWP100) emissions in 2023 (top 5):
- 1: 1.B.2, CH4 with -9731.91 Gg CO2 / year (-28.7%)
- 2: 2, CO2 with 381.08 Gg CO2 / year (2.9%)
- 3: 4, CH4 with -378.36 Gg CO2 / year (-9.1%)
- 4: 2, CH4 with -17.83 Gg CO2 / year (-3.0%)
- 5: 5, N2O with -15.26 Gg CO2 / year (-6.1%)
For 1990-2023 the following sector-gas combinations have the highest absolute impact on national total KyotoGHG (AR6GWP100) emissions in 1990-2023 (top 5):
- 1: 1.B.2, CH4 with -4027.99 Gg CO2 / year (-15.8%)
- 2: 4, CH4 with -274.86 Gg CO2 / year (-15.5%)
- 3: 2, CO2 with 220.06 Gg CO2 / year (4.3%)
- 4: 5, N2O with -14.18 Gg CO2 / year (-9.4%)
- 5: 1.B.2, N2O with 1.60 Gg CO2 / year (9.1%)
Changes in the main sectors for aggregate KyotoGHG (AR6GWP100) are
- 1: Total sectoral emissions in 2022 are 97651.79 Gg
CO2 / year which is 81.9% of M.0.EL emissions. 2023 Emissions have
changed by -8.9% (-9723.38 Gg CO2 /
year). 1990-2023 Emissions have changed by -6.2% (-4026.43 Gg CO2 / year). For 2023
the changes per gas
are:

For 1990-2023 the changes per gas are:
The changes come from the following subsectors:- 1.A: Total sectoral emissions in 2022 are 69009.70 Gg CO2 / year which is 70.7% of category 1 emissions. 2023 Emissions have changed by 0.0% (8.60 Gg CO2 / year). 1990-2023 Emissions have changed by -0.0% (-0.05 Gg CO2 / year).
- 1.B.2: Total sectoral emissions in 2022 are
28642.09 Gg CO2 / year which is 29.3% of category 1 emissions. 2023
Emissions have changed by -25.8%
(-9731.98 Gg CO2 / year). 1990-2023 Emissions have changed by -14.1% (-4026.38 Gg CO2 / year). For 2023
the changes per gas
are:

For 1990-2023 the changes per gas are:
There is no subsector information available in PRIMAP-hist.
- 2: Total sectoral emissions in 2022 are 15635.80 Gg
CO2 / year which is 13.1% of M.0.EL emissions. 2023 Emissions have
changed by 2.2% (341.54 Gg CO2 /
year). 1990-2023 Emissions have changed by 3.7% (218.25 Gg CO2 / year). For 2023 the
changes per gas
are:
For 1990-2023 the changes per gas are: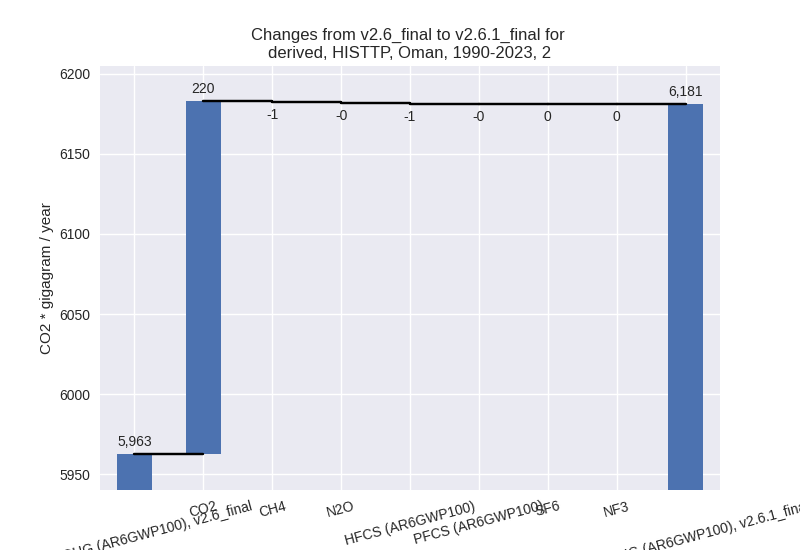
- M.AG: Total sectoral emissions in 2022 are 2020.98 Gg CO2 / year which is 1.7% of M.0.EL emissions. 2023 Emissions have changed by 0.7% (15.31 Gg CO2 / year). 1990-2023 Emissions have changed by 0.1% (0.79 Gg CO2 / year).
- 4: Total sectoral emissions in 2022 are 3693.81 Gg
CO2 / year which is 3.1% of M.0.EL emissions. 2023 Emissions have
changed by -8.7% (-367.50 Gg CO2 /
year). 1990-2023 Emissions have changed by -15.0% (-273.67 Gg CO2 / year). For 2023
the changes per gas
are:
For 1990-2023 the changes per gas are:
- 5: Total sectoral emissions in 2022 are 228.07 Gg
CO2 / year which is 0.2% of M.0.EL emissions. 2023 Emissions have
changed by -6.1% (-15.26 Gg CO2 /
year). 1990-2023 Emissions have changed by -9.4% (-14.18 Gg CO2 / year). For 2023 the
changes per gas
are:

For 1990-2023 the changes per gas are: