Changes in PRIMAP-hist v2.6.1_final compared to v2.6_final for Pakistan
2025-03-19
Johannes Gütschow
Change analysis for Pakistan for PRIMAP-hist v2.6.1_final compared to v2.6_final
Overview over emissions by sector and gas
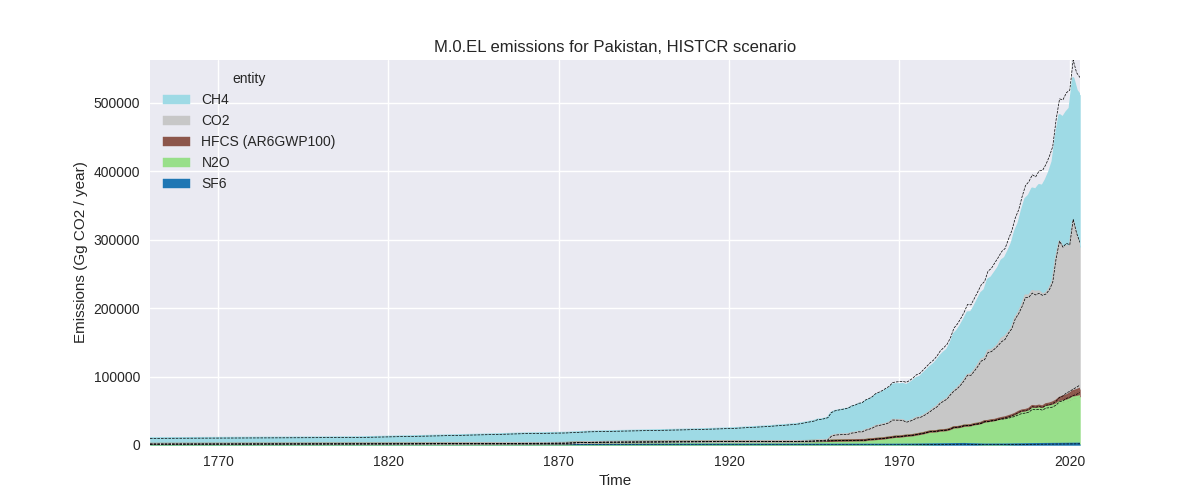
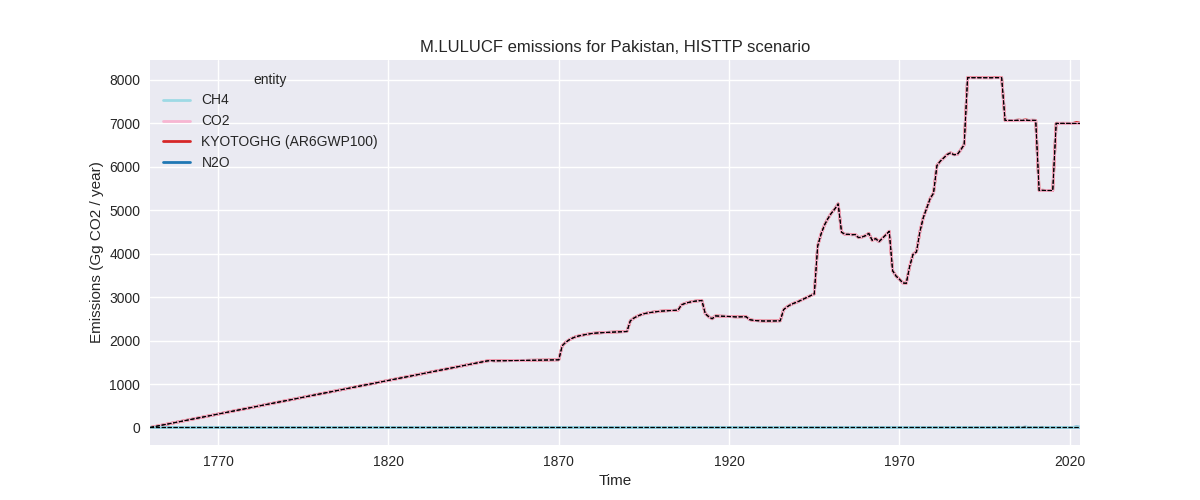
The following figures show the aggregate national total emissions excluding LULUCF AR6GWP100 for the country reported priority scenario. The dotted linesshow the v2.6_final data.

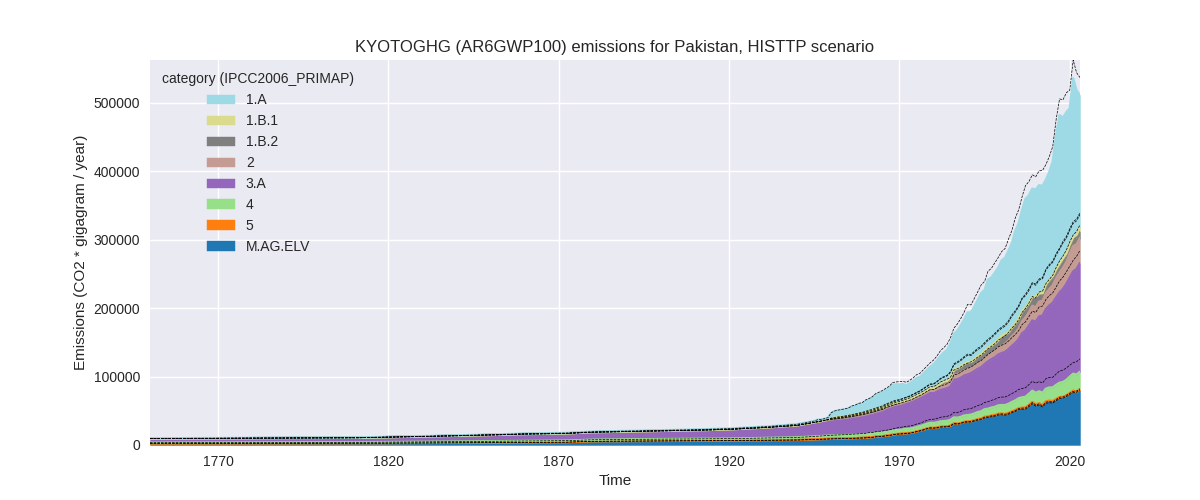
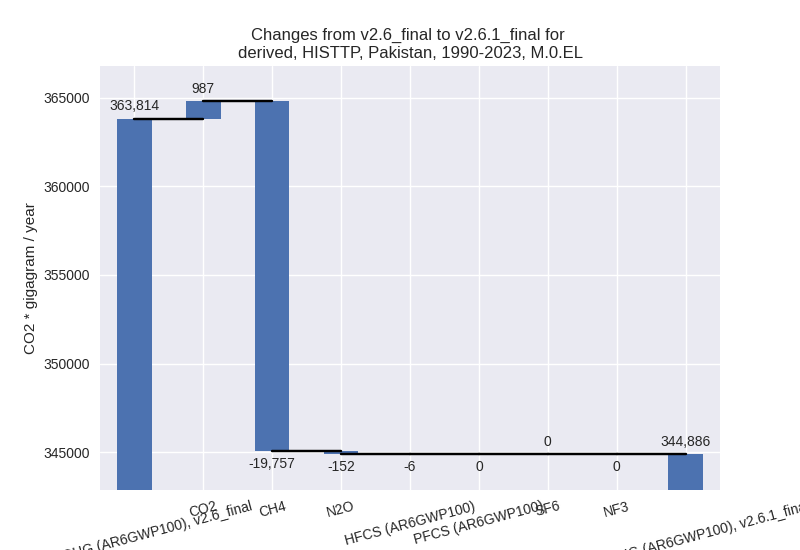
The following figures show the aggregate national total emissions excluding LULUCF AR6GWP100 for the third party priority scenario. The dotted linesshow the v2.6_final data.

Overview over changes
In the country reported priority scenario we have the following changes for aggregate Kyoto GHG and national total emissions excluding LULUCF (M.0.EL):
- Emissions in 2023 have changed by -4.8%% (-25743.25 Gg CO2 / year)
- Emissions in 1990-2023 have changed by -5.2%% (-18927.43 Gg CO2 / year)
In the third party priority scenario we have the following changes for aggregate Kyoto GHG and national total emissions excluding LULUCF (M.0.EL):
- Emissions in 2023 have changed by -4.8%% (-25743.25 Gg CO2 / year)
- Emissions in 1990-2023 have changed by -5.2%% (-18927.43 Gg CO2 / year)
Most important changes per scenario and time frame
In the country reported priority scenario the following sector-gas combinations have the highest absolute impact on national total KyotoGHG (AR6GWP100) emissions in 2023 (top 5):
- 1: 4, CH4 with -18288.87 Gg CO2 / year (-44.4%)
- 2: 1.B.2, CH4 with -4955.93 Gg CO2 / year (-34.5%)
- 3: 1.A, N2O with -4942.15 Gg CO2 / year (-58.2%)
- 4: 1.B.1, CH4 with 2966.08 Gg CO2 / year (117.0%)
- 5: M.AG.ELV, CH4 with 778.29 Gg CO2 / year (5.6%)
In the country reported priority scenario the following sector-gas combinations have the highest absolute impact on national total KyotoGHG (AR6GWP100) emissions in 1990-2023 (top 5):
- 1: 4, CH4 with -13818.53 Gg CO2 / year (-49.1%)
- 2: 1.B.2, CH4 with -6220.92 Gg CO2 / year (-40.1%)
- 3: 1.B.2, CO2 with 1031.25 Gg CO2 / year (418.3%)
- 4: 1.A, N2O with -665.44 Gg CO2 / year (-18.8%)
- 5: M.AG.ELV, N2O with 469.12 Gg CO2 / year (1.2%)
In the third party priority scenario the following sector-gas combinations have the highest absolute impact on national total KyotoGHG (AR6GWP100) emissions in 2023 (top 5):
- 1: 4, CH4 with -18288.87 Gg CO2 / year (-44.4%)
- 2: 1.B.2, CH4 with -4955.93 Gg CO2 / year (-34.5%)
- 3: 1.A, N2O with -4942.15 Gg CO2 / year (-58.2%)
- 4: 1.B.1, CH4 with 2966.08 Gg CO2 / year (117.0%)
- 5: M.AG.ELV, CH4 with 778.29 Gg CO2 / year (5.6%)
In the third party priority scenario the following sector-gas combinations have the highest absolute impact on national total KyotoGHG (AR6GWP100) emissions in 1990-2023 (top 5):
- 1: 4, CH4 with -13818.53 Gg CO2 / year (-49.1%)
- 2: 1.B.2, CH4 with -6220.92 Gg CO2 / year (-40.1%)
- 3: 1.B.2, CO2 with 1031.25 Gg CO2 / year (418.3%)
- 4: 1.A, N2O with -665.44 Gg CO2 / year (-18.8%)
- 5: M.AG.ELV, N2O with 469.12 Gg CO2 / year (1.2%)
Notes on data changes
Here we list notes explaining important emissions changes for the country.
- There is no usable country reported data for Pakistan, thus the CR and TP time-series are identical.
- Changes in the both time-series come from updated EDGAR and FAO data. FAO has adjusted data for the latest years while EDGAR has updated full time-series with the main change coming from the waste sector.
Changes by sector and gas
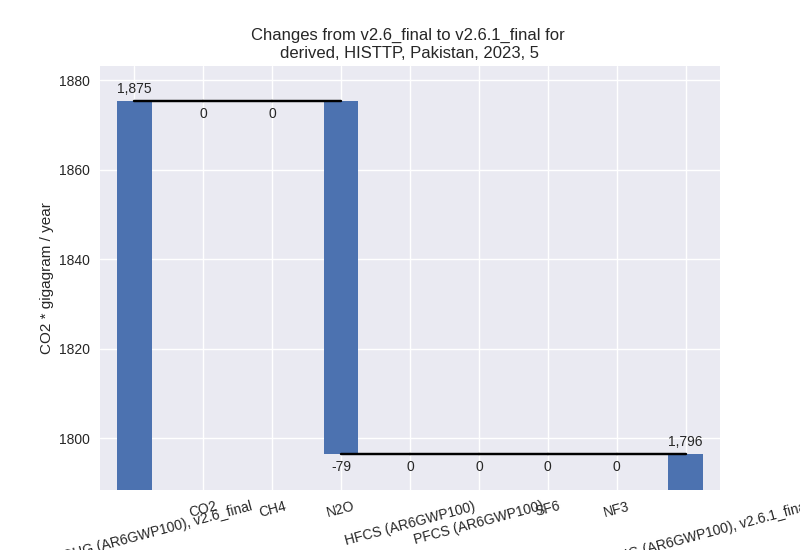
For each scenario and time frame the changes are displayed for all individual sectors and all individual gases. In the sector plot we use aggregate Kyoto GHGs in AR6GWP100. In the gas plot we usenational total emissions without LULUCF.
country reported scenario
2023

1990-2023


third party scenario
2023

1990-2023
Detailed changes for the scenarios:
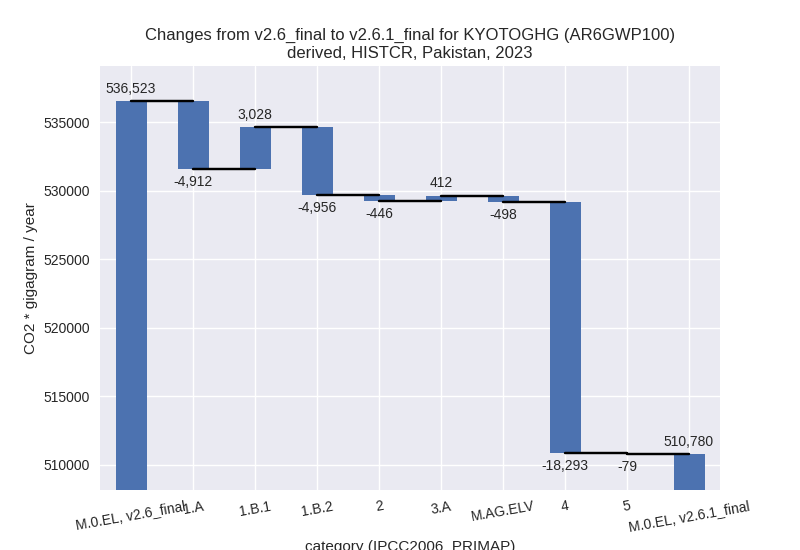
country reported scenario (HISTCR):
Most important changes per time frame
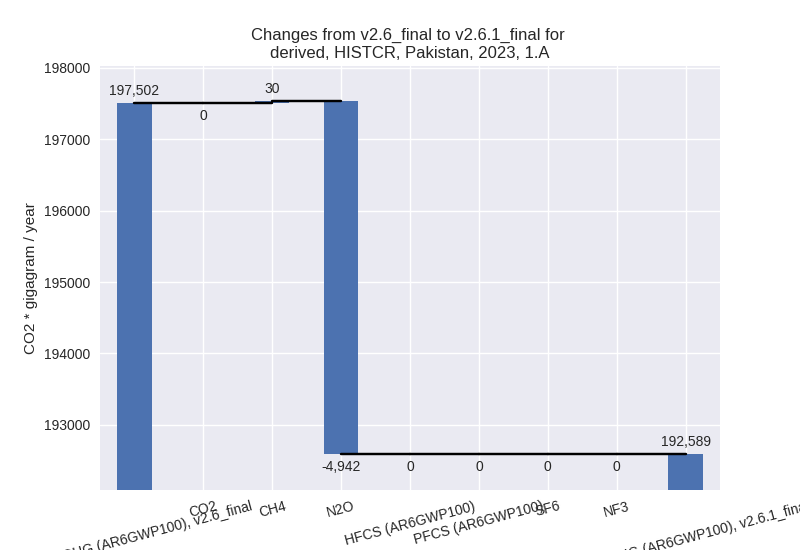
For 2023 the following sector-gas combinations have the highest absolute impact on national total KyotoGHG (AR6GWP100) emissions in 2023 (top 5):
- 1: 4, CH4 with -18288.87 Gg CO2 / year (-44.4%)
- 2: 1.B.2, CH4 with -4955.93 Gg CO2 / year (-34.5%)
- 3: 1.A, N2O with -4942.15 Gg CO2 / year (-58.2%)
- 4: 1.B.1, CH4 with 2966.08 Gg CO2 / year (117.0%)
- 5: M.AG.ELV, CH4 with 778.29 Gg CO2 / year (5.6%)
For 1990-2023 the following sector-gas combinations have the highest absolute impact on national total KyotoGHG (AR6GWP100) emissions in 1990-2023 (top 5):
- 1: 4, CH4 with -13818.53 Gg CO2 / year (-49.1%)
- 2: 1.B.2, CH4 with -6220.92 Gg CO2 / year (-40.1%)
- 3: 1.B.2, CO2 with 1031.25 Gg CO2 / year (418.3%)
- 4: 1.A, N2O with -665.44 Gg CO2 / year (-18.8%)
- 5: M.AG.ELV, N2O with 469.12 Gg CO2 / year (1.2%)
Changes in the main sectors for aggregate KyotoGHG (AR6GWP100) are
- 1: Total sectoral emissions in 2022 are 224278.73
Gg CO2 / year which is 43.3% of M.0.EL emissions. 2023 Emissions have
changed by -3.2% (-6839.99 Gg CO2 /
year). 1990-2023 Emissions have changed by -3.5% (-5703.69 Gg CO2 / year). For 2023
the changes per gas
are:

For 1990-2023 the changes per gas are:
The changes come from the following subsectors:- 1.A: Total sectoral emissions in 2022 are 210427.20
Gg CO2 / year which is 93.8% of category 1 emissions. 2023 Emissions
have changed by -2.5% (-4912.50 Gg
CO2 / year). 1990-2023 Emissions have changed by -0.4% (-640.42 Gg CO2 / year). For 2023
the changes per gas
are:
There is no subsector information available in PRIMAP-hist. - 1.B.1: Total sectoral emissions in 2022 are 3672.07
Gg CO2 / year which is 1.6% of category 1 emissions. 2023 Emissions have
changed by 117.4% (3028.04 Gg CO2 /
year). 1990-2023 Emissions have changed by 6.3% (126.11 Gg CO2 / year). For 2023 the
changes per gas
are:

For 1990-2023 the changes per gas are: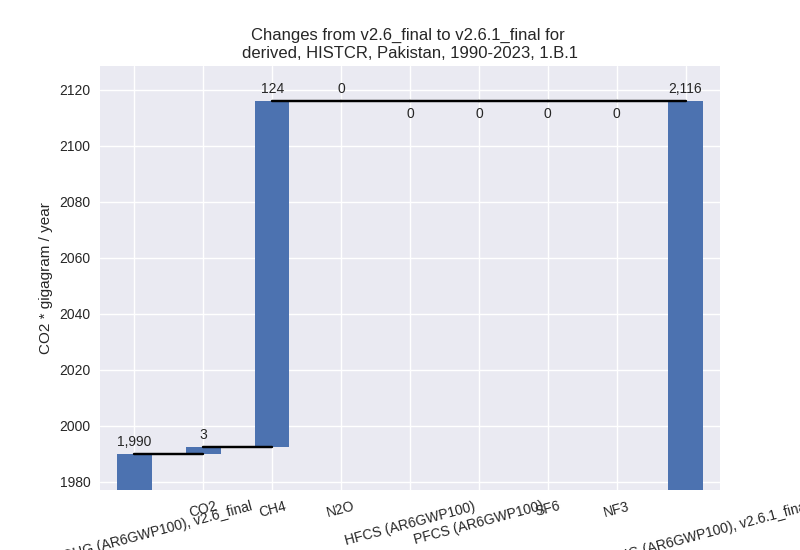
There is no subsector information available in PRIMAP-hist. - 1.B.2: Total sectoral emissions in 2022 are
10179.46 Gg CO2 / year which is 4.5% of category 1 emissions. 2023
Emissions have changed by -33.3%
(-4955.52 Gg CO2 / year). 1990-2023 Emissions have changed by -32.9% (-5189.38 Gg CO2 / year). For 2023
the changes per gas
are:

For 1990-2023 the changes per gas are: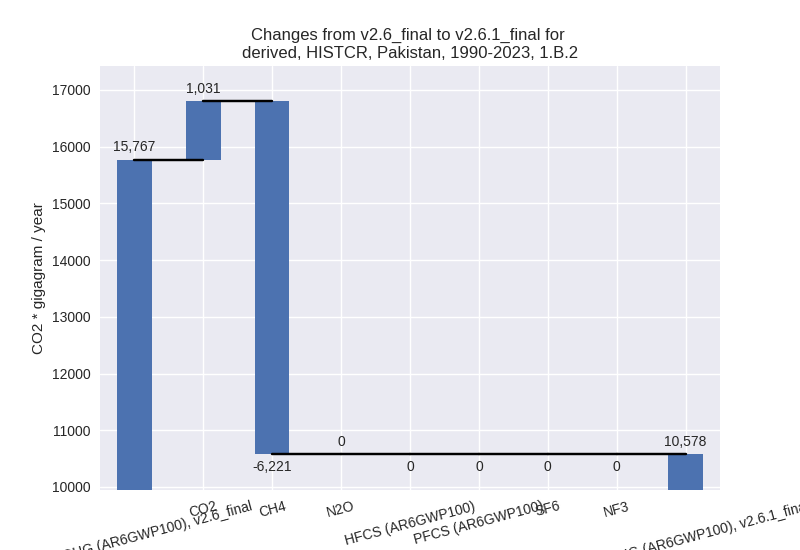
There is no subsector information available in PRIMAP-hist.
- 1.A: Total sectoral emissions in 2022 are 210427.20
Gg CO2 / year which is 93.8% of category 1 emissions. 2023 Emissions
have changed by -2.5% (-4912.50 Gg
CO2 / year). 1990-2023 Emissions have changed by -0.4% (-640.42 Gg CO2 / year). For 2023
the changes per gas
are:
- 2: Total sectoral emissions in 2022 are 36125.91 Gg CO2 / year which is 7.0% of M.0.EL emissions. 2023 Emissions have changed by -1.2% (-445.74 Gg CO2 / year). 1990-2023 Emissions have changed by -0.1% (-12.91 Gg CO2 / year).
- M.AG: Total sectoral emissions in 2022 are 230038.28 Gg CO2 / year which is 44.5% of M.0.EL emissions. 2023 Emissions have changed by -0.0% (-85.97 Gg CO2 / year). 1990-2023 Emissions have changed by 0.4% (633.00 Gg CO2 / year).
- 4: Total sectoral emissions in 2022 are 25010.91 Gg
CO2 / year which is 4.8% of M.0.EL emissions. 2023 Emissions have
changed by -41.8% (-18292.60 Gg CO2
/ year). 1990-2023 Emissions have changed by -46.3% (-13819.34 Gg CO2 / year). For 2023
the changes per gas
are:

For 1990-2023 the changes per gas are:
- 5: Total sectoral emissions in 2022 are 1913.94 Gg
CO2 / year which is 0.4% of M.0.EL emissions. 2023 Emissions have
changed by -4.2% (-78.95 Gg CO2 /
year). 1990-2023 Emissions have changed by -1.6% (-24.48 Gg CO2 / year). For 2023 the
changes per gas
are:

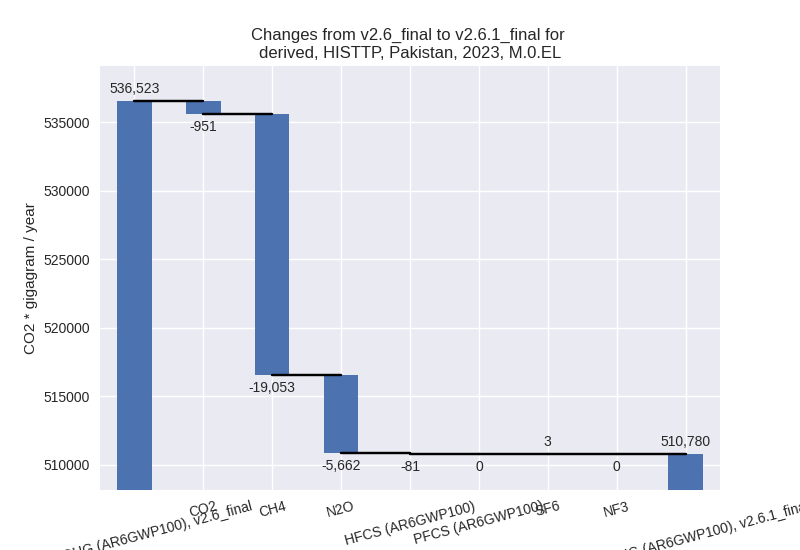
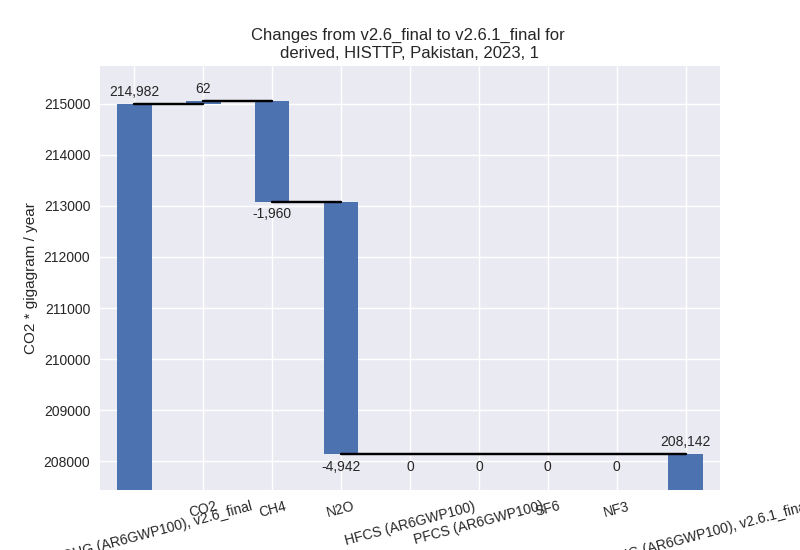
third party scenario (HISTTP):
Most important changes per time frame
For 2023 the following sector-gas combinations have the highest absolute impact on national total KyotoGHG (AR6GWP100) emissions in 2023 (top 5):
- 1: 4, CH4 with -18288.87 Gg CO2 / year (-44.4%)
- 2: 1.B.2, CH4 with -4955.93 Gg CO2 / year (-34.5%)
- 3: 1.A, N2O with -4942.15 Gg CO2 / year (-58.2%)
- 4: 1.B.1, CH4 with 2966.08 Gg CO2 / year (117.0%)
- 5: M.AG.ELV, CH4 with 778.29 Gg CO2 / year (5.6%)
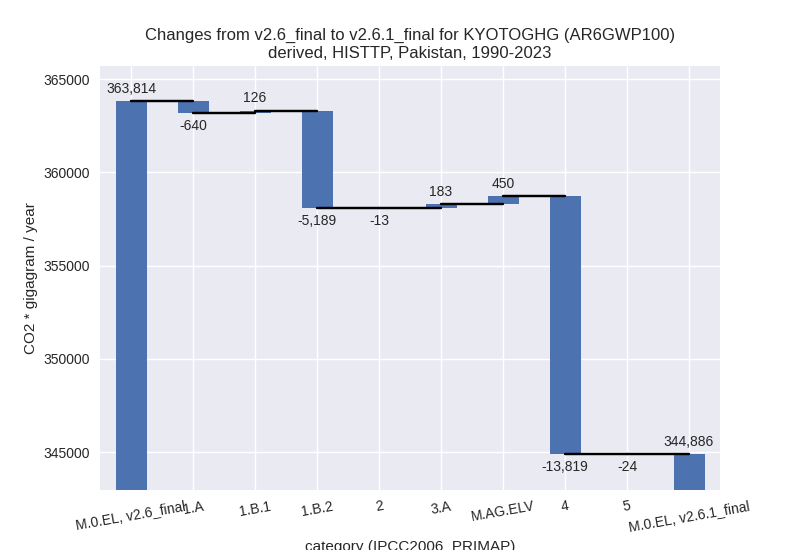
For 1990-2023 the following sector-gas combinations have the highest absolute impact on national total KyotoGHG (AR6GWP100) emissions in 1990-2023 (top 5):
- 1: 4, CH4 with -13818.53 Gg CO2 / year (-49.1%)
- 2: 1.B.2, CH4 with -6220.92 Gg CO2 / year (-40.1%)
- 3: 1.B.2, CO2 with 1031.25 Gg CO2 / year (418.3%)
- 4: 1.A, N2O with -665.44 Gg CO2 / year (-18.8%)
- 5: M.AG.ELV, N2O with 469.12 Gg CO2 / year (1.2%)
Changes in the main sectors for aggregate KyotoGHG (AR6GWP100) are
- 1: Total sectoral emissions in 2022 are 224278.73
Gg CO2 / year which is 43.3% of M.0.EL emissions. 2023 Emissions have
changed by -3.2% (-6839.99 Gg CO2 /
year). 1990-2023 Emissions have changed by -3.5% (-5703.69 Gg CO2 / year). For 2023
the changes per gas
are:
For 1990-2023 the changes per gas are: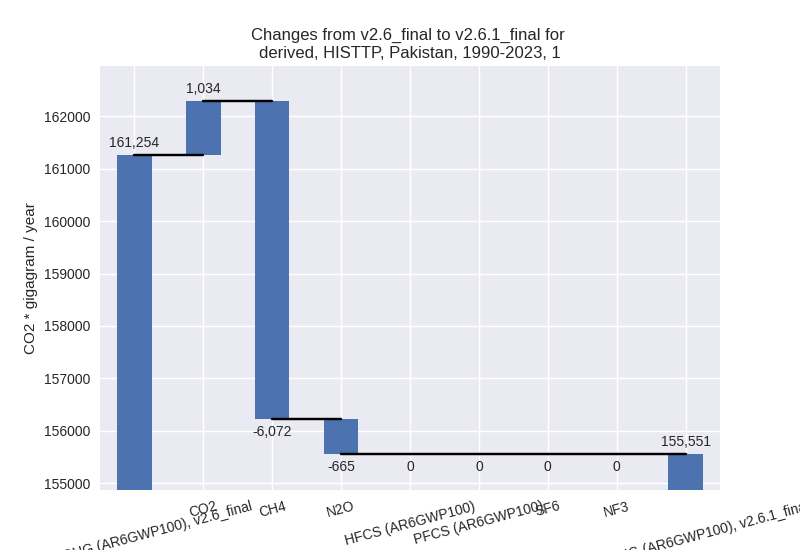
The changes come from the following subsectors:- 1.A: Total sectoral emissions in 2022 are 210427.20
Gg CO2 / year which is 93.8% of category 1 emissions. 2023 Emissions
have changed by -2.5% (-4912.50 Gg
CO2 / year). 1990-2023 Emissions have changed by -0.4% (-640.42 Gg CO2 / year). For 2023
the changes per gas
are:

There is no subsector information available in PRIMAP-hist. - 1.B.1: Total sectoral emissions in 2022 are 3672.07
Gg CO2 / year which is 1.6% of category 1 emissions. 2023 Emissions have
changed by 117.4% (3028.04 Gg CO2 /
year). 1990-2023 Emissions have changed by 6.3% (126.11 Gg CO2 / year). For 2023 the
changes per gas
are:

For 1990-2023 the changes per gas are:
There is no subsector information available in PRIMAP-hist. - 1.B.2: Total sectoral emissions in 2022 are
10179.46 Gg CO2 / year which is 4.5% of category 1 emissions. 2023
Emissions have changed by -33.3%
(-4955.52 Gg CO2 / year). 1990-2023 Emissions have changed by -32.9% (-5189.38 Gg CO2 / year). For 2023
the changes per gas
are:
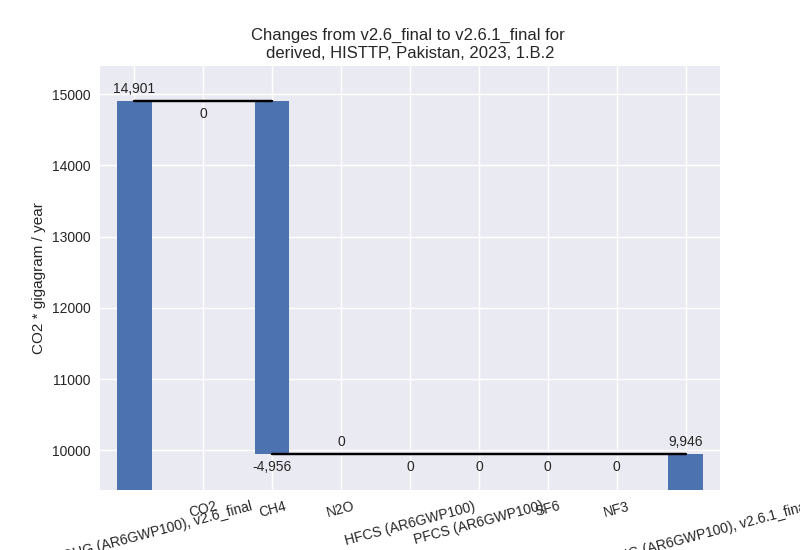
For 1990-2023 the changes per gas are:
There is no subsector information available in PRIMAP-hist.
- 1.A: Total sectoral emissions in 2022 are 210427.20
Gg CO2 / year which is 93.8% of category 1 emissions. 2023 Emissions
have changed by -2.5% (-4912.50 Gg
CO2 / year). 1990-2023 Emissions have changed by -0.4% (-640.42 Gg CO2 / year). For 2023
the changes per gas
are:
- 2: Total sectoral emissions in 2022 are 36125.91 Gg CO2 / year which is 7.0% of M.0.EL emissions. 2023 Emissions have changed by -1.2% (-445.74 Gg CO2 / year). 1990-2023 Emissions have changed by -0.1% (-12.91 Gg CO2 / year).
- M.AG: Total sectoral emissions in 2022 are 230038.28 Gg CO2 / year which is 44.5% of M.0.EL emissions. 2023 Emissions have changed by -0.0% (-85.97 Gg CO2 / year). 1990-2023 Emissions have changed by 0.4% (633.00 Gg CO2 / year).
- 4: Total sectoral emissions in 2022 are 25010.91 Gg
CO2 / year which is 4.8% of M.0.EL emissions. 2023 Emissions have
changed by -41.8% (-18292.60 Gg CO2
/ year). 1990-2023 Emissions have changed by -46.3% (-13819.34 Gg CO2 / year). For 2023
the changes per gas
are:

For 1990-2023 the changes per gas are:
- 5: Total sectoral emissions in 2022 are 1913.94 Gg
CO2 / year which is 0.4% of M.0.EL emissions. 2023 Emissions have
changed by -4.2% (-78.95 Gg CO2 /
year). 1990-2023 Emissions have changed by -1.6% (-24.48 Gg CO2 / year). For 2023 the
changes per gas
are: