Changes in PRIMAP-hist v2.6.1_final compared to v2.6_final for Panama
2025-03-19
Johannes Gütschow
Change analysis for Panama for PRIMAP-hist v2.6.1_final compared to v2.6_final
Overview over emissions by sector and gas
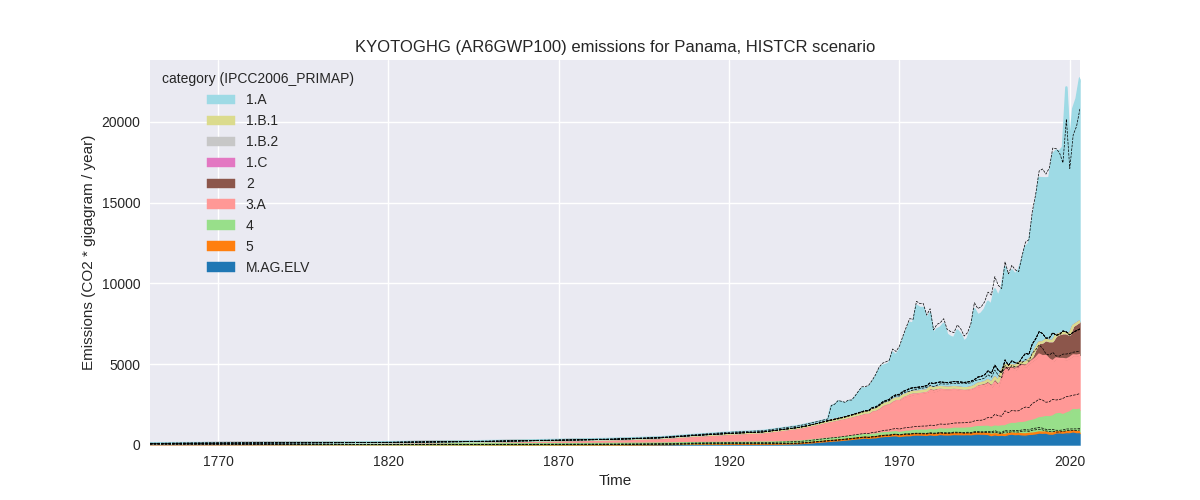
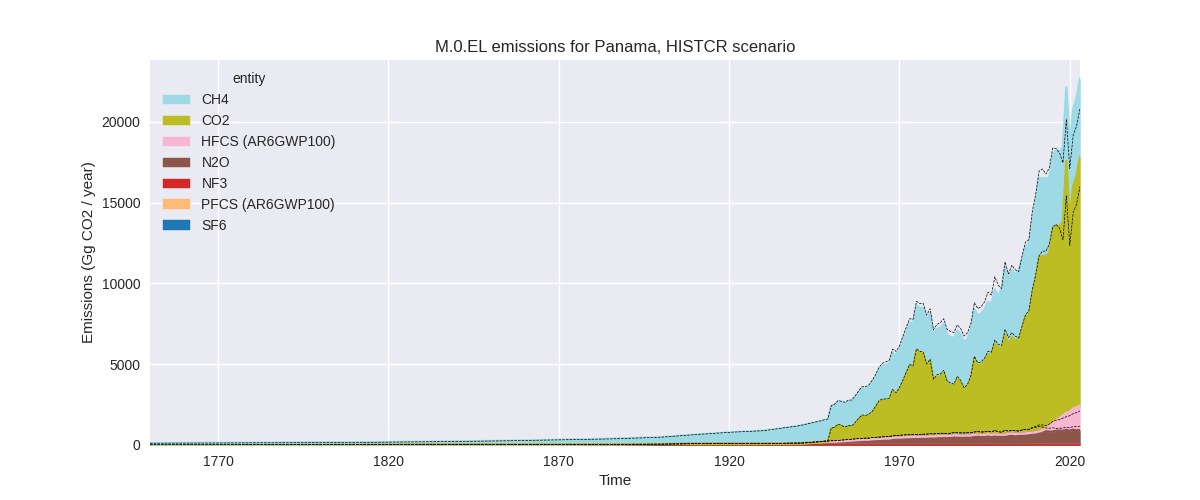
The following figures show the aggregate national total emissions excluding LULUCF AR6GWP100 for the country reported priority scenario. The dotted linesshow the v2.6_final data.
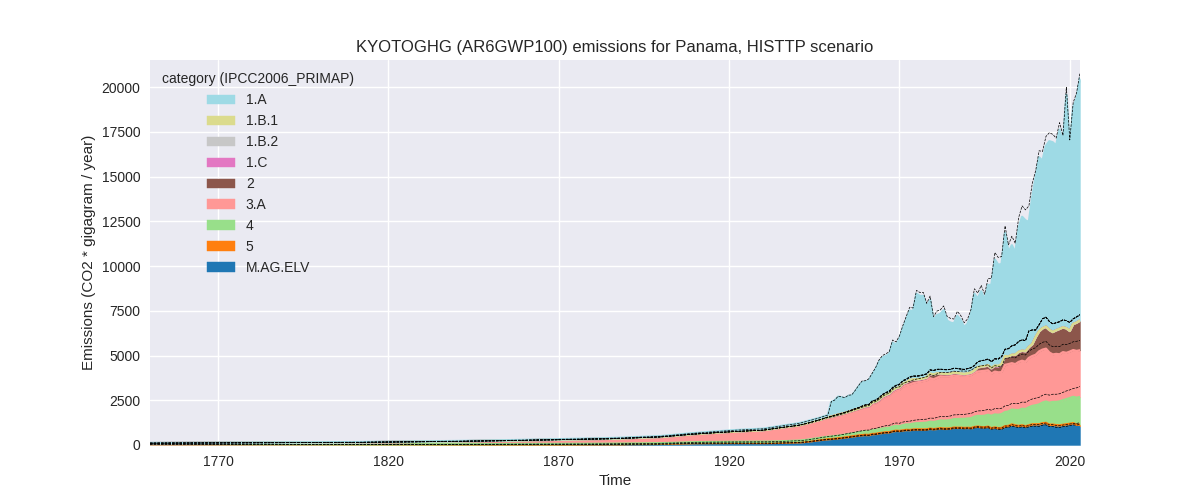
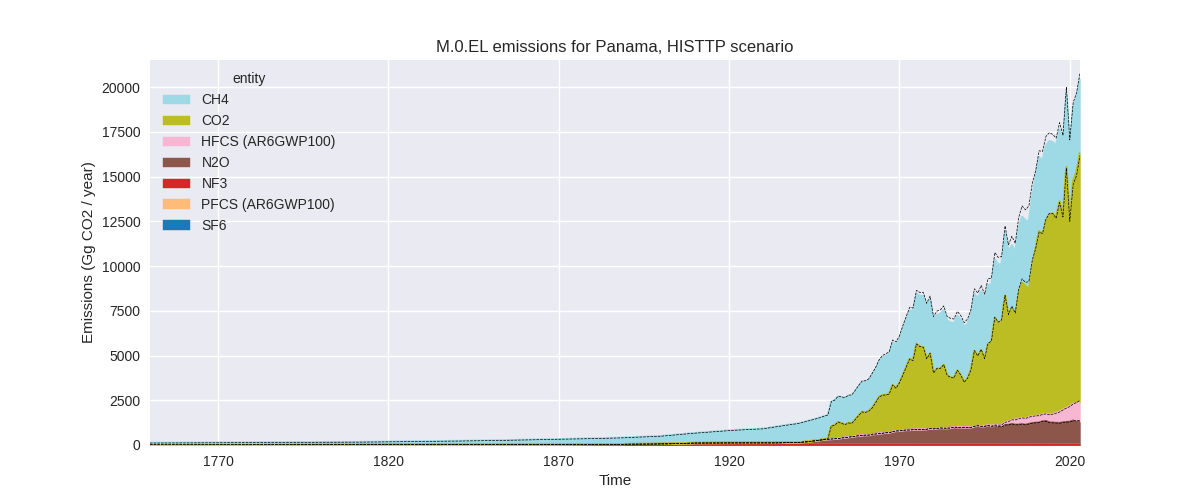
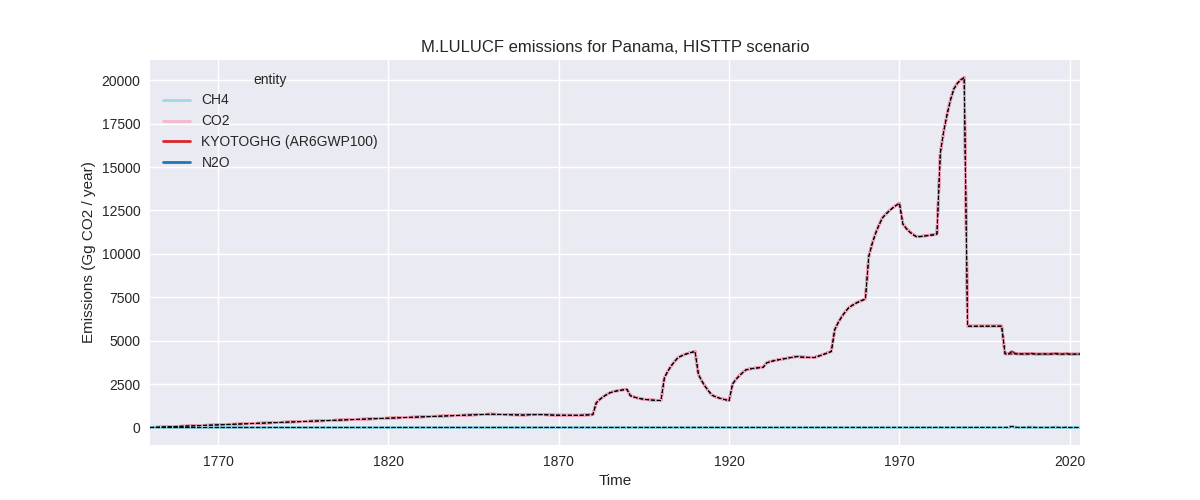
The following figures show the aggregate national total emissions excluding LULUCF AR6GWP100 for the third party priority scenario. The dotted linesshow the v2.6_final data.
Overview over changes
In the country reported priority scenario we have the following changes for aggregate Kyoto GHG and national total emissions excluding LULUCF (M.0.EL):
- Emissions in 2023 have changed by 9.0%% (1864.94 Gg CO2 / year)
- Emissions in 1990-2023 have changed by -0.3%% (-33.90 Gg CO2 / year)
In the third party priority scenario we have the following changes for aggregate Kyoto GHG and national total emissions excluding LULUCF (M.0.EL):
- Emissions in 2023 have changed by -1.5%% (-304.07 Gg CO2 / year)
- Emissions in 1990-2023 have changed by -3.3%% (-442.75 Gg CO2 / year)
Most important changes per scenario and time frame
In the country reported priority scenario the following sector-gas combinations have the highest absolute impact on national total KyotoGHG (AR6GWP100) emissions in 2023 (top 5):
- 1: 1.A, CO2 with 1354.77 Gg CO2 / year (10.1%)
- 2: 4, CH4 with -797.66 Gg CO2 / year (-38.5%)
- 3: 3.A, CH4 with 783.64 Gg CO2 / year (30.9%)
- 4: 2, HFCS (AR6GWP100) with 582.72 Gg CO2 / year (62.2%)
- 5: M.AG.ELV, N2O with -253.53 Gg CO2 / year (-30.8%)
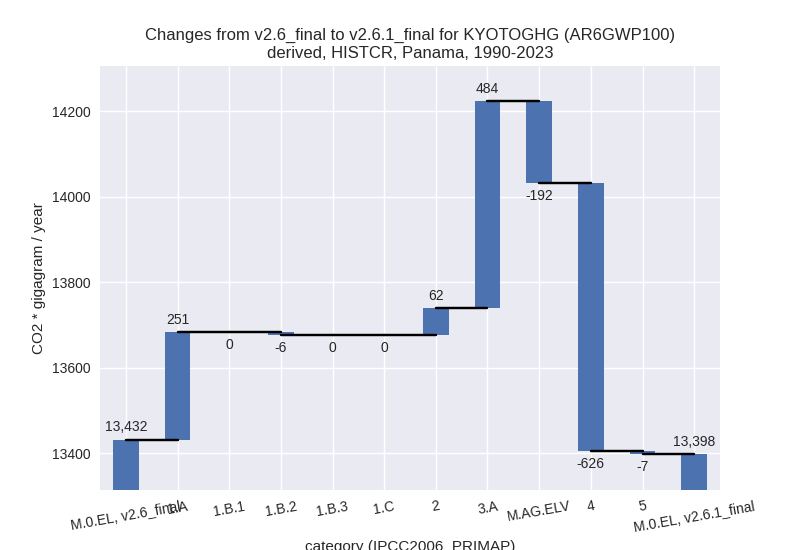
In the country reported priority scenario the following sector-gas combinations have the highest absolute impact on national total KyotoGHG (AR6GWP100) emissions in 1990-2023 (top 5):
- 1: 4, CH4 with -623.41 Gg CO2 / year (-47.0%)
- 2: 3.A, CH4 with 488.87 Gg CO2 / year (18.2%)
- 3: 1.A, CO2 with 252.66 Gg CO2 / year (3.3%)
- 4: M.AG.ELV, N2O with -192.45 Gg CO2 / year (-27.7%)
- 5: 2, HFCS (AR6GWP100) with 90.31 Gg CO2 / year (44.7%)
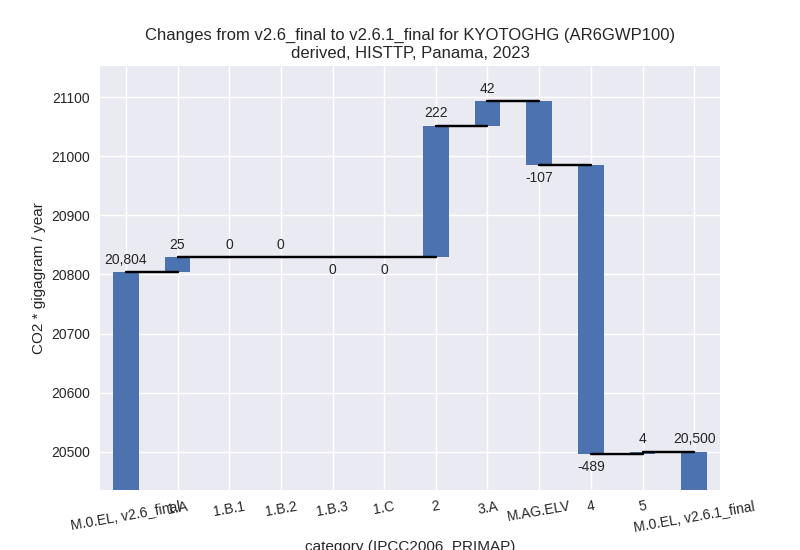
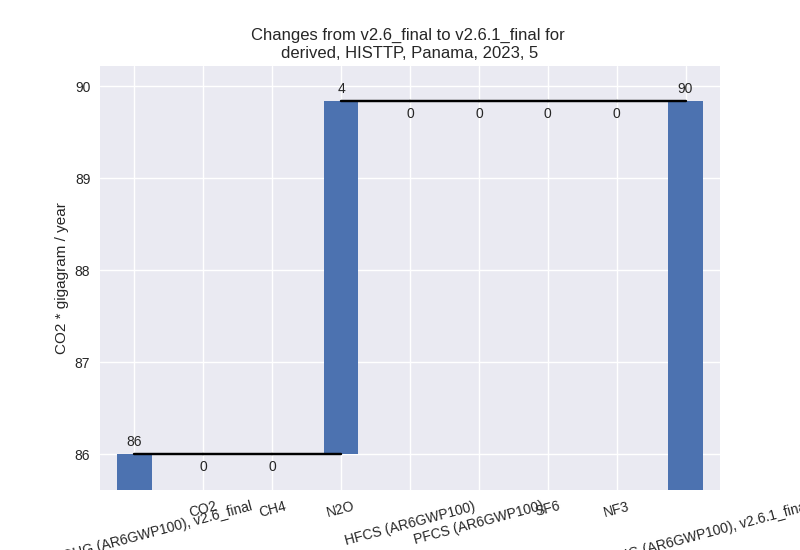
In the third party priority scenario the following sector-gas combinations have the highest absolute impact on national total KyotoGHG (AR6GWP100) emissions in 2023 (top 5):
- 1: 4, CH4 with -513.96 Gg CO2 / year (-26.2%)
- 2: 2, CO2 with 212.53 Gg CO2 / year (63.2%)
- 3: M.AG.ELV, N2O with -126.38 Gg CO2 / year (-11.5%)
- 4: 3.A, CH4 with 40.66 Gg CO2 / year (1.6%)
- 5: 4, CO2 with 25.24 Gg CO2 / year (inf%)
In the third party priority scenario the following sector-gas combinations have the highest absolute impact on national total KyotoGHG (AR6GWP100) emissions in 1990-2023 (top 5):
- 1: 4, CH4 with -387.09 Gg CO2 / year (-29.3%)
- 2: 2, CO2 with -69.86 Gg CO2 / year (-14.9%)
- 3: M.AG.ELV, CO2 with 8.82 Gg CO2 / year (181.7%)
- 4: 4, CO2 with 8.45 Gg CO2 / year (inf%)
- 5: 2, SF6 with 7.75 Gg CO2 / year (inf%)
Notes on data changes
Here we list notes explaining important emissions changes for the country.
- CRT data from BTR1 covering 2000-2021 has been included. It replaces
and extends NIR data (2017) and BUR2 data (2000-2016). BUR2 data for
1994-1999 is still in use for some sectors and gases. Others are
inconsistent and not used (waste CH4, M.AG.ELV (N2O, CH4), and SF6 in
IPPU).
- Changes in the CR time-series for 2023 partly cancel. They come from the extension of CR time-series which replaces third party growth rates (1.A, CO2) and updated data for the full time span (e.g. 3.A, CH4; 4, CH4; 2, HFCs; M.AG.ELV, N2O)
- For cumulative emissions CO2 in 1.A plays a smaller role as the changes are most pronounced in the last years.
- Changes in the TP time-series come from updated EDGAR, FAO and cement data. FAO and cement data have been adjusted for the latest years while EDGAR has updated full time-series with the main change coming from the waste sector.
Changes by sector and gas
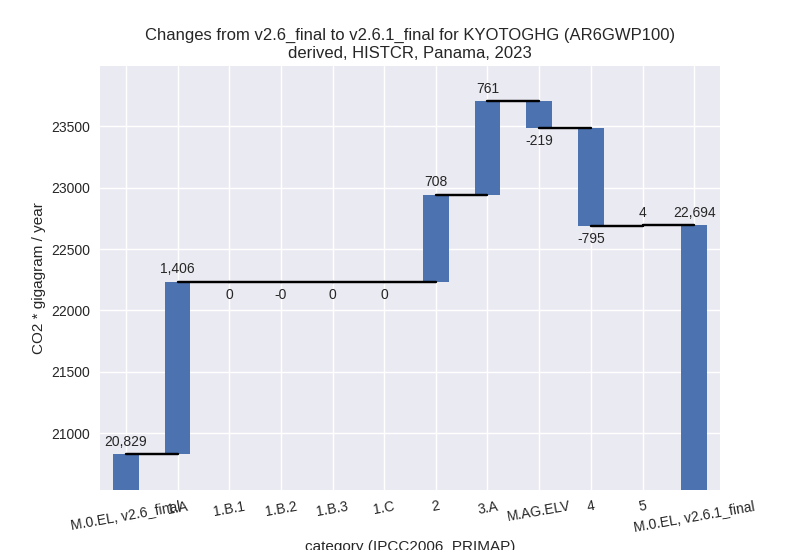
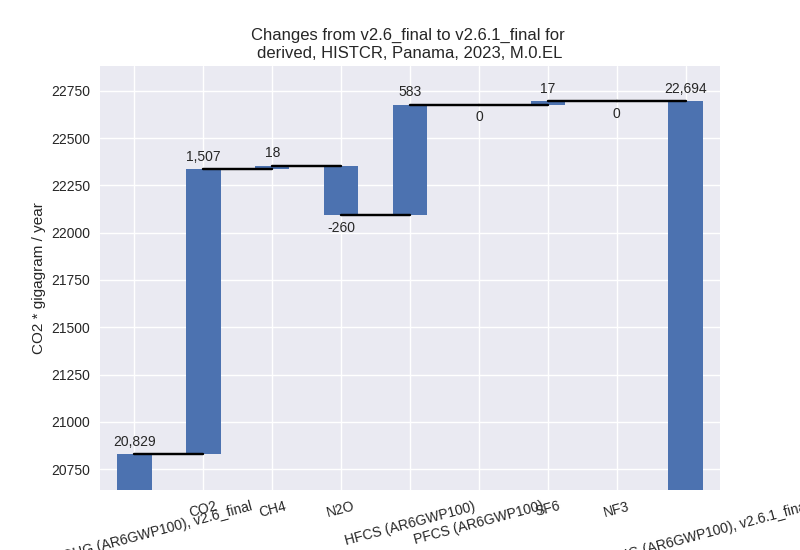
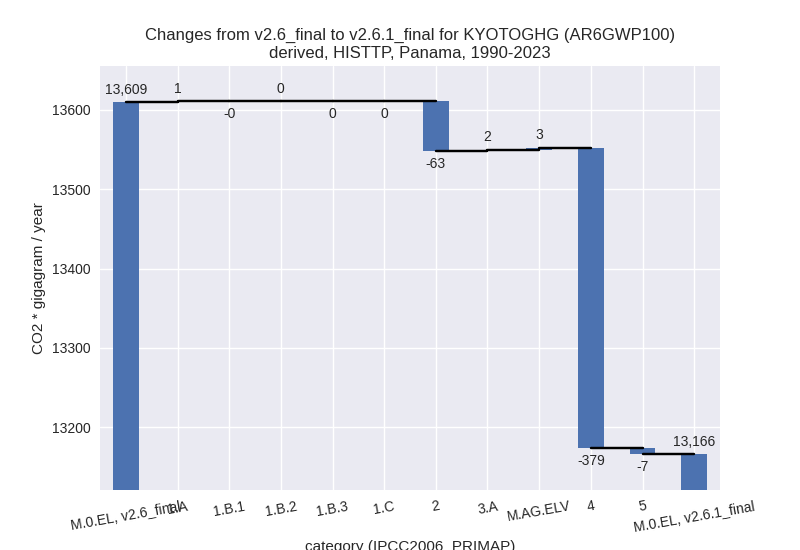
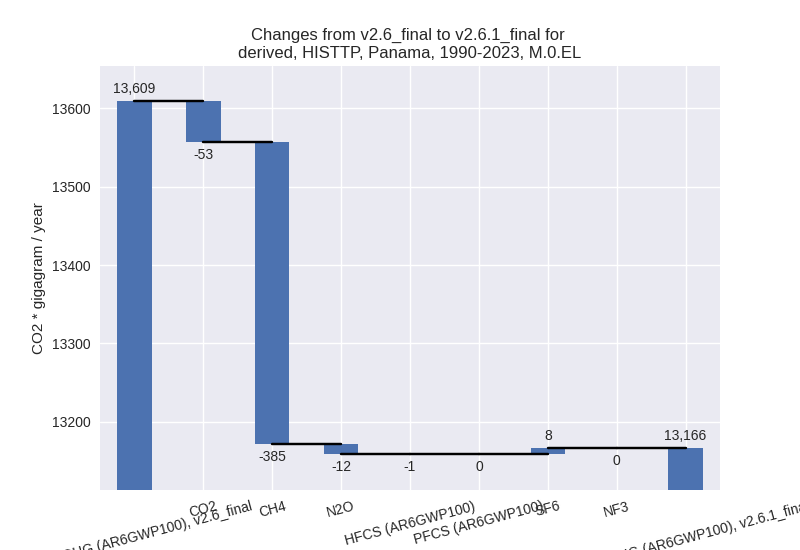
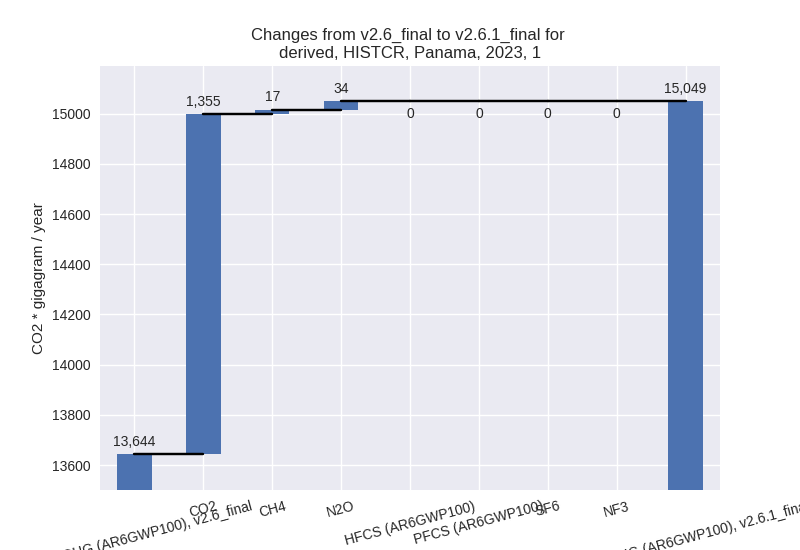
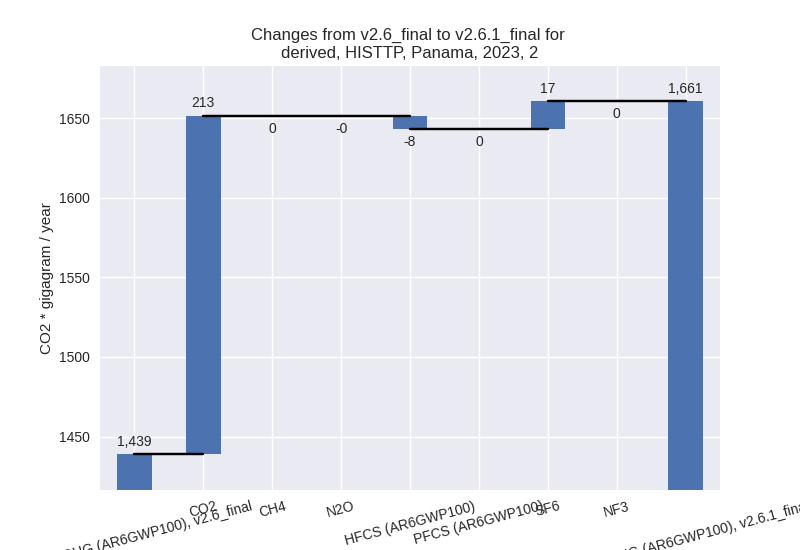
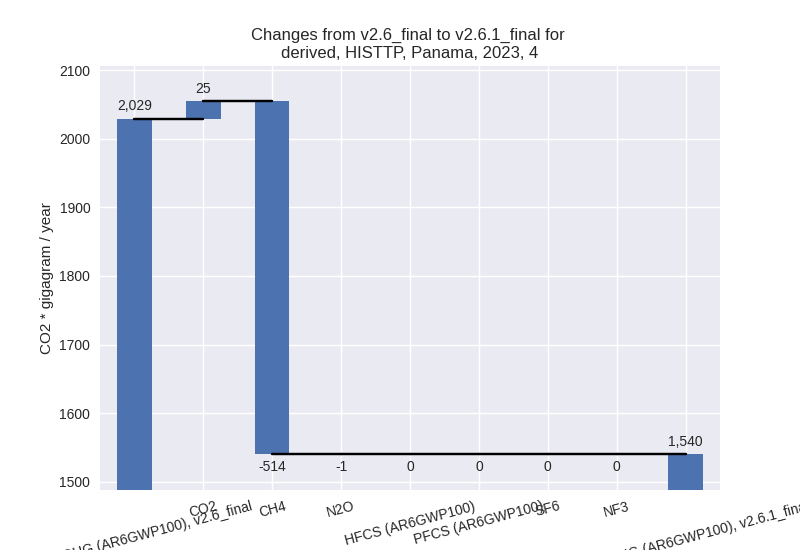
For each scenario and time frame the changes are displayed for all individual sectors and all individual gases. In the sector plot we use aggregate Kyoto GHGs in AR6GWP100. In the gas plot we usenational total emissions without LULUCF.
country reported scenario
2023
1990-2023
third party scenario
2023
1990-2023
Detailed changes for the scenarios:
country reported scenario (HISTCR):
Most important changes per time frame
For 2023 the following sector-gas combinations have the highest absolute impact on national total KyotoGHG (AR6GWP100) emissions in 2023 (top 5):
- 1: 1.A, CO2 with 1354.77 Gg CO2 / year (10.1%)
- 2: 4, CH4 with -797.66 Gg CO2 / year (-38.5%)
- 3: 3.A, CH4 with 783.64 Gg CO2 / year (30.9%)
- 4: 2, HFCS (AR6GWP100) with 582.72 Gg CO2 / year (62.2%)
- 5: M.AG.ELV, N2O with -253.53 Gg CO2 / year (-30.8%)
For 1990-2023 the following sector-gas combinations have the highest absolute impact on national total KyotoGHG (AR6GWP100) emissions in 1990-2023 (top 5):
- 1: 4, CH4 with -623.41 Gg CO2 / year (-47.0%)
- 2: 3.A, CH4 with 488.87 Gg CO2 / year (18.2%)
- 3: 1.A, CO2 with 252.66 Gg CO2 / year (3.3%)
- 4: M.AG.ELV, N2O with -192.45 Gg CO2 / year (-27.7%)
- 5: 2, HFCS (AR6GWP100) with 90.31 Gg CO2 / year (44.7%)
Changes in the main sectors for aggregate KyotoGHG (AR6GWP100) are
- 1: Total sectoral emissions in 2022 are 13936.30 Gg
CO2 / year which is 65.0% of M.0.EL emissions. 2023 Emissions have
changed by 10.3% (1405.50 Gg CO2 /
year). 1990-2023 Emissions have changed by 3.2% (245.42 Gg CO2 / year). For 2023 the
changes per gas
are:
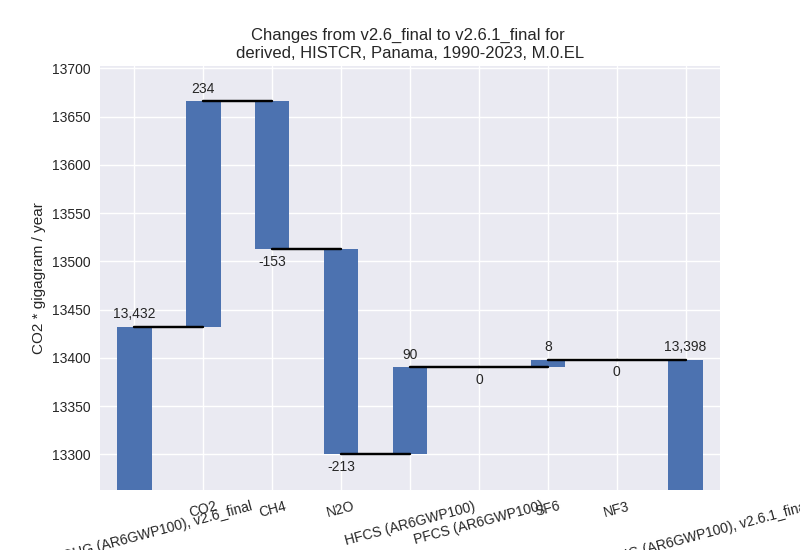
For 1990-2023 the changes per gas are: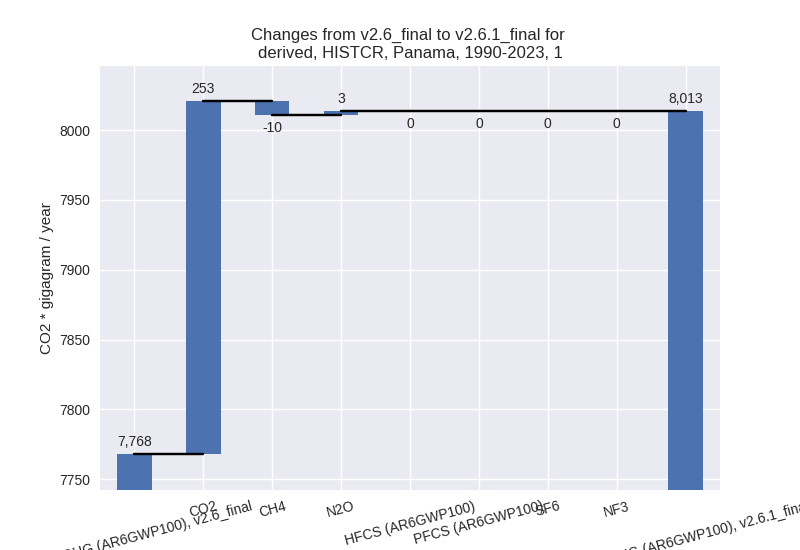
The changes come from the following subsectors:- 1.A: Total sectoral emissions in 2022 are 13936.30
Gg CO2 / year which is 100.0% of category 1 emissions. 2023 Emissions
have changed by 10.3% (1405.50 Gg
CO2 / year). 1990-2023 Emissions have changed by 3.2% (251.34 Gg CO2 / year). For 2023 the
changes per gas
are:

For 1990-2023 the changes per gas are: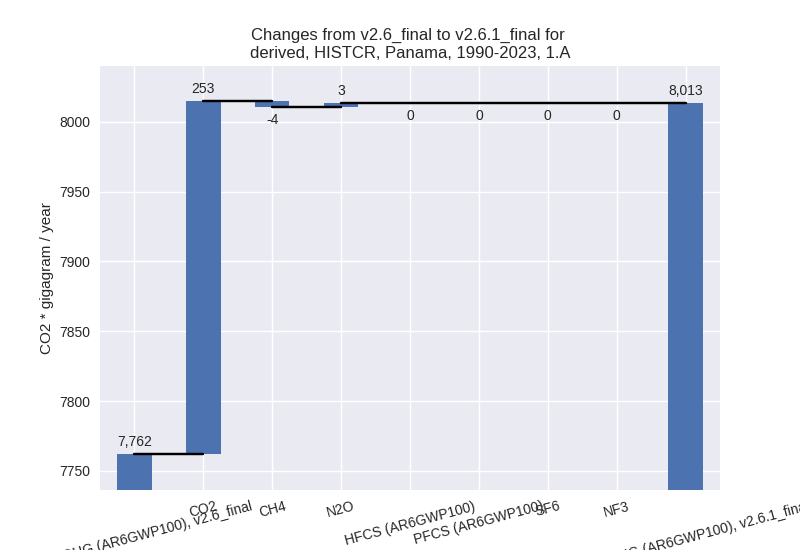
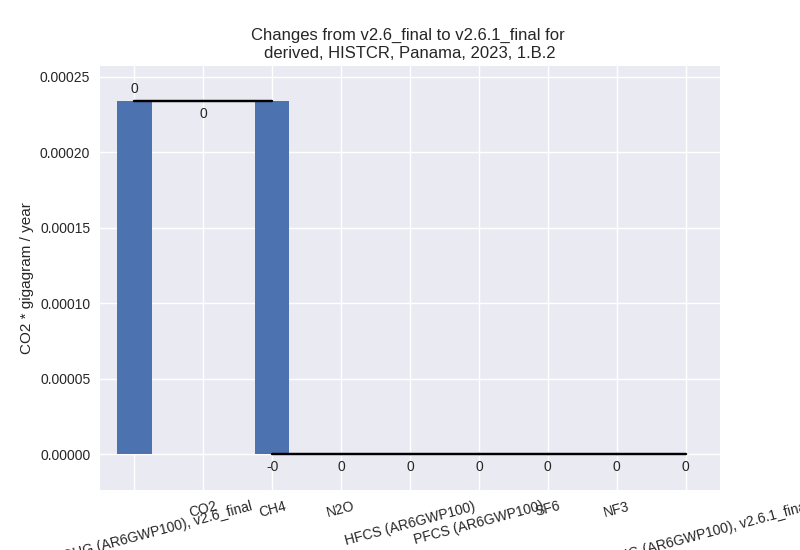
There is no subsector information available in PRIMAP-hist. - 1.B.2: Total sectoral emissions in 2022 are 0.00 Gg
CO2 / year which is 0.0% of category 1 emissions. 2023 Emissions have
changed by -100.0% (-0.00 Gg CO2 /
year). 1990-2023 Emissions have changed by -100.0% (-5.92 Gg CO2 / year). For 2023
the changes per gas
are:
For 1990-2023 the changes per gas are: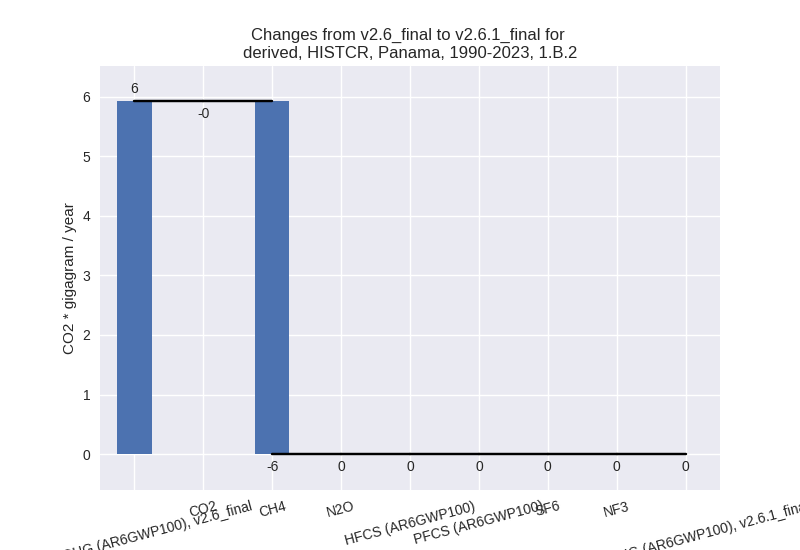
There is no subsector information available in PRIMAP-hist.
- 1.A: Total sectoral emissions in 2022 are 13936.30
Gg CO2 / year which is 100.0% of category 1 emissions. 2023 Emissions
have changed by 10.3% (1405.50 Gg
CO2 / year). 1990-2023 Emissions have changed by 3.2% (251.34 Gg CO2 / year). For 2023 the
changes per gas
are:
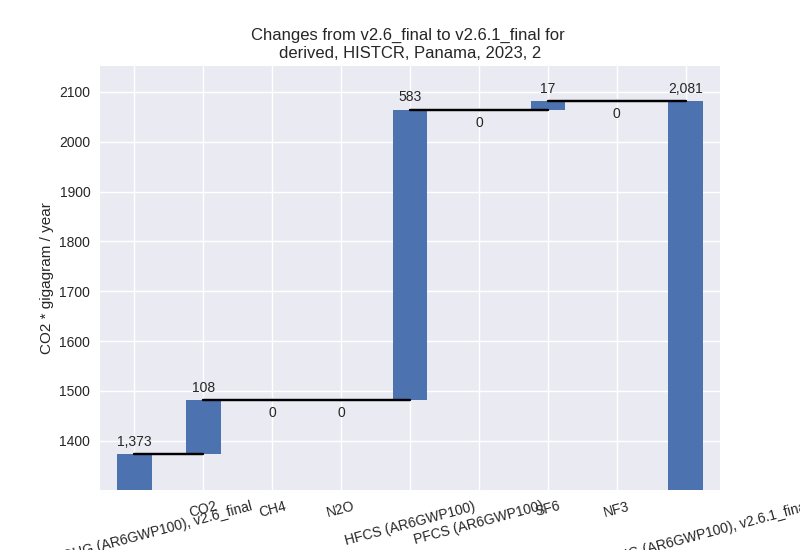
- 2: Total sectoral emissions in 2022 are 1974.02 Gg
CO2 / year which is 9.2% of M.0.EL emissions. 2023 Emissions have
changed by 51.6% (708.01 Gg CO2 /
year). 1990-2023 Emissions have changed by 9.8% (61.73 Gg CO2 / year). For 2023 the
changes per gas
are:
For 1990-2023 the changes per gas are: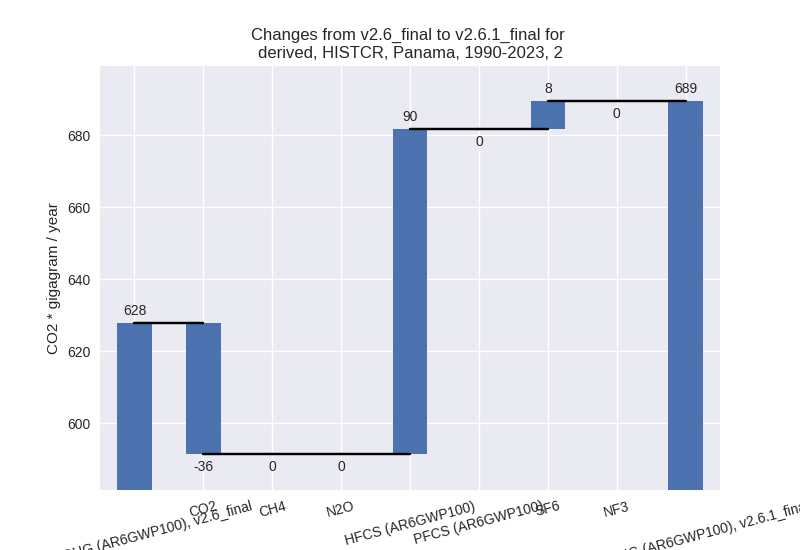
- M.AG: Total sectoral emissions in 2022 are 4106.46
Gg CO2 / year which is 19.2% of M.0.EL emissions. 2023 Emissions have
changed by 15.2% (542.52 Gg CO2 /
year). 1990-2023 Emissions have changed by 8.2% (292.07 Gg CO2 / year). For 2023 the
changes per gas
are:
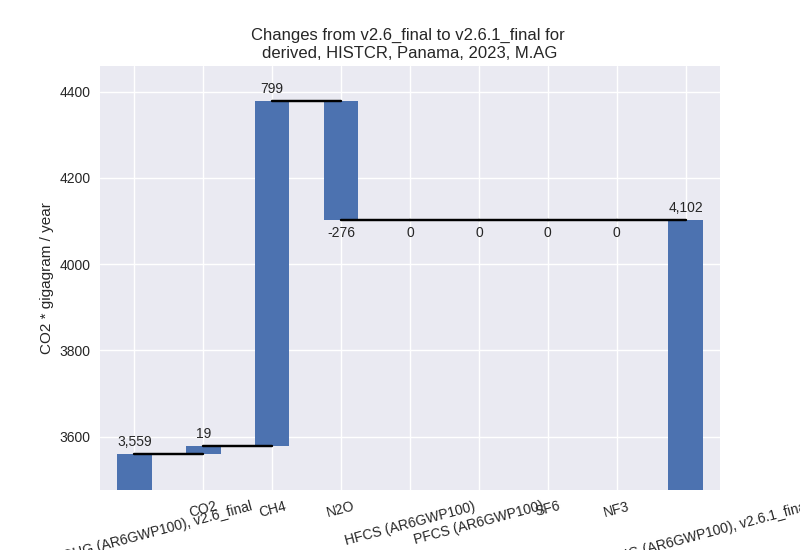
For 1990-2023 the changes per gas are: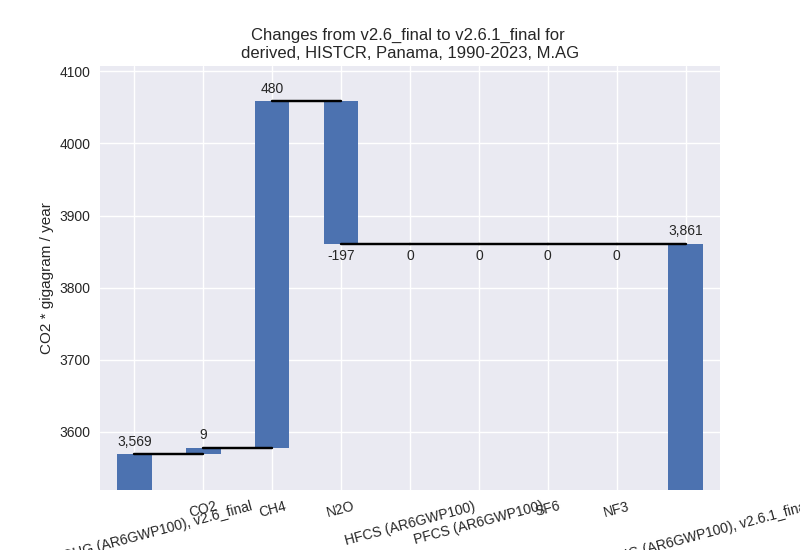
The changes come from the following subsectors:- 3.A: Total sectoral emissions in 2022 are 3387.00
Gg CO2 / year which is 82.5% of category M.AG emissions. 2023 Emissions
have changed by 29.0% (761.42 Gg CO2
/ year). 1990-2023 Emissions have changed by 17.7% (484.13 Gg CO2 / year). For 2023 the
changes per gas
are:
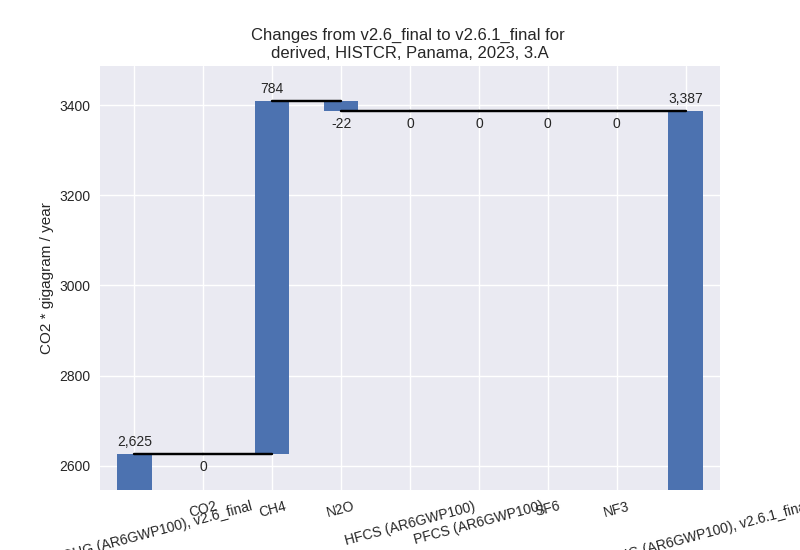
For 1990-2023 the changes per gas are:
There is no subsector information available in PRIMAP-hist. - M.AG.ELV: Total sectoral emissions in 2022 are
719.46 Gg CO2 / year which is 17.5% of category M.AG emissions. 2023
Emissions have changed by -23.4%
(-218.91 Gg CO2 / year). 1990-2023 Emissions have changed by -23.1% (-192.07 Gg CO2 / year). For 2023
the changes per gas
are:
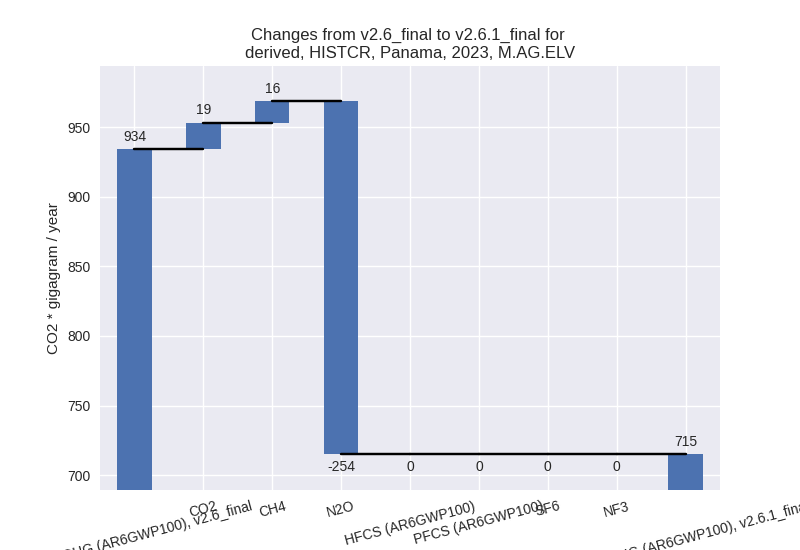
For 1990-2023 the changes per gas are: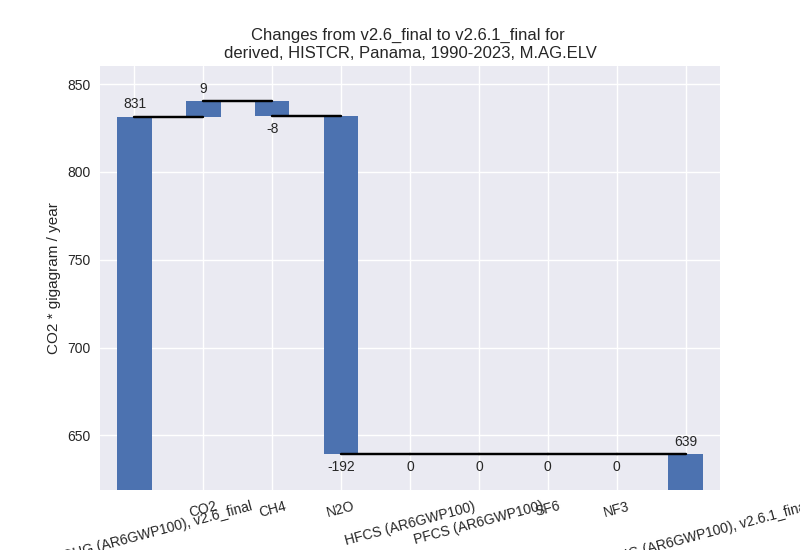
There is no subsector information available in PRIMAP-hist.
- 3.A: Total sectoral emissions in 2022 are 3387.00
Gg CO2 / year which is 82.5% of category M.AG emissions. 2023 Emissions
have changed by 29.0% (761.42 Gg CO2
/ year). 1990-2023 Emissions have changed by 17.7% (484.13 Gg CO2 / year). For 2023 the
changes per gas
are:
- 4: Total sectoral emissions in 2022 are 1341.54 Gg
CO2 / year which is 6.3% of M.0.EL emissions. 2023 Emissions have
changed by -36.7% (-794.92 Gg CO2 /
year). 1990-2023 Emissions have changed by -45.2% (-625.91 Gg CO2 / year). For 2023
the changes per gas
are:
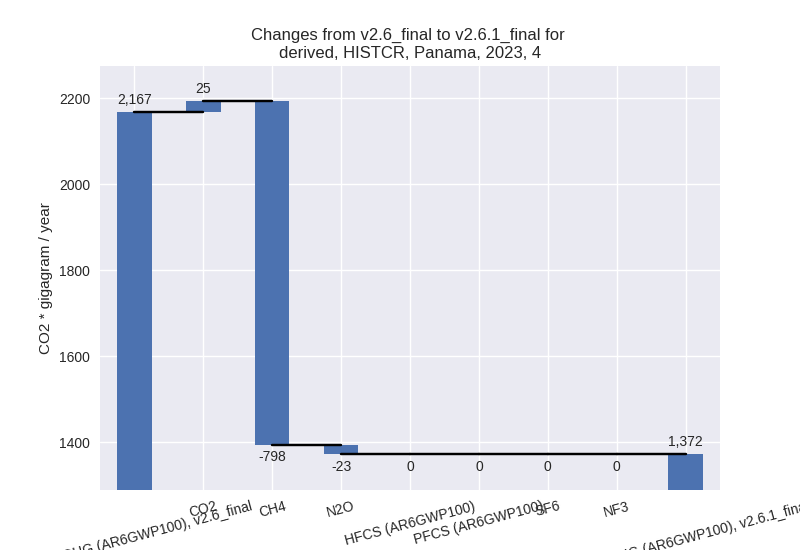
For 1990-2023 the changes per gas are: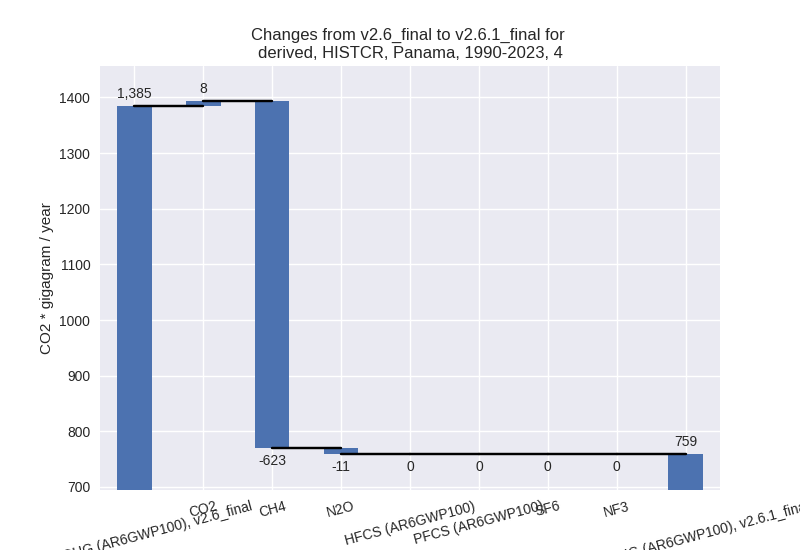
- 5: Total sectoral emissions in 2022 are 81.33 Gg
CO2 / year which is 0.4% of M.0.EL emissions. 2023 Emissions have
changed by 4.5% (3.84 Gg CO2 /
year). 1990-2023 Emissions have changed by -8.7% (-7.21 Gg CO2 / year). For 2023 the
changes per gas
are:

For 1990-2023 the changes per gas are: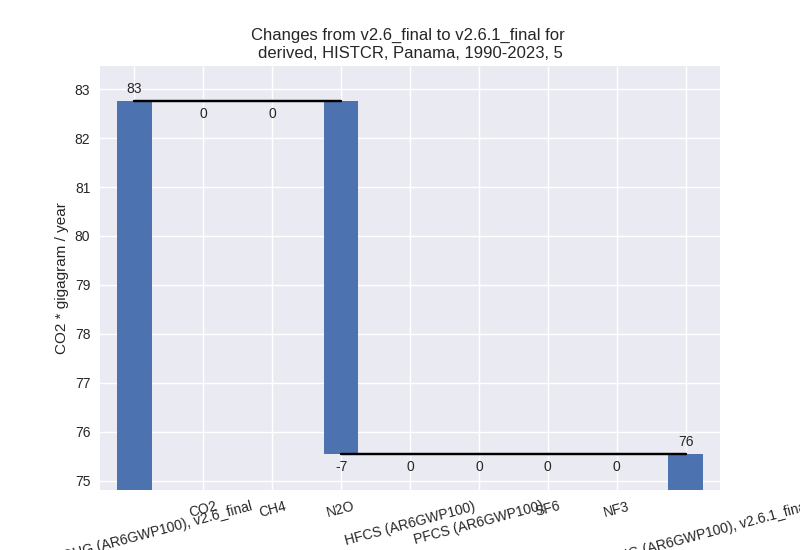
third party scenario (HISTTP):
Most important changes per time frame
For 2023 the following sector-gas combinations have the highest absolute impact on national total KyotoGHG (AR6GWP100) emissions in 2023 (top 5):
- 1: 4, CH4 with -513.96 Gg CO2 / year (-26.2%)
- 2: 2, CO2 with 212.53 Gg CO2 / year (63.2%)
- 3: M.AG.ELV, N2O with -126.38 Gg CO2 / year (-11.5%)
- 4: 3.A, CH4 with 40.66 Gg CO2 / year (1.6%)
- 5: 4, CO2 with 25.24 Gg CO2 / year (inf%)
For 1990-2023 the following sector-gas combinations have the highest absolute impact on national total KyotoGHG (AR6GWP100) emissions in 1990-2023 (top 5):
- 1: 4, CH4 with -387.09 Gg CO2 / year (-29.3%)
- 2: 2, CO2 with -69.86 Gg CO2 / year (-14.9%)
- 3: M.AG.ELV, CO2 with 8.82 Gg CO2 / year (181.7%)
- 4: 4, CO2 with 8.45 Gg CO2 / year (inf%)
- 5: 2, SF6 with 7.75 Gg CO2 / year (inf%)
Changes in the main sectors for aggregate KyotoGHG (AR6GWP100) are
- 1: Total sectoral emissions in 2022 are 12543.51 Gg CO2 / year which is 64.7% of M.0.EL emissions. 2023 Emissions have changed by 0.2% (25.51 Gg CO2 / year). 1990-2023 Emissions have changed by 0.0% (1.42 Gg CO2 / year).
- 2: Total sectoral emissions in 2022 are 1583.19 Gg
CO2 / year which is 8.2% of M.0.EL emissions. 2023 Emissions have
changed by 15.4% (221.75 Gg CO2 /
year). 1990-2023 Emissions have changed by -7.6% (-62.69 Gg CO2 / year). For 2023 the
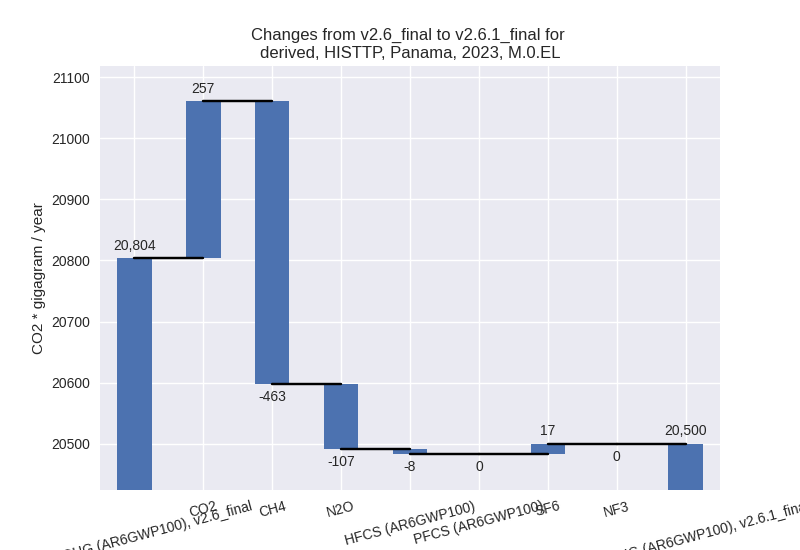
changes per gas
are:
For 1990-2023 the changes per gas are: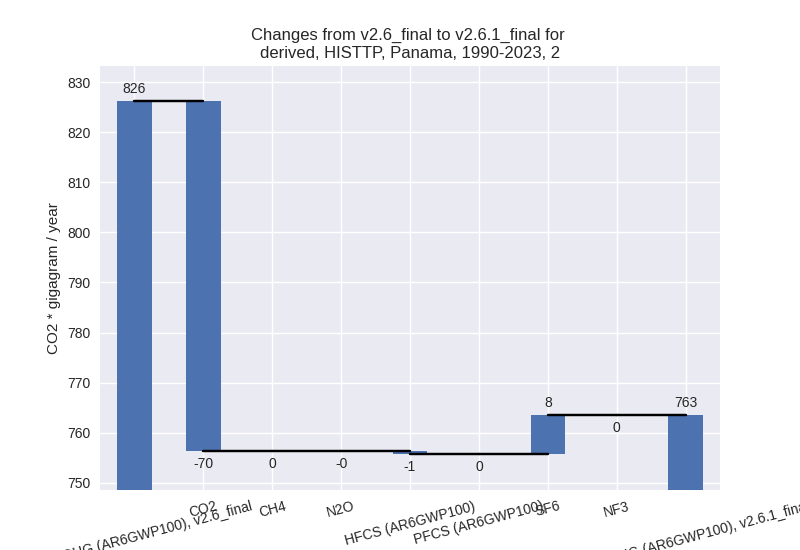
- M.AG: Total sectoral emissions in 2022 are 3666.89 Gg CO2 / year which is 18.9% of M.0.EL emissions. 2023 Emissions have changed by -1.8% (-65.78 Gg CO2 / year). 1990-2023 Emissions have changed by 0.1% (4.52 Gg CO2 / year).
- 4: Total sectoral emissions in 2022 are 1505.79 Gg
CO2 / year which is 7.8% of M.0.EL emissions. 2023 Emissions have
changed by -24.1% (-489.38 Gg CO2 /
year). 1990-2023 Emissions have changed by -27.7% (-378.78 Gg CO2 / year). For 2023
the changes per gas
are:
For 1990-2023 the changes per gas are: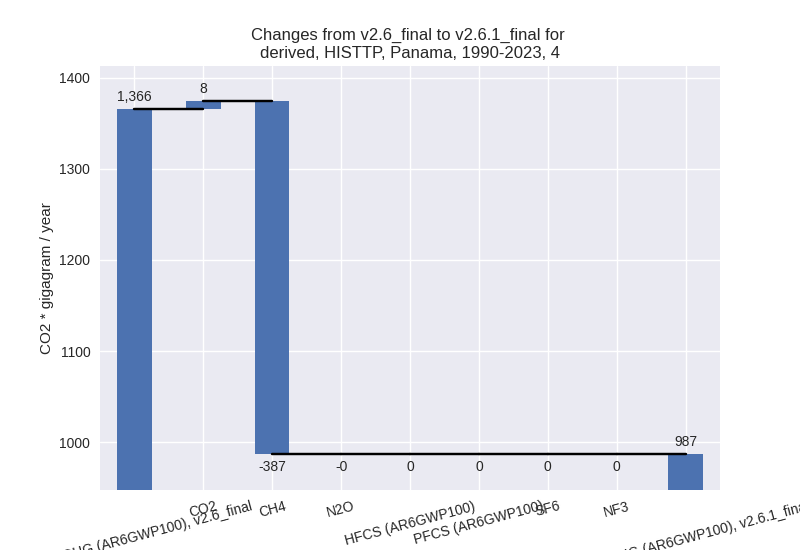
- 5: Total sectoral emissions in 2022 are 81.33 Gg
CO2 / year which is 0.4% of M.0.EL emissions. 2023 Emissions have
changed by 4.5% (3.84 Gg CO2 /
year). 1990-2023 Emissions have changed by -8.7% (-7.21 Gg CO2 / year). For 2023 the
changes per gas
are:
For 1990-2023 the changes per gas are: