Changes in PRIMAP-hist v2.6.1_final compared to v2.6_final for Peru
2025-03-19
Johannes Gütschow
Change analysis for Peru for PRIMAP-hist v2.6.1_final compared to v2.6_final
Overview over emissions by sector and gas
The following figures show the aggregate national total emissions excluding LULUCF AR6GWP100 for the country reported priority scenario. The dotted linesshow the v2.6_final data.
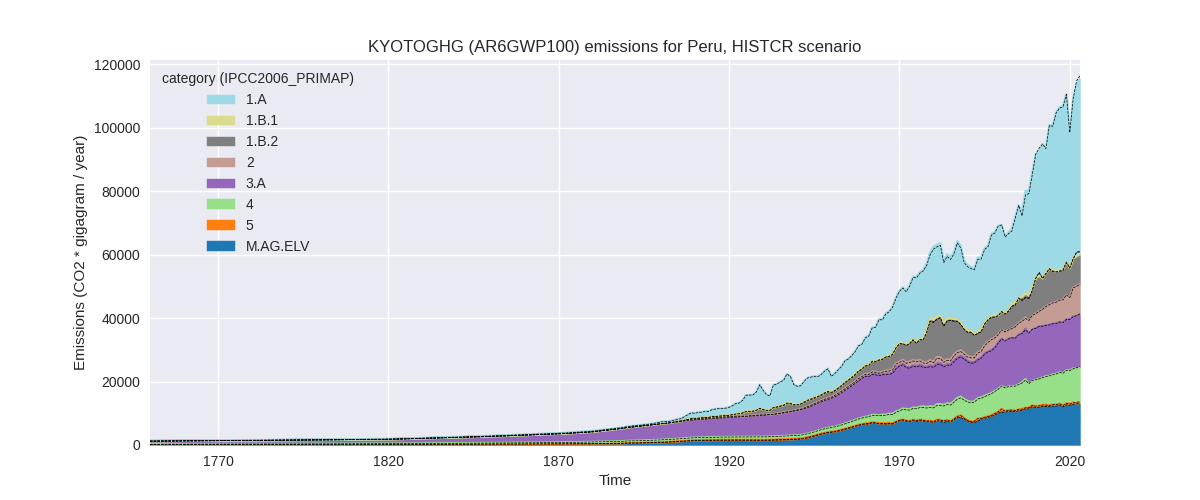
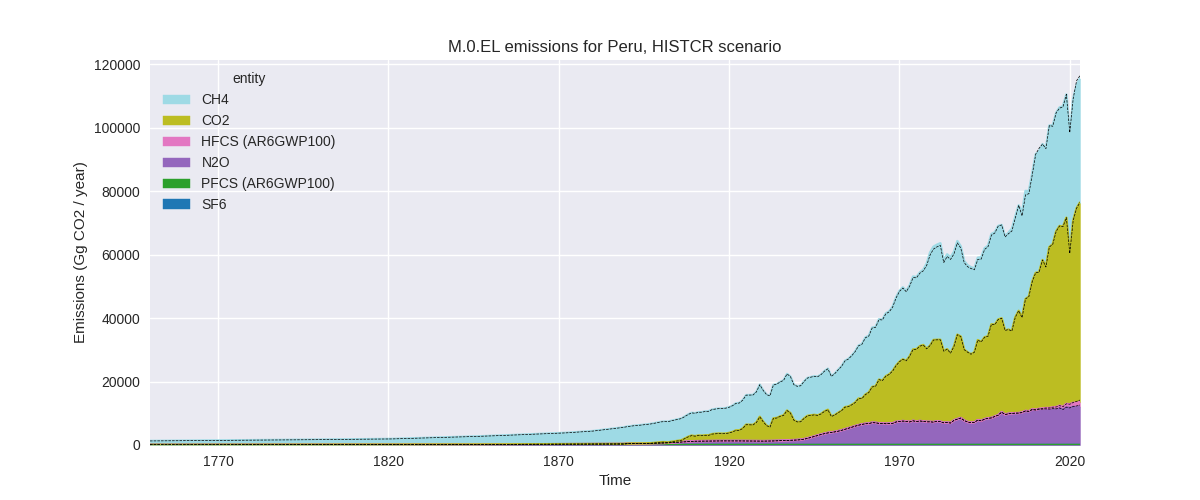
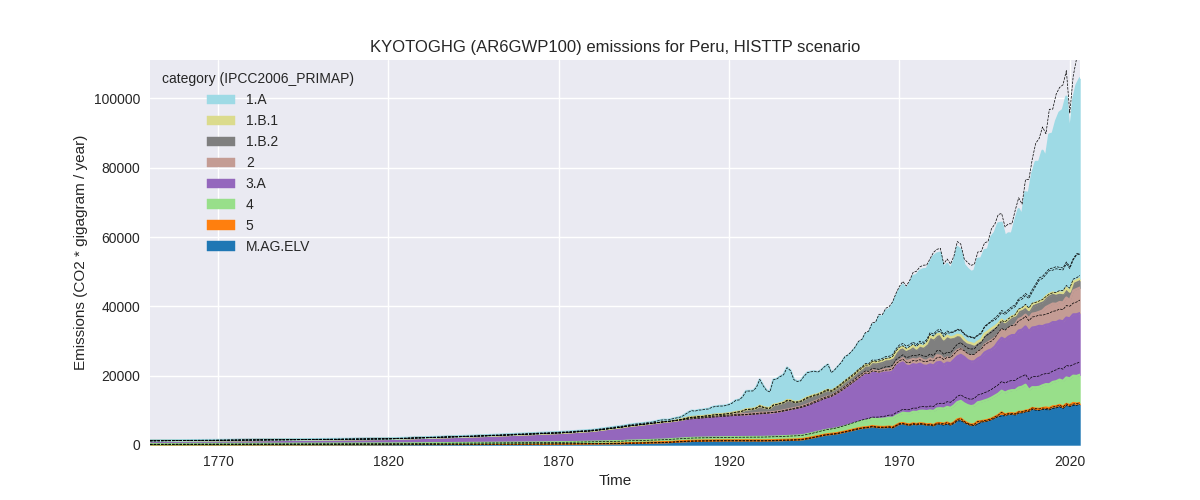
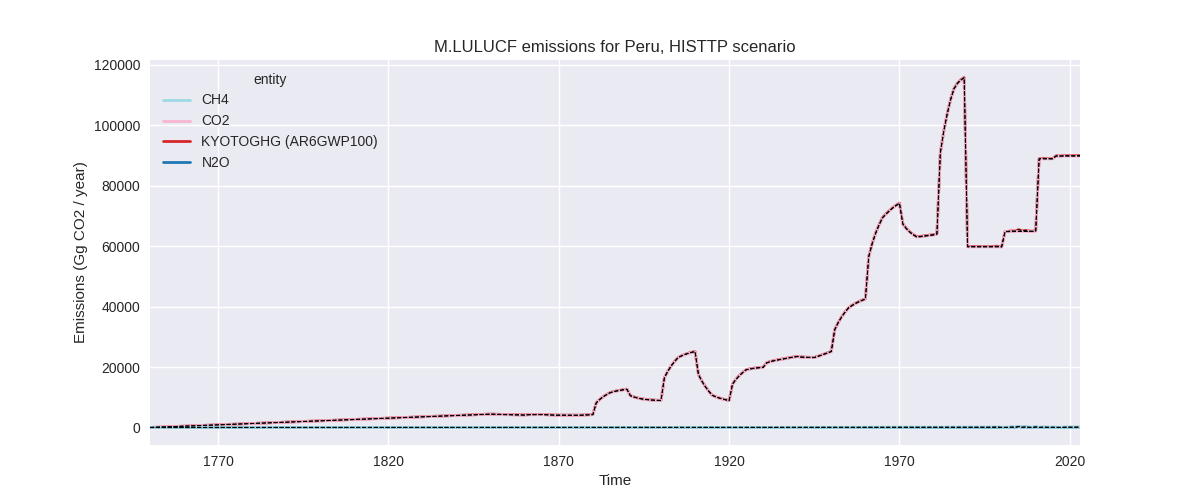
The following figures show the aggregate national total emissions excluding LULUCF AR6GWP100 for the third party priority scenario. The dotted linesshow the v2.6_final data.

Overview over changes
In the country reported priority scenario we have the following changes for aggregate Kyoto GHG and national total emissions excluding LULUCF (M.0.EL):
- Emissions in 2023 have changed by -0.7%% (-864.46 Gg CO2 / year)
- Emissions in 1990-2023 have changed by 0.2%% (192.07 Gg CO2 / year)
In the third party priority scenario we have the following changes for aggregate Kyoto GHG and national total emissions excluding LULUCF (M.0.EL):
- Emissions in 2023 have changed by -6.5%% (-7409.64 Gg CO2 / year)
- Emissions in 1990-2023 have changed by -5.7%% (-4509.64 Gg CO2 / year)
Most important changes per scenario and time frame
In the country reported priority scenario the following sector-gas combinations have the highest absolute impact on national total KyotoGHG (AR6GWP100) emissions in 2023 (top 5):
- 1: 1.B.2, CH4 with -950.74 Gg CO2 / year (-10.0%)
- 2: 2, CO2 with 461.49 Gg CO2 / year (6.0%)
- 3: M.AG.ELV, N2O with -388.39 Gg CO2 / year (-3.6%)
- 4: 1.B.1, CH4 with 124.00 Gg CO2 / year (83.6%)
- 5: M.AG.ELV, CH4 with 105.90 Gg CO2 / year (4.8%)
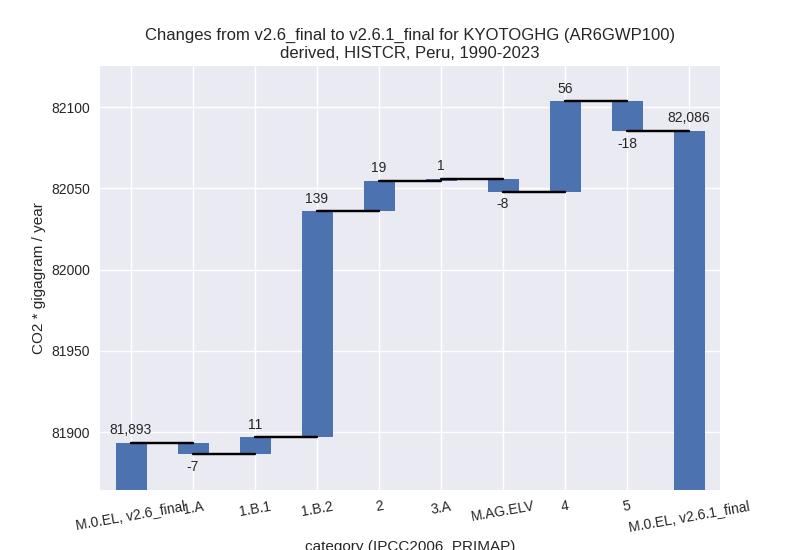
In the country reported priority scenario the following sector-gas combinations have the highest absolute impact on national total KyotoGHG (AR6GWP100) emissions in 1990-2023 (top 5):
- 1: 1.B.2, CH4 with 138.97 Gg CO2 / year (1.9%)
- 2: 4, CH4 with 56.14 Gg CO2 / year (0.7%)
- 3: 2, CO2 with 23.38 Gg CO2 / year (0.6%)
- 4: M.AG.ELV, N2O with -22.66 Gg CO2 / year (-0.3%)
- 5: 5, N2O with -18.03 Gg CO2 / year (-4.4%)
In the third party priority scenario the following sector-gas combinations have the highest absolute impact on national total KyotoGHG (AR6GWP100) emissions in 2023 (top 5):
- 1: 1.B.2, CH4 with -4124.84 Gg CO2 / year (-70.1%)
- 2: 4, CH4 with -3658.27 Gg CO2 / year (-32.6%)
- 3: 1.B.1, CH4 with 299.36 Gg CO2 / year (123.0%)
- 4: M.AG.ELV, N2O with -283.96 Gg CO2 / year (-3.6%)
- 5: 2, CO2 with 278.19 Gg CO2 / year (4.7%)
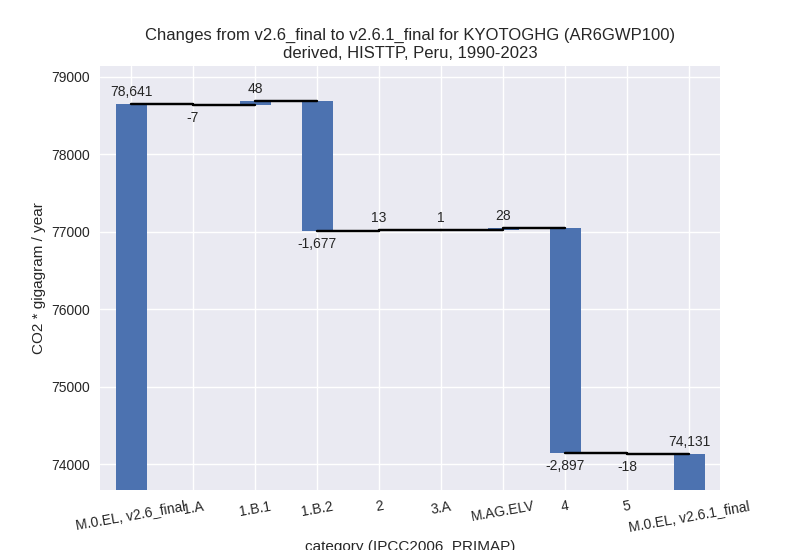
In the third party priority scenario the following sector-gas combinations have the highest absolute impact on national total KyotoGHG (AR6GWP100) emissions in 1990-2023 (top 5):
- 1: 4, CH4 with -2897.22 Gg CO2 / year (-31.8%)
- 2: 1.B.2, CH4 with -1677.41 Gg CO2 / year (-45.9%)
- 3: 1.B.1, CH4 with 47.58 Gg CO2 / year (10.2%)
- 4: M.AG.ELV, CO2 with 37.68 Gg CO2 / year (7.3%)
- 5: 5, N2O with -18.03 Gg CO2 / year (-4.4%)
Notes on data changes
Here we list notes explaining important emissions changes for the country.
- No new country reported data has been included. Changes in the CR time-series are small in terms of total emissions and come from updated third party data (EDGAR, FAO) which is used to extrapolate the country reported data.
- Changes in the TP time-series are much larger because the emissions are not anchored by the unchanged country reported data. Agricultural data changes from FAO are limited to the latest years while EDGAR has changed full time-series dominating the overall changes.
Changes by sector and gas
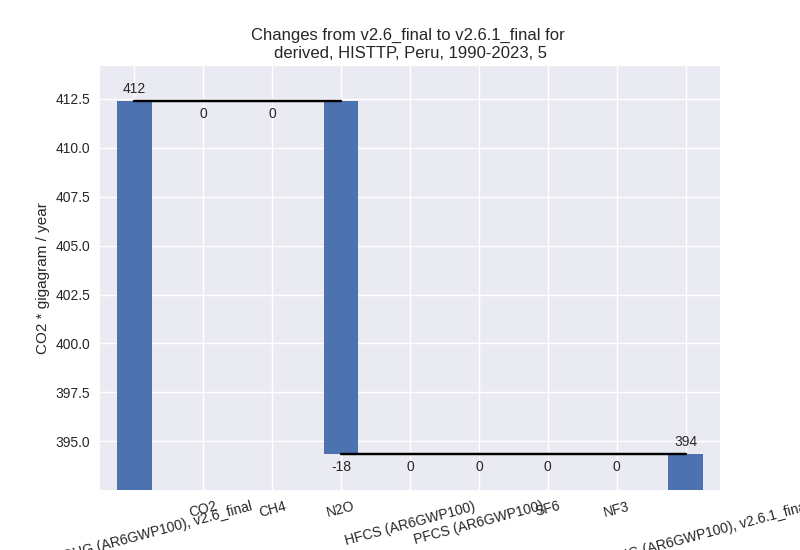
For each scenario and time frame the changes are displayed for all individual sectors and all individual gases. In the sector plot we use aggregate Kyoto GHGs in AR6GWP100. In the gas plot we usenational total emissions without LULUCF.
country reported scenario
2023
1990-2023
third party scenario
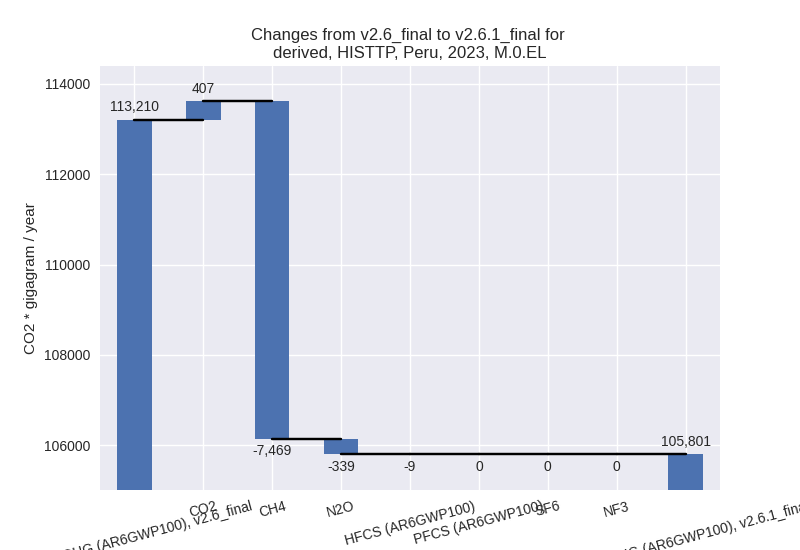
2023
1990-2023

Detailed changes for the scenarios:
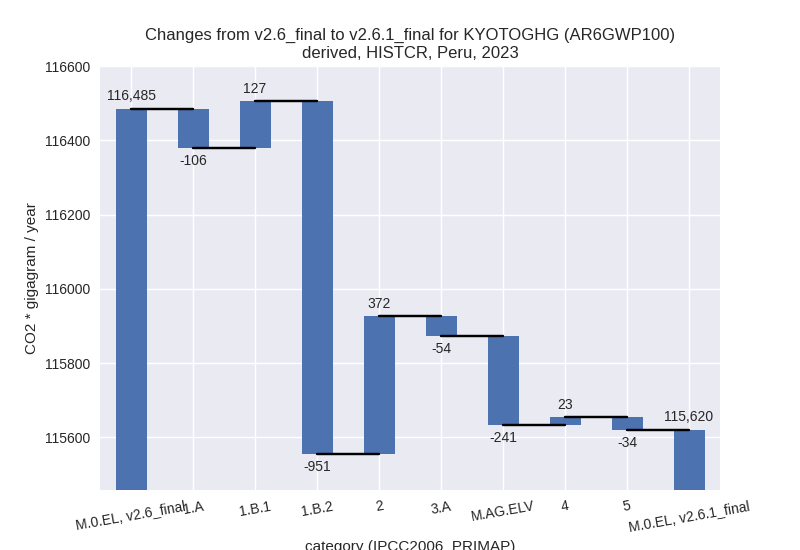
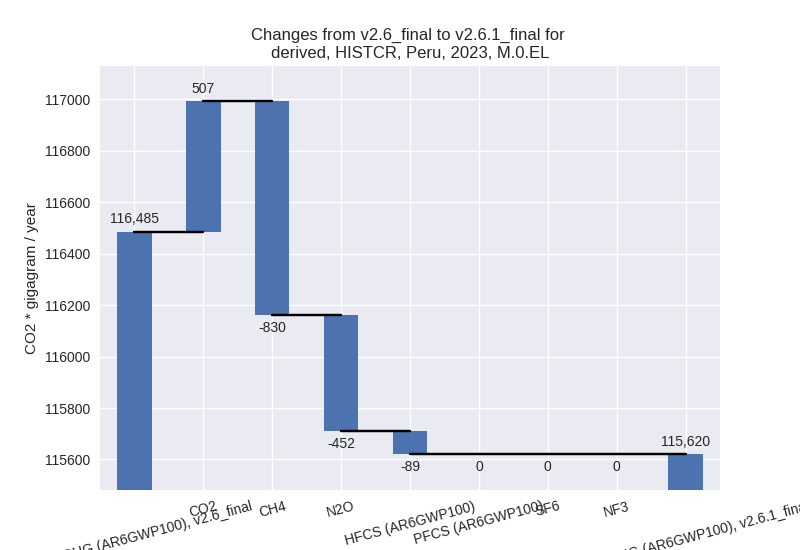
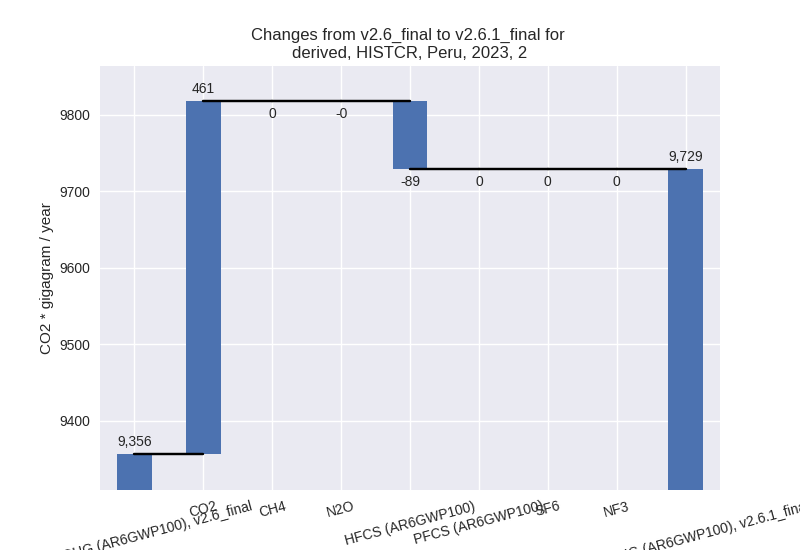
country reported scenario (HISTCR):
Most important changes per time frame
For 2023 the following sector-gas combinations have the highest absolute impact on national total KyotoGHG (AR6GWP100) emissions in 2023 (top 5):
- 1: 1.B.2, CH4 with -950.74 Gg CO2 / year (-10.0%)
- 2: 2, CO2 with 461.49 Gg CO2 / year (6.0%)
- 3: M.AG.ELV, N2O with -388.39 Gg CO2 / year (-3.6%)
- 4: 1.B.1, CH4 with 124.00 Gg CO2 / year (83.6%)
- 5: M.AG.ELV, CH4 with 105.90 Gg CO2 / year (4.8%)
For 1990-2023 the following sector-gas combinations have the highest absolute impact on national total KyotoGHG (AR6GWP100) emissions in 1990-2023 (top 5):
- 1: 1.B.2, CH4 with 138.97 Gg CO2 / year (1.9%)
- 2: 4, CH4 with 56.14 Gg CO2 / year (0.7%)
- 3: 2, CO2 with 23.38 Gg CO2 / year (0.6%)
- 4: M.AG.ELV, N2O with -22.66 Gg CO2 / year (-0.3%)
- 5: 5, N2O with -18.03 Gg CO2 / year (-4.4%)
Changes in the main sectors for aggregate KyotoGHG (AR6GWP100) are
- 1: Total sectoral emissions in 2022 are 63340.54 Gg CO2 / year which is 55.8% of M.0.EL emissions. 2023 Emissions have changed by -1.4% (-930.60 Gg CO2 / year). 1990-2023 Emissions have changed by 0.3% (142.52 Gg CO2 / year).
- 2: Total sectoral emissions in 2022 are 9611.58 Gg
CO2 / year which is 8.5% of M.0.EL emissions. 2023 Emissions have
changed by 4.0% (372.47 Gg CO2 /
year). 1990-2023 Emissions have changed by 0.4% (18.83 Gg CO2 / year). For 2023 the
changes per gas
are:
- M.AG: Total sectoral emissions in 2022 are 29201.10 Gg CO2 / year which is 25.7% of M.0.EL emissions. 2023 Emissions have changed by -1.0% (-294.78 Gg CO2 / year). 1990-2023 Emissions have changed by -0.0% (-6.78 Gg CO2 / year).
- 4: Total sectoral emissions in 2022 are 10914.33 Gg CO2 / year which is 9.6% of M.0.EL emissions. 2023 Emissions have changed by 0.2% (22.60 Gg CO2 / year). 1990-2023 Emissions have changed by 0.7% (55.53 Gg CO2 / year).
- 5: Total sectoral emissions in 2022 are 431.38 Gg
CO2 / year which is 0.4% of M.0.EL emissions. 2023 Emissions have
changed by -7.3% (-34.14 Gg CO2 /
year). 1990-2023 Emissions have changed by -4.4% (-18.03 Gg CO2 / year). For 2023 the
changes per gas
are:

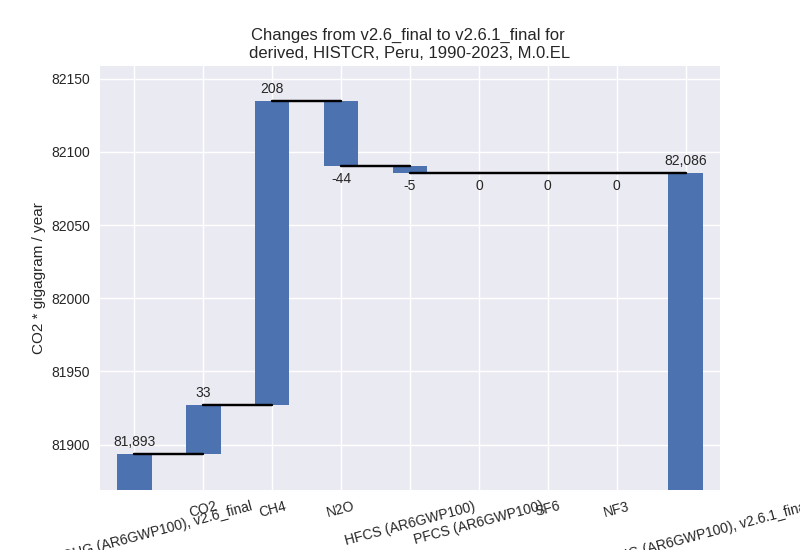
For 1990-2023 the changes per gas are:
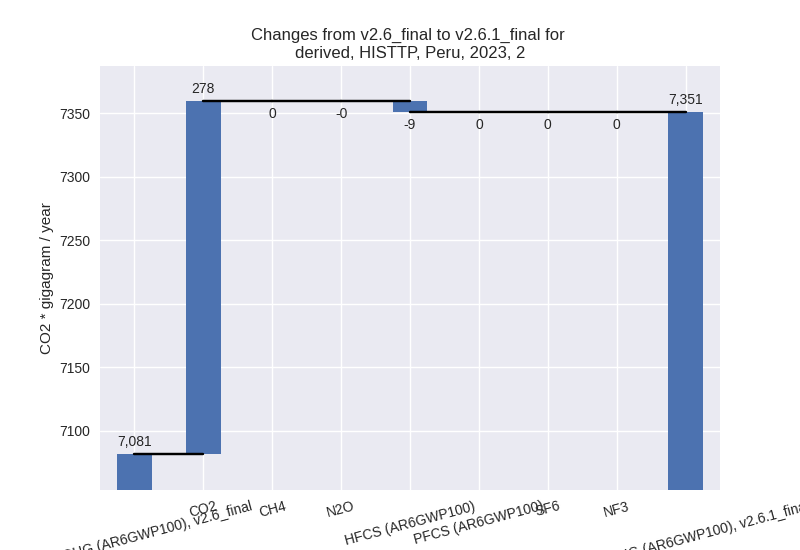
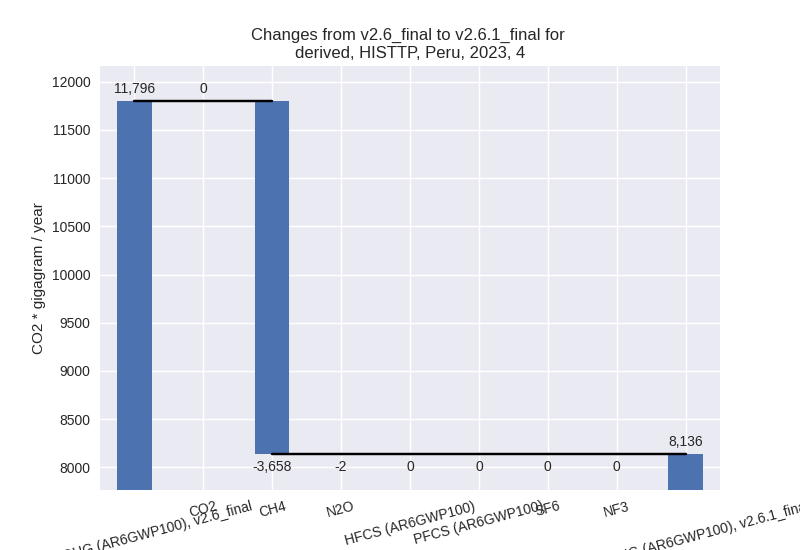
third party scenario (HISTTP):
Most important changes per time frame
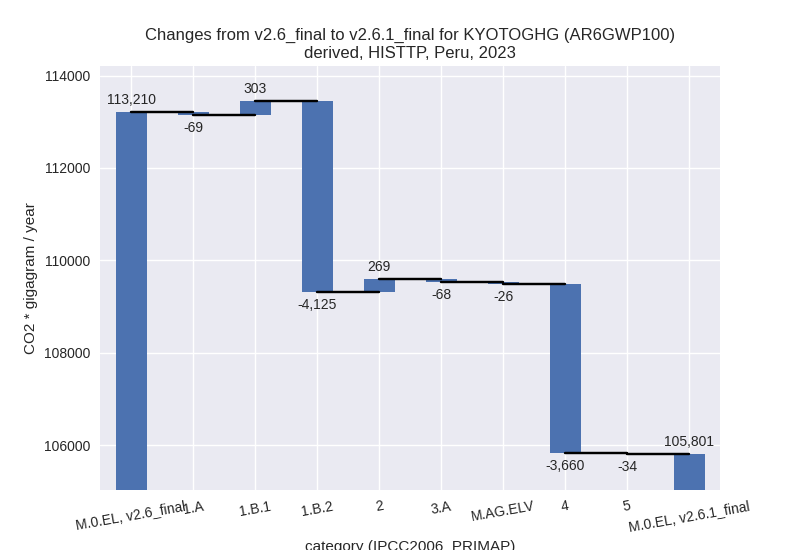
For 2023 the following sector-gas combinations have the highest absolute impact on national total KyotoGHG (AR6GWP100) emissions in 2023 (top 5):
- 1: 1.B.2, CH4 with -4124.84 Gg CO2 / year (-70.1%)
- 2: 4, CH4 with -3658.27 Gg CO2 / year (-32.6%)
- 3: 1.B.1, CH4 with 299.36 Gg CO2 / year (123.0%)
- 4: M.AG.ELV, N2O with -283.96 Gg CO2 / year (-3.6%)
- 5: 2, CO2 with 278.19 Gg CO2 / year (4.7%)
For 1990-2023 the following sector-gas combinations have the highest absolute impact on national total KyotoGHG (AR6GWP100) emissions in 1990-2023 (top 5):
- 1: 4, CH4 with -2897.22 Gg CO2 / year (-31.8%)
- 2: 1.B.2, CH4 with -1677.41 Gg CO2 / year (-45.9%)
- 3: 1.B.1, CH4 with 47.58 Gg CO2 / year (10.2%)
- 4: M.AG.ELV, CO2 with 37.68 Gg CO2 / year (7.3%)
- 5: 5, N2O with -18.03 Gg CO2 / year (-4.4%)
Changes in the main sectors for aggregate KyotoGHG (AR6GWP100) are
- 1: Total sectoral emissions in 2022 are 58890.90 Gg
CO2 / year which is 56.7% of M.0.EL emissions. 2023 Emissions have
changed by -6.1% (-3890.82 Gg CO2 /
year). 1990-2023 Emissions have changed by -4.1% (-1636.77 Gg CO2 / year). For 2023
the changes per gas
are:

For 1990-2023 the changes per gas are: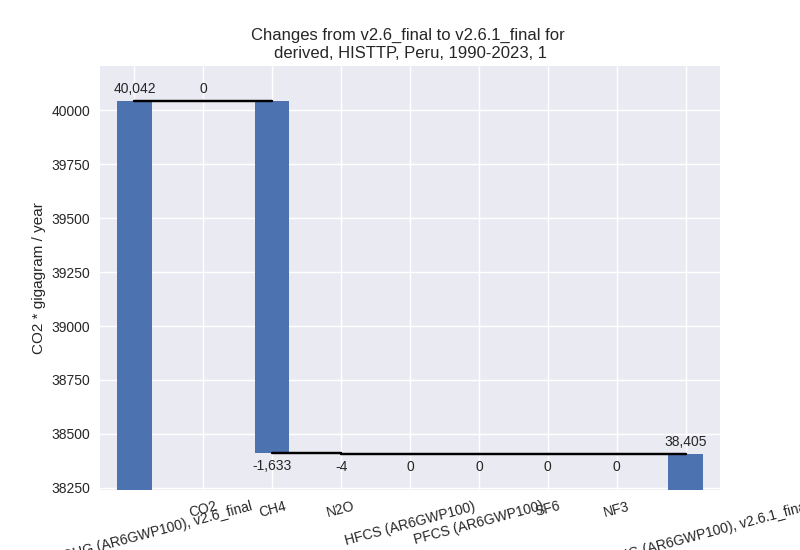
The changes come from the following subsectors:- 1.A: Total sectoral emissions in 2022 are 56301.11 Gg CO2 / year which is 95.6% of category 1 emissions. 2023 Emissions have changed by -0.1% (-69.35 Gg CO2 / year). 1990-2023 Emissions have changed by -0.0% (-7.37 Gg CO2 / year).
- 1.B.1: Total sectoral emissions in 2022 are 563.85
Gg CO2 / year which is 1.0% of category 1 emissions. 2023 Emissions have
changed by 122.8% (303.21 Gg CO2 /
year). 1990-2023 Emissions have changed by 9.9% (47.85 Gg CO2 / year). For 2023 the
changes per gas
are:

For 1990-2023 the changes per gas are: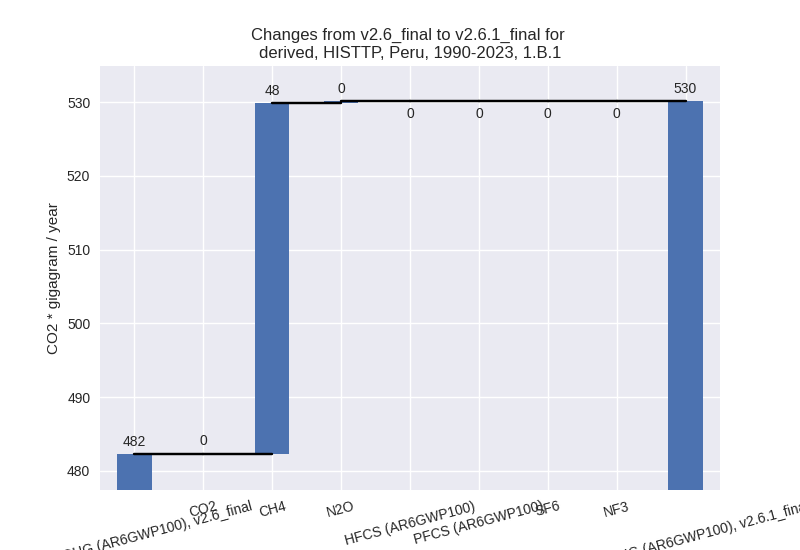
There is no subsector information available in PRIMAP-hist. - 1.B.2: Total sectoral emissions in 2022 are 2025.93
Gg CO2 / year which is 3.4% of category 1 emissions. 2023 Emissions have
changed by -66.9% (-4124.68 Gg CO2 /
year). 1990-2023 Emissions have changed by -41.1% (-1677.25 Gg CO2 / year). For 2023
the changes per gas
are:

For 1990-2023 the changes per gas are:
There is no subsector information available in PRIMAP-hist.
- 2: Total sectoral emissions in 2022 are 7268.93 Gg
CO2 / year which is 7.0% of M.0.EL emissions. 2023 Emissions have
changed by 3.8% (269.46 Gg CO2 /
year). 1990-2023 Emissions have changed by 0.4% (13.34 Gg CO2 / year). For 2023 the
changes per gas
are:
- M.AG: Total sectoral emissions in 2022 are 29258.37 Gg CO2 / year which is 28.2% of M.0.EL emissions. 2023 Emissions have changed by -0.3% (-94.03 Gg CO2 / year). 1990-2023 Emissions have changed by 0.1% (28.61 Gg CO2 / year).
- 4: Total sectoral emissions in 2022 are 7998.37 Gg
CO2 / year which is 7.7% of M.0.EL emissions. 2023 Emissions have
changed by -31.0% (-3660.10 Gg CO2 /
year). 1990-2023 Emissions have changed by -30.5% (-2896.80 Gg CO2 / year). For 2023
the changes per gas
are:
For 1990-2023 the changes per gas are:
- 5: Total sectoral emissions in 2022 are 431.38 Gg
CO2 / year which is 0.4% of M.0.EL emissions. 2023 Emissions have
changed by -7.3% (-34.14 Gg CO2 /
year). 1990-2023 Emissions have changed by -4.4% (-18.03 Gg CO2 / year). For 2023 the
changes per gas
are:

For 1990-2023 the changes per gas are: