Changes in PRIMAP-hist v2.6.1_final compared to v2.6_final for Philippines
2025-03-19
Johannes Gütschow
Change analysis for Philippines for PRIMAP-hist v2.6.1_final compared to v2.6_final
Overview over emissions by sector and gas
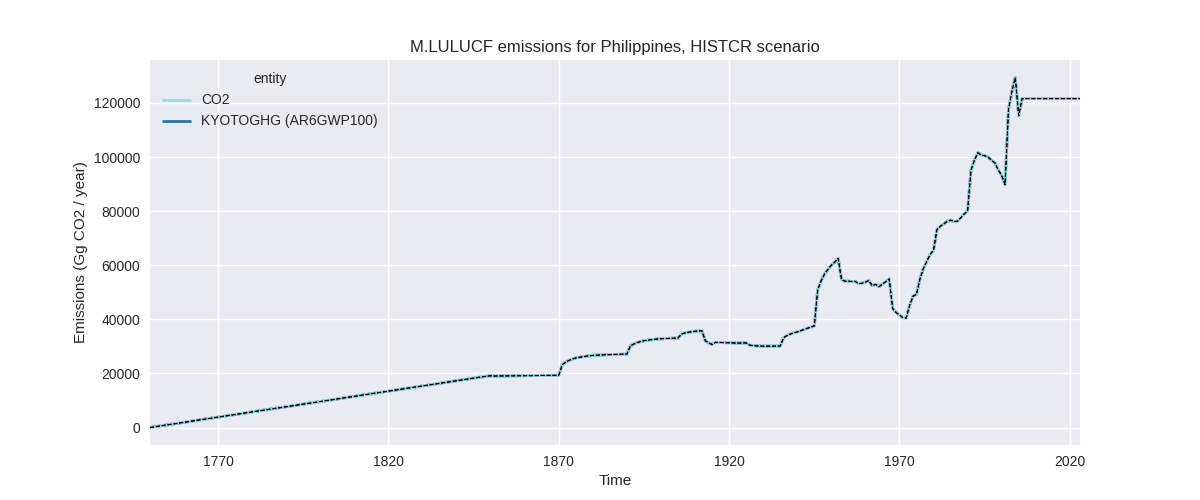
The following figures show the aggregate national total emissions excluding LULUCF AR6GWP100 for the country reported priority scenario. The dotted linesshow the v2.6_final data.


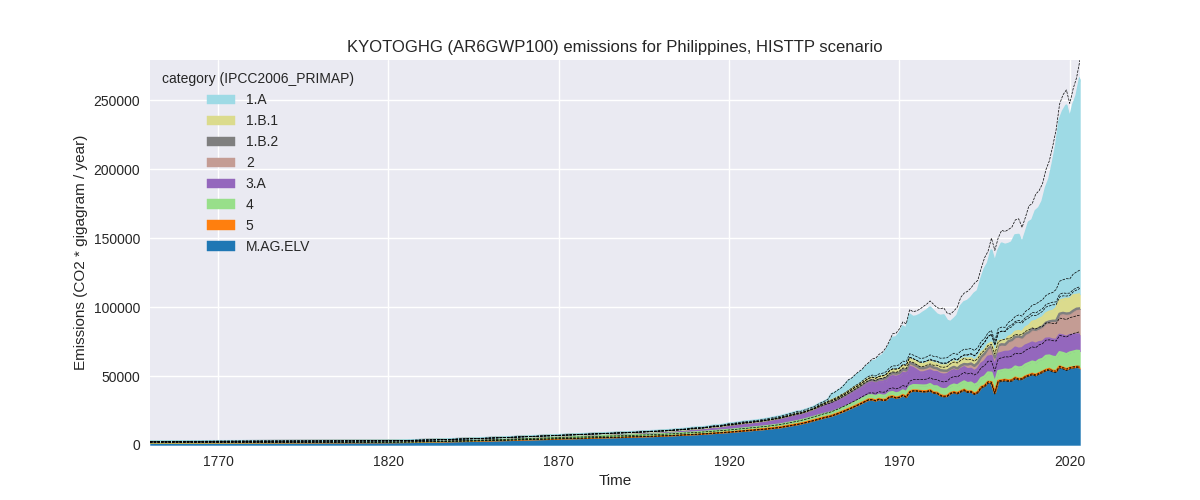
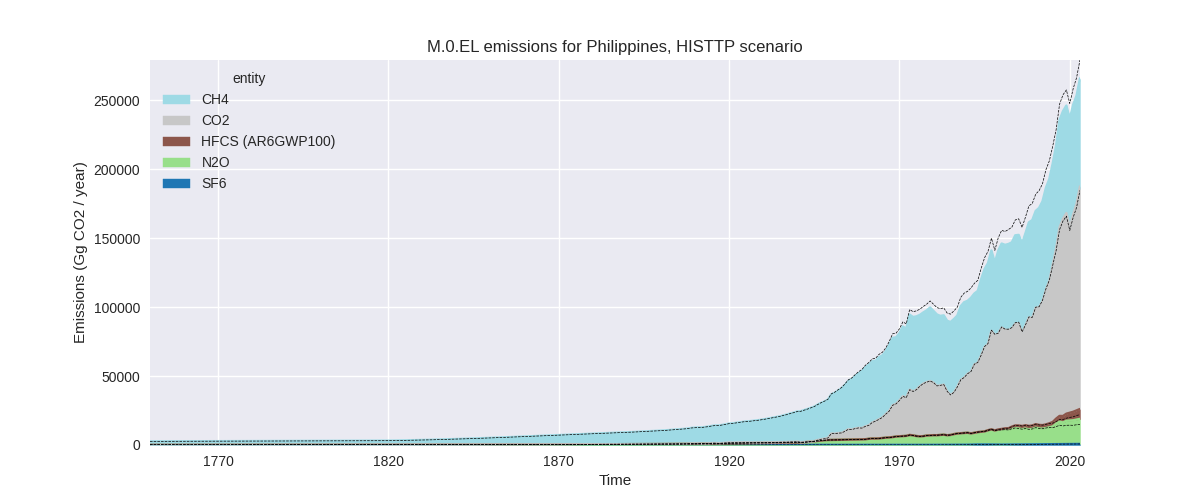
The following figures show the aggregate national total emissions excluding LULUCF AR6GWP100 for the third party priority scenario. The dotted linesshow the v2.6_final data.
Overview over changes
In the country reported priority scenario we have the following changes for aggregate Kyoto GHG and national total emissions excluding LULUCF (M.0.EL):
- Emissions in 2023 have changed by -4.8%% (-13450.23 Gg CO2 / year)
- Emissions in 1990-2023 have changed by -5.9%% (-10720.53 Gg CO2 / year)
In the third party priority scenario we have the following changes for aggregate Kyoto GHG and national total emissions excluding LULUCF (M.0.EL):
- Emissions in 2023 have changed by -4.8%% (-13450.23 Gg CO2 / year)
- Emissions in 1990-2023 have changed by -5.9%% (-10720.53 Gg CO2 / year)
Most important changes per scenario and time frame
In the country reported priority scenario the following sector-gas combinations have the highest absolute impact on national total KyotoGHG (AR6GWP100) emissions in 2023 (top 5):
- 1: 4, CH4 with -13061.18 Gg CO2 / year (-56.0%)
- 2: 1.A, N2O with 4135.97 Gg CO2 / year (412.8%)
- 3: 1.B.1, CH4 with -1918.49 Gg CO2 / year (-16.1%)
- 4: 1.B.2, CH4 with -797.11 Gg CO2 / year (-67.1%)
- 5: 2, CO2 with -641.98 Gg CO2 / year (-5.6%)
In the country reported priority scenario the following sector-gas combinations have the highest absolute impact on national total KyotoGHG (AR6GWP100) emissions in 1990-2023 (top 5):
- 1: 4, CH4 with -10118.81 Gg CO2 / year (-57.3%)
- 2: 1.A, N2O with 775.66 Gg CO2 / year (100.1%)
- 3: 1.B.2, CH4 with -644.89 Gg CO2 / year (-60.8%)
- 4: 2, CO2 with -562.96 Gg CO2 / year (-8.0%)
- 5: 1.B.1, CH4 with -84.62 Gg CO2 / year (-1.5%)
In the third party priority scenario the following sector-gas combinations have the highest absolute impact on national total KyotoGHG (AR6GWP100) emissions in 2023 (top 5):
- 1: 4, CH4 with -13061.18 Gg CO2 / year (-56.0%)
- 2: 1.A, N2O with 4135.97 Gg CO2 / year (412.8%)
- 3: 1.B.1, CH4 with -1918.49 Gg CO2 / year (-16.1%)
- 4: 1.B.2, CH4 with -797.11 Gg CO2 / year (-67.1%)
- 5: 2, CO2 with -641.98 Gg CO2 / year (-5.6%)
In the third party priority scenario the following sector-gas combinations have the highest absolute impact on national total KyotoGHG (AR6GWP100) emissions in 1990-2023 (top 5):
- 1: 4, CH4 with -10118.81 Gg CO2 / year (-57.3%)
- 2: 1.A, N2O with 775.66 Gg CO2 / year (100.1%)
- 3: 1.B.2, CH4 with -644.89 Gg CO2 / year (-60.8%)
- 4: 2, CO2 with -562.96 Gg CO2 / year (-8.0%)
- 5: 1.B.1, CH4 with -84.62 Gg CO2 / year (-1.5%)
Notes on data changes
Here we list notes explaining important emissions changes for the country.
- There is no usable country reported data for Philippines, thus the CR and TP time-series are identical.
- The most important changes in both time-series come from updated EDGAR data. EDGAR has updated full time-series with the main change coming from the waste sector. Other high contributions come from N2O in 1.A (much higher after 2014) and fugitive CH4 (1.B.1 and 1.B.2, only latest years changed)
Changes by sector and gas
For each scenario and time frame the changes are displayed for all individual sectors and all individual gases. In the sector plot we use aggregate Kyoto GHGs in AR6GWP100. In the gas plot we usenational total emissions without LULUCF.
country reported scenario
2023

1990-2023


third party scenario
2023

1990-2023
Detailed changes for the scenarios:
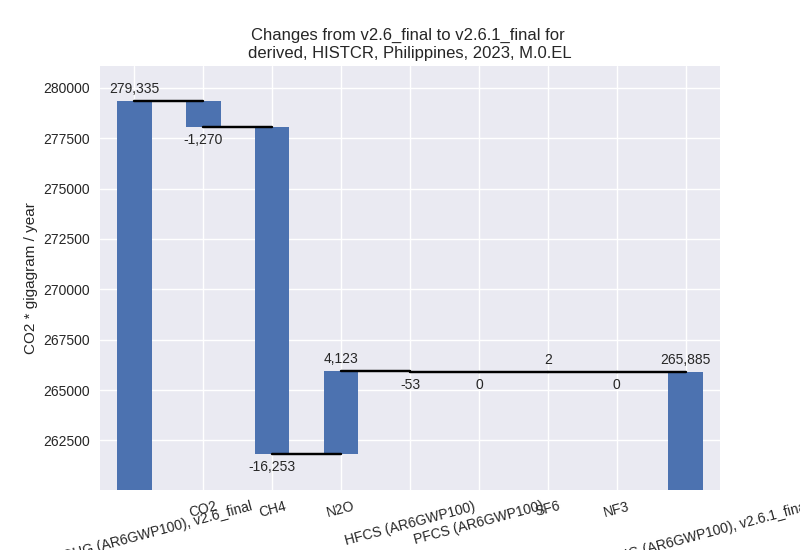
country reported scenario (HISTCR):
Most important changes per time frame
For 2023 the following sector-gas combinations have the highest absolute impact on national total KyotoGHG (AR6GWP100) emissions in 2023 (top 5):
- 1: 4, CH4 with -13061.18 Gg CO2 / year (-56.0%)
- 2: 1.A, N2O with 4135.97 Gg CO2 / year (412.8%)
- 3: 1.B.1, CH4 with -1918.49 Gg CO2 / year (-16.1%)
- 4: 1.B.2, CH4 with -797.11 Gg CO2 / year (-67.1%)
- 5: 2, CO2 with -641.98 Gg CO2 / year (-5.6%)
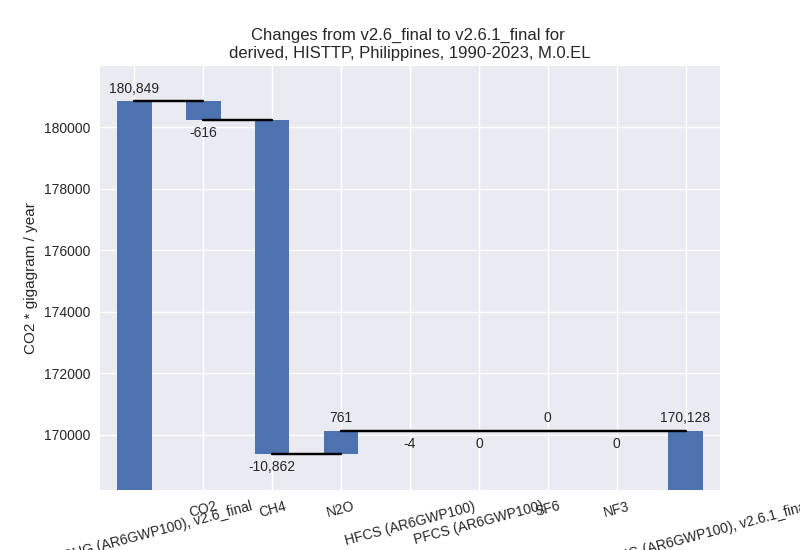
For 1990-2023 the following sector-gas combinations have the highest absolute impact on national total KyotoGHG (AR6GWP100) emissions in 1990-2023 (top 5):
- 1: 4, CH4 with -10118.81 Gg CO2 / year (-57.3%)
- 2: 1.A, N2O with 775.66 Gg CO2 / year (100.1%)
- 3: 1.B.2, CH4 with -644.89 Gg CO2 / year (-60.8%)
- 4: 2, CO2 with -562.96 Gg CO2 / year (-8.0%)
- 5: 1.B.1, CH4 with -84.62 Gg CO2 / year (-1.5%)
Changes in the main sectors for aggregate KyotoGHG (AR6GWP100) are
- 1: Total sectoral emissions in 2022 are 155122.68 Gg CO2 / year which is 61.2% of M.0.EL emissions. 2023 Emissions have changed by 0.9% (1477.52 Gg CO2 / year). 1990-2023 Emissions have changed by 0.1% (53.95 Gg CO2 / year).
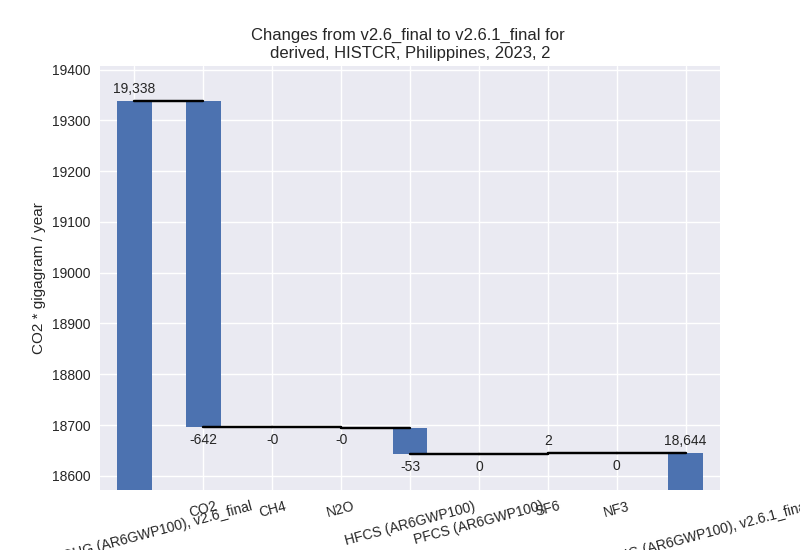
- 2: Total sectoral emissions in 2022 are 18090.00 Gg
CO2 / year which is 7.1% of M.0.EL emissions. 2023 Emissions have
changed by -3.6% (-693.09 Gg CO2 /
year). 1990-2023 Emissions have changed by -5.8% (-566.61 Gg CO2 / year). For 2023
the changes per gas
are:
For 1990-2023 the changes per gas are: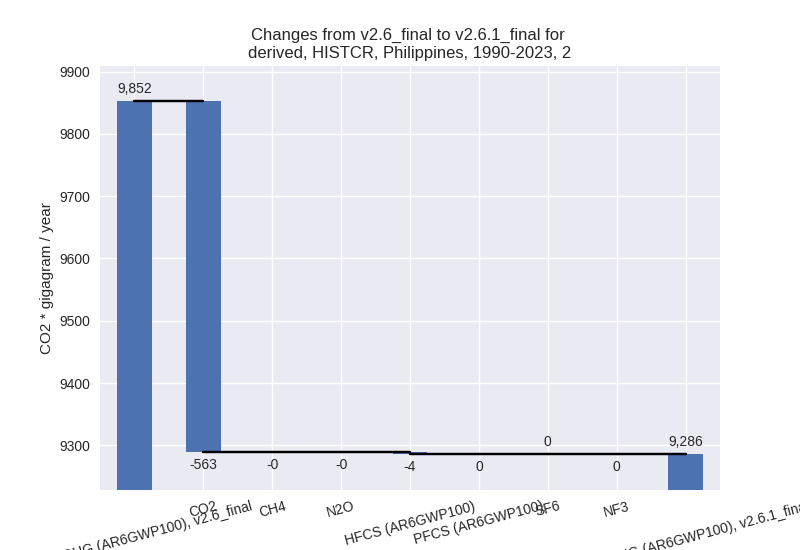
- M.AG: Total sectoral emissions in 2022 are 67679.66 Gg CO2 / year which is 26.7% of M.0.EL emissions. 2023 Emissions have changed by -1.8% (-1220.33 Gg CO2 / year). 1990-2023 Emissions have changed by -0.1% (-72.16 Gg CO2 / year).
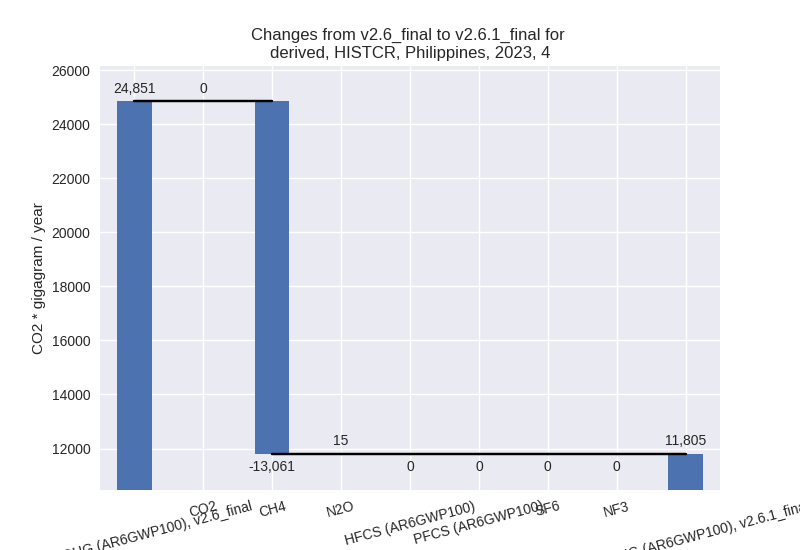
- 4: Total sectoral emissions in 2022 are 11547.04 Gg
CO2 / year which is 4.6% of M.0.EL emissions. 2023 Emissions have
changed by -52.5% (-13045.72 Gg CO2
/ year). 1990-2023 Emissions have changed by -54.1% (-10115.36 Gg CO2 / year). For 2023
the changes per gas
are:
For 1990-2023 the changes per gas are:
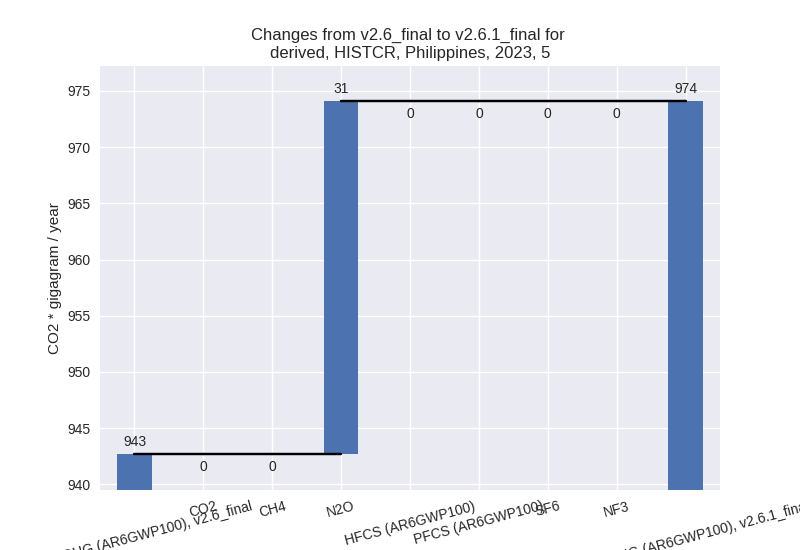
- 5: Total sectoral emissions in 2022 are 932.15 Gg
CO2 / year which is 0.4% of M.0.EL emissions. 2023 Emissions have
changed by 3.3% (31.39 Gg CO2 /
year). 1990-2023 Emissions have changed by -2.4% (-20.35 Gg CO2 / year). For 2023 the
changes per gas
are:
For 1990-2023 the changes per gas are: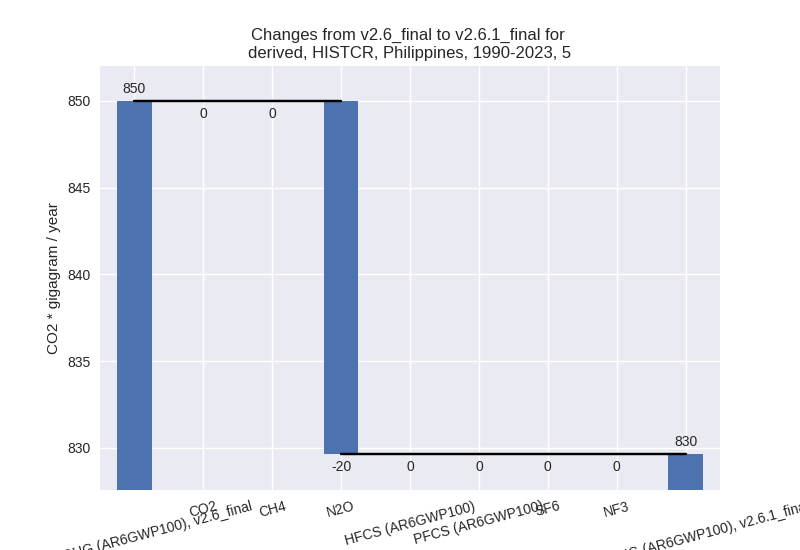
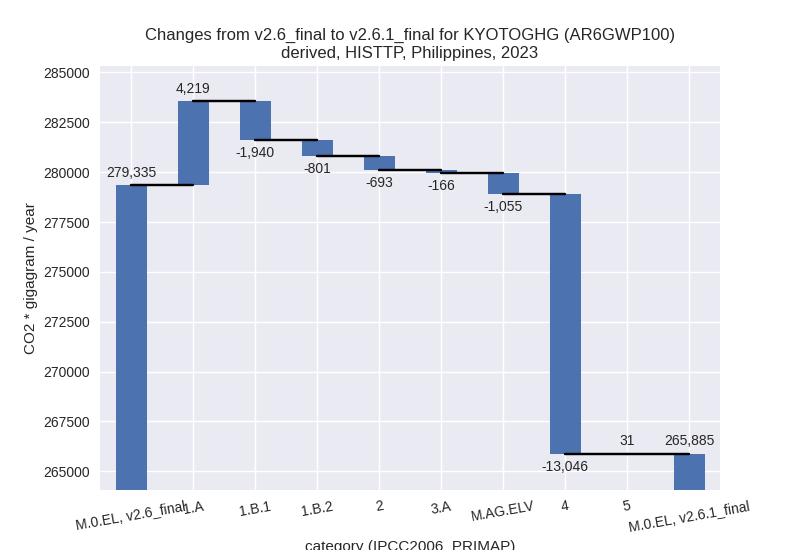
third party scenario (HISTTP):
Most important changes per time frame
For 2023 the following sector-gas combinations have the highest absolute impact on national total KyotoGHG (AR6GWP100) emissions in 2023 (top 5):
- 1: 4, CH4 with -13061.18 Gg CO2 / year (-56.0%)
- 2: 1.A, N2O with 4135.97 Gg CO2 / year (412.8%)
- 3: 1.B.1, CH4 with -1918.49 Gg CO2 / year (-16.1%)
- 4: 1.B.2, CH4 with -797.11 Gg CO2 / year (-67.1%)
- 5: 2, CO2 with -641.98 Gg CO2 / year (-5.6%)
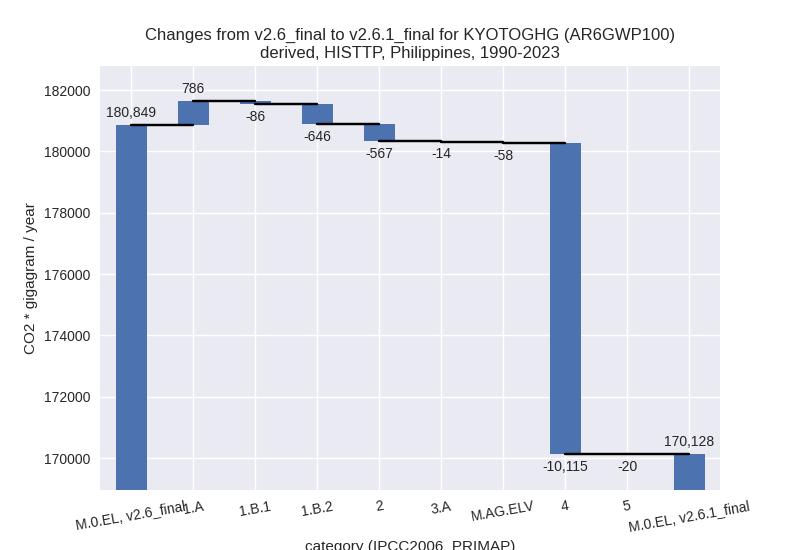
For 1990-2023 the following sector-gas combinations have the highest absolute impact on national total KyotoGHG (AR6GWP100) emissions in 1990-2023 (top 5):
- 1: 4, CH4 with -10118.81 Gg CO2 / year (-57.3%)
- 2: 1.A, N2O with 775.66 Gg CO2 / year (100.1%)
- 3: 1.B.2, CH4 with -644.89 Gg CO2 / year (-60.8%)
- 4: 2, CO2 with -562.96 Gg CO2 / year (-8.0%)
- 5: 1.B.1, CH4 with -84.62 Gg CO2 / year (-1.5%)
Changes in the main sectors for aggregate KyotoGHG (AR6GWP100) are
- 1: Total sectoral emissions in 2022 are 155122.68 Gg CO2 / year which is 61.2% of M.0.EL emissions. 2023 Emissions have changed by 0.9% (1477.52 Gg CO2 / year). 1990-2023 Emissions have changed by 0.1% (53.95 Gg CO2 / year).
- 2: Total sectoral emissions in 2022 are 18090.00 Gg
CO2 / year which is 7.1% of M.0.EL emissions. 2023 Emissions have
changed by -3.6% (-693.09 Gg CO2 /
year). 1990-2023 Emissions have changed by -5.8% (-566.61 Gg CO2 / year). For 2023
the changes per gas
are:

For 1990-2023 the changes per gas are:
- M.AG: Total sectoral emissions in 2022 are 67679.66 Gg CO2 / year which is 26.7% of M.0.EL emissions. 2023 Emissions have changed by -1.8% (-1220.33 Gg CO2 / year). 1990-2023 Emissions have changed by -0.1% (-72.16 Gg CO2 / year).
- 4: Total sectoral emissions in 2022 are 11547.04 Gg
CO2 / year which is 4.6% of M.0.EL emissions. 2023 Emissions have
changed by -52.5% (-13045.72 Gg CO2
/ year). 1990-2023 Emissions have changed by -54.1% (-10115.36 Gg CO2 / year). For 2023
the changes per gas
are:

For 1990-2023 the changes per gas are:
- 5: Total sectoral emissions in 2022 are 932.15 Gg
CO2 / year which is 0.4% of M.0.EL emissions. 2023 Emissions have
changed by 3.3% (31.39 Gg CO2 /
year). 1990-2023 Emissions have changed by -2.4% (-20.35 Gg CO2 / year). For 2023 the
changes per gas
are:

For 1990-2023 the changes per gas are: