Changes in PRIMAP-hist v2.6.1_final compared to v2.6_final for Papua New Guinea
2025-03-19
Johannes Gütschow
Change analysis for Papua New Guinea for PRIMAP-hist v2.6.1_final compared to v2.6_final
Overview over emissions by sector and gas
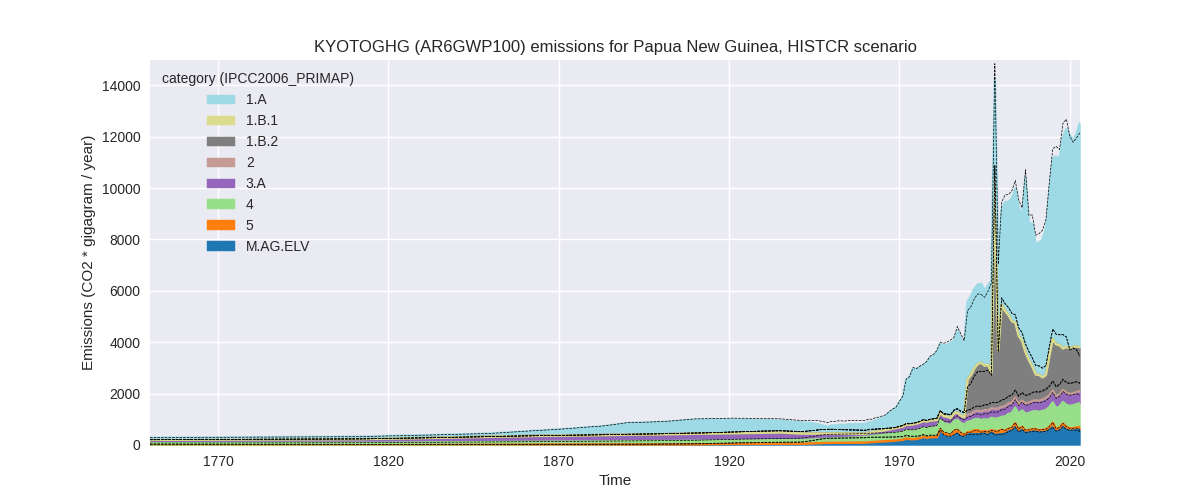
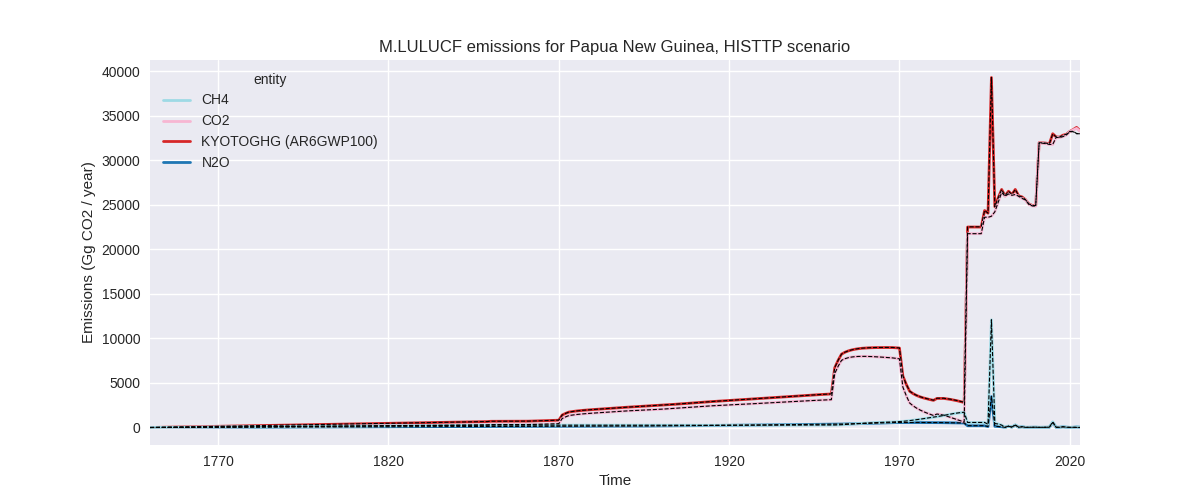
The following figures show the aggregate national total emissions excluding LULUCF AR6GWP100 for the country reported priority scenario. The dotted linesshow the v2.6_final data.
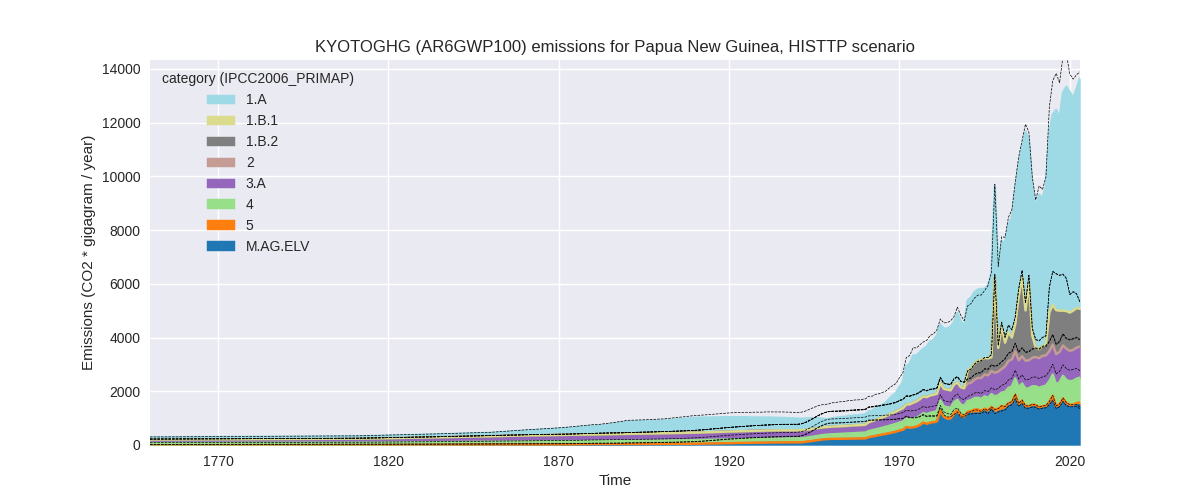
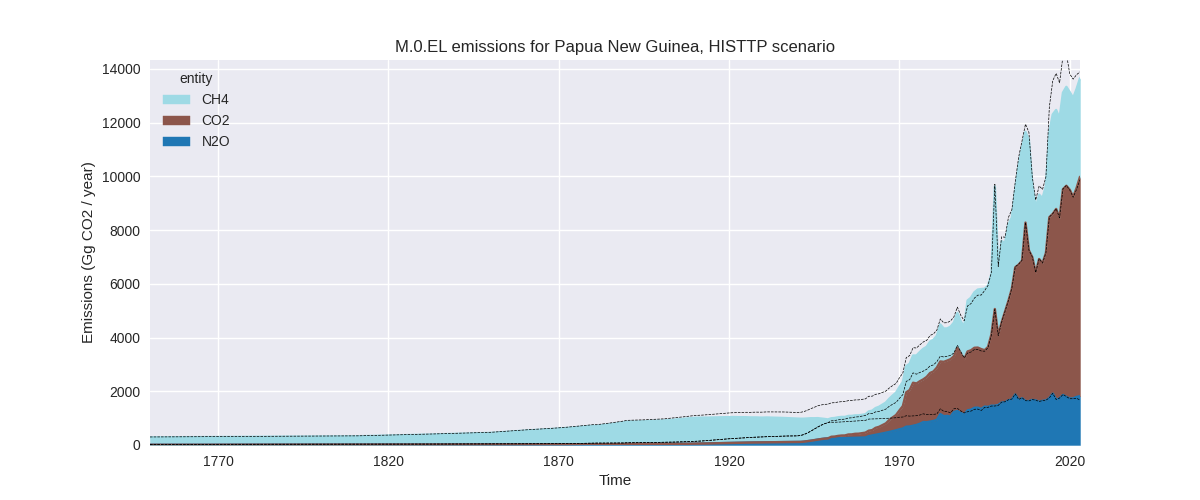
The following figures show the aggregate national total emissions excluding LULUCF AR6GWP100 for the third party priority scenario. The dotted linesshow the v2.6_final data.
Overview over changes
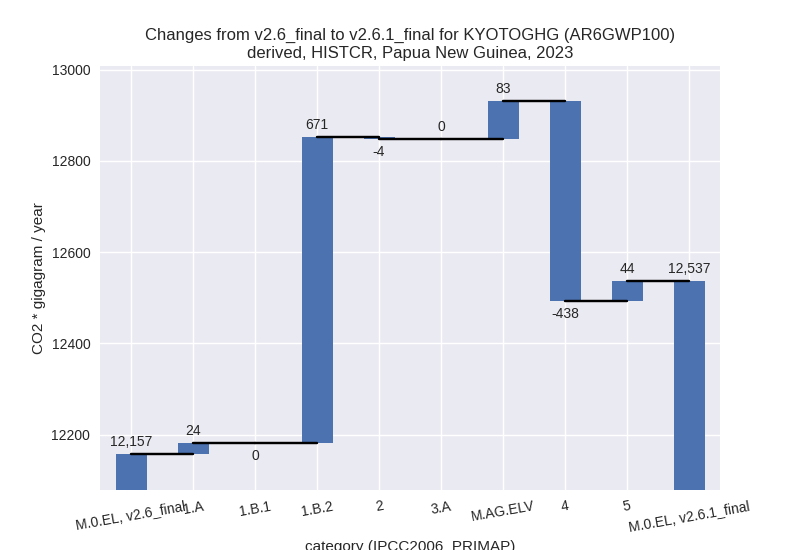
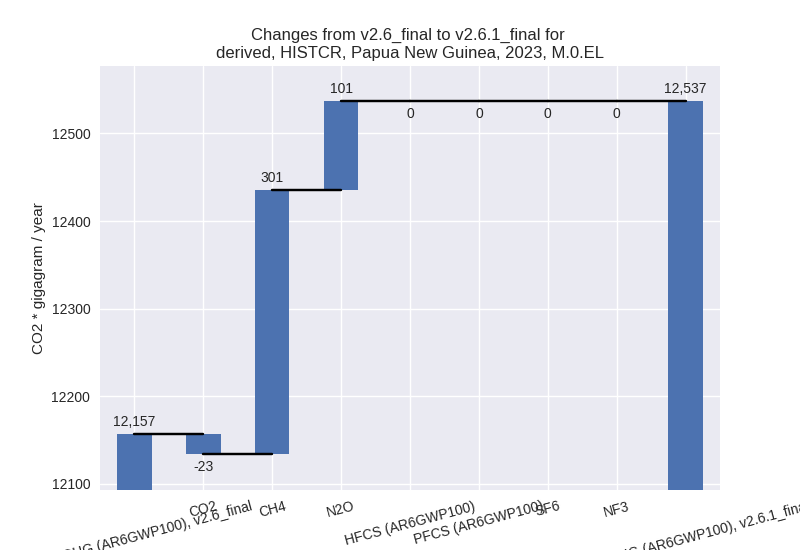
In the country reported priority scenario we have the following changes for aggregate Kyoto GHG and national total emissions excluding LULUCF (M.0.EL):
- Emissions in 2023 have changed by 3.1%% (379.77 Gg CO2 / year)
- Emissions in 1990-2023 have changed by -1.4%% (-129.17 Gg CO2 / year)
In the third party priority scenario we have the following changes for aggregate Kyoto GHG and national total emissions excluding LULUCF (M.0.EL):
- Emissions in 2023 have changed by -1.7%% (-238.60 Gg CO2 / year)
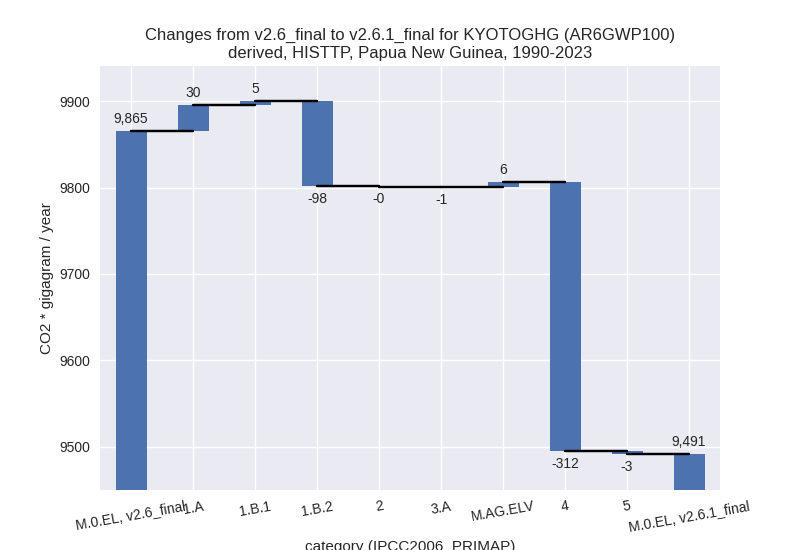
- Emissions in 1990-2023 have changed by -3.8%% (-373.79 Gg CO2 / year)
Most important changes per scenario and time frame
In the country reported priority scenario the following sector-gas combinations have the highest absolute impact on national total KyotoGHG (AR6GWP100) emissions in 2023 (top 5):
- 1: 1.B.2, CH4 with 690.41 Gg CO2 / year (71.8%)
- 2: 4, CH4 with -437.49 Gg CO2 / year (-34.8%)
- 3: M.AG.ELV, CH4 with 48.49 Gg CO2 / year (inf%)
- 4: 5, N2O with 43.97 Gg CO2 / year (77.5%)
- 5: M.AG.ELV, N2O with 34.40 Gg CO2 / year (6.6%)
In the country reported priority scenario the following sector-gas combinations have the highest absolute impact on national total KyotoGHG (AR6GWP100) emissions in 1990-2023 (top 5):
- 1: 4, CH4 with -311.79 Gg CO2 / year (-34.8%)
- 2: 1.B.2, CH4 with 166.82 Gg CO2 / year (8.8%)
- 3: 1.A, N2O with 12.19 Gg CO2 / year (10.8%)
- 4: 1.A, CH4 with 3.37 Gg CO2 / year (5.8%)
- 5: 5, N2O with -3.31 Gg CO2 / year (-3.0%)
In the third party priority scenario the following sector-gas combinations have the highest absolute impact on national total KyotoGHG (AR6GWP100) emissions in 2023 (top 5):
- 1: 4, CH4 with -437.49 Gg CO2 / year (-34.8%)
- 2: M.AG.ELV, N2O with 89.30 Gg CO2 / year (6.6%)
- 3: M.AG.ELV, CH4 with 48.49 Gg CO2 / year (inf%)
- 4: 5, N2O with 43.97 Gg CO2 / year (77.5%)
- 5: 1.B.2, CH4 with 38.30 Gg CO2 / year (3.2%)
In the third party priority scenario the following sector-gas combinations have the highest absolute impact on national total KyotoGHG (AR6GWP100) emissions in 1990-2023 (top 5):
- 1: 4, CH4 with -311.79 Gg CO2 / year (-34.8%)
- 2: 1.B.2, CH4 with -102.86 Gg CO2 / year (-9.4%)
- 3: 1.A, CH4 with 24.11 Gg CO2 / year (5.9%)
- 4: 1.A, N2O with 5.91 Gg CO2 / year (7.0%)
- 5: 1.B.1, CH4 with 4.79 Gg CO2 / year (47.2%)
Notes on data changes
Here we list notes explaining important emissions changes for the country.
- No new country reported data has been included. Country reported
data covers only 2000-2017 thus the third party data has a high
influence on the CR time-series. Changes in the CR time-series come from
updated third party data (EDGAR, FAO) which is used to extrapolate the
country reported data.
- Emissions in some sectors (e.g. waste, M.AG.ELV, CH4, 5) have no country reported data and changes come directly from EDGAR and FAO data.
- In M.AG.ELV, N2O we have changes before 1990 which come from updated FAO data.
- In the TP time-series changes in M.AG.ELV are higher as the are scaled to the lower country reported data in the CR scenario.
Changes by sector and gas
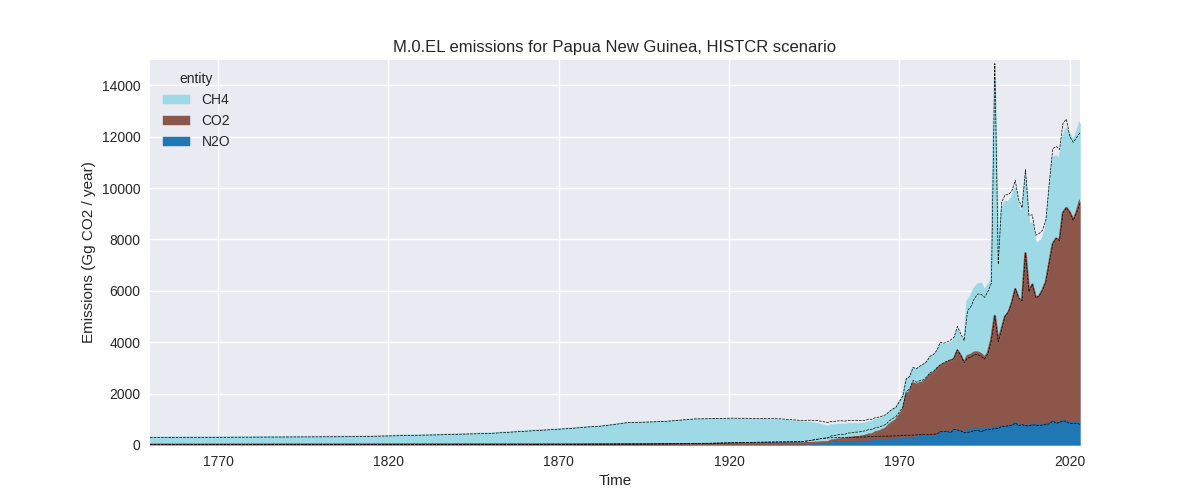
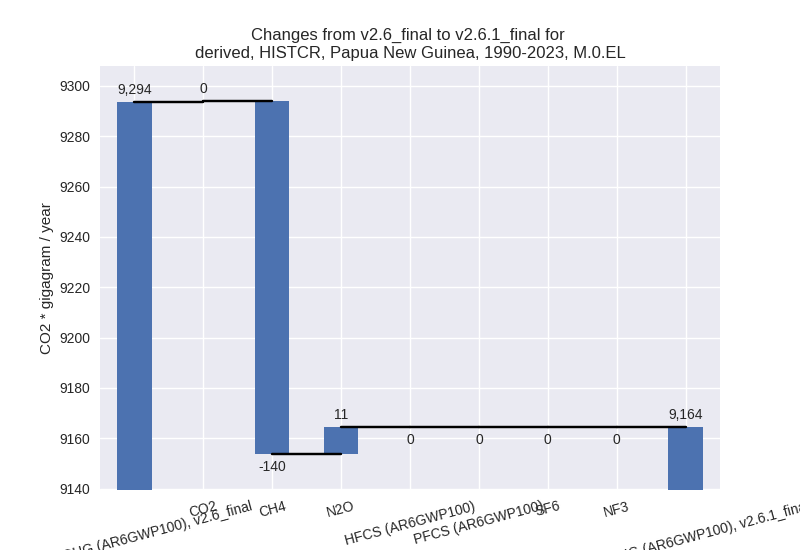
For each scenario and time frame the changes are displayed for all individual sectors and all individual gases. In the sector plot we use aggregate Kyoto GHGs in AR6GWP100. In the gas plot we usenational total emissions without LULUCF.
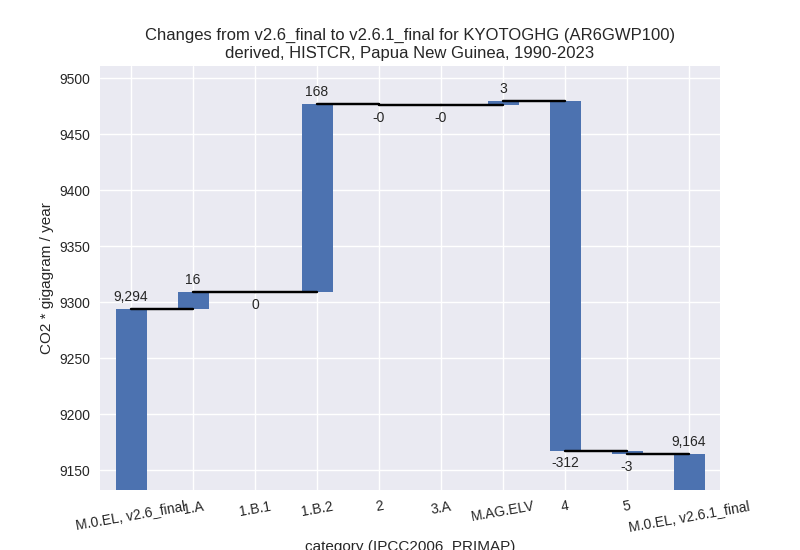
country reported scenario
2023
1990-2023
third party scenario
2023
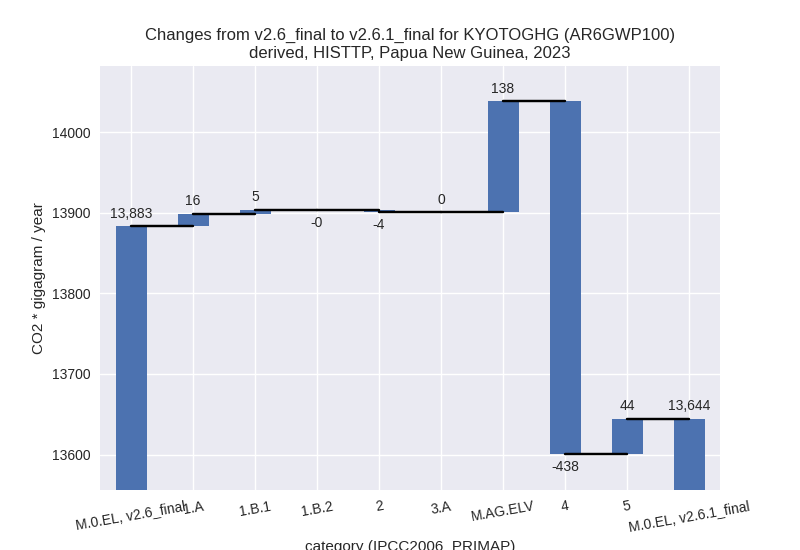
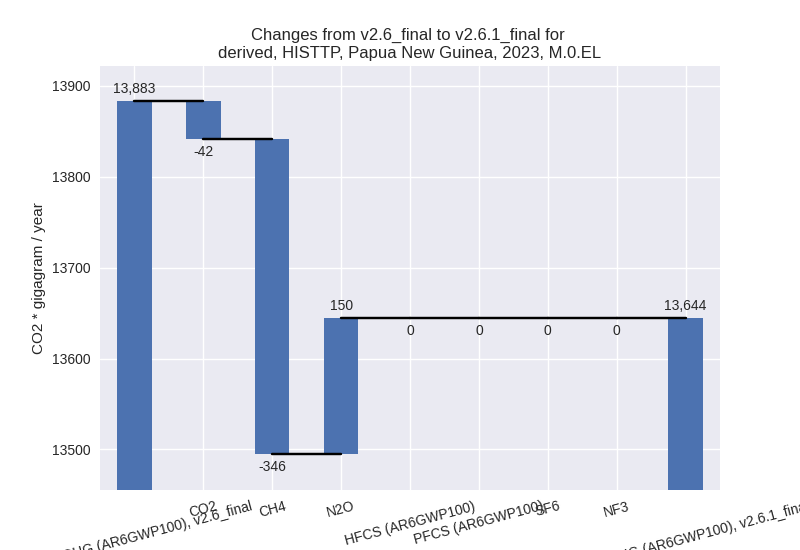
1990-2023

Detailed changes for the scenarios:
country reported scenario (HISTCR):
Most important changes per time frame
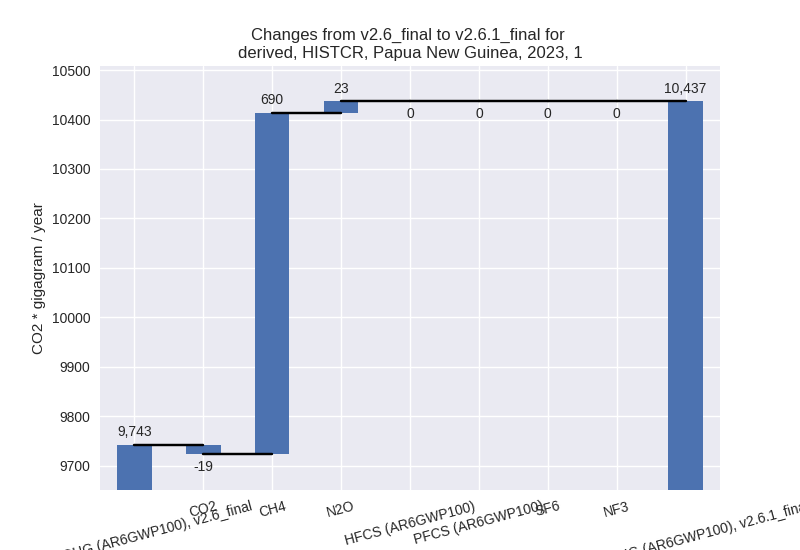
For 2023 the following sector-gas combinations have the highest absolute impact on national total KyotoGHG (AR6GWP100) emissions in 2023 (top 5):
- 1: 1.B.2, CH4 with 690.41 Gg CO2 / year (71.8%)
- 2: 4, CH4 with -437.49 Gg CO2 / year (-34.8%)
- 3: M.AG.ELV, CH4 with 48.49 Gg CO2 / year (inf%)
- 4: 5, N2O with 43.97 Gg CO2 / year (77.5%)
- 5: M.AG.ELV, N2O with 34.40 Gg CO2 / year (6.6%)
For 1990-2023 the following sector-gas combinations have the highest absolute impact on national total KyotoGHG (AR6GWP100) emissions in 1990-2023 (top 5):
- 1: 4, CH4 with -311.79 Gg CO2 / year (-34.8%)
- 2: 1.B.2, CH4 with 166.82 Gg CO2 / year (8.8%)
- 3: 1.A, N2O with 12.19 Gg CO2 / year (10.8%)
- 4: 1.A, CH4 with 3.37 Gg CO2 / year (5.8%)
- 5: 5, N2O with -3.31 Gg CO2 / year (-3.0%)
Changes in the main sectors for aggregate KyotoGHG (AR6GWP100) are
- 1: Total sectoral emissions in 2022 are 10050.55 Gg
CO2 / year which is 83.0% of M.0.EL emissions. 2023 Emissions have
changed by 7.1% (694.35 Gg CO2 /
year). 1990-2023 Emissions have changed by 2.5% (183.11 Gg CO2 / year). For 2023 the
changes per gas
are:
For 1990-2023 the changes per gas are: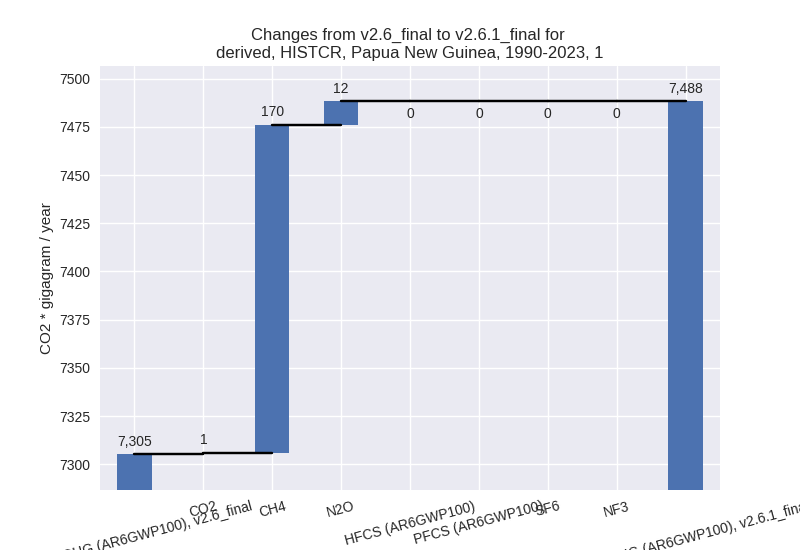
The changes come from the following subsectors:- 1.A: Total sectoral emissions in 2022 are 8273.19 Gg CO2 / year which is 82.3% of category 1 emissions. 2023 Emissions have changed by 0.3% (23.51 Gg CO2 / year). 1990-2023 Emissions have changed by 0.3% (15.55 Gg CO2 / year).
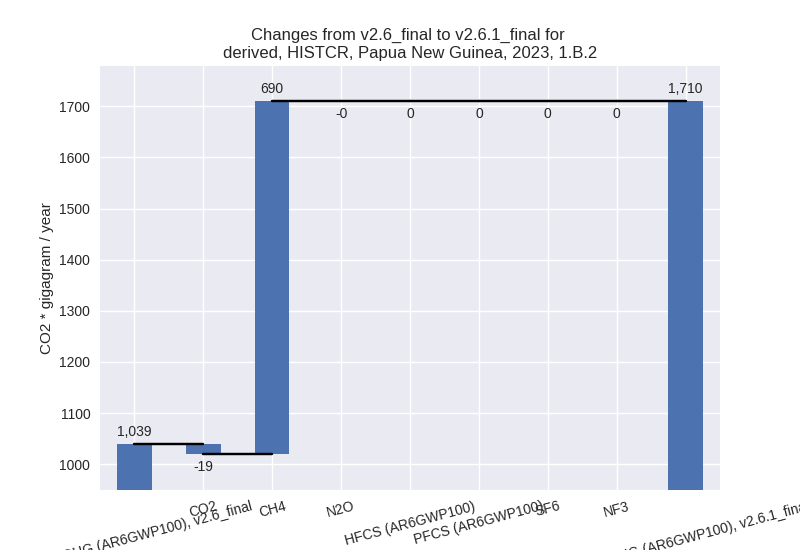
- 1.B.2: Total sectoral emissions in 2022 are 1777.36
Gg CO2 / year which is 17.7% of category 1 emissions. 2023 Emissions
have changed by 64.6% (670.83 Gg CO2
/ year). 1990-2023 Emissions have changed by 8.4% (167.56 Gg CO2 / year). For 2023 the
changes per gas
are:
For 1990-2023 the changes per gas are: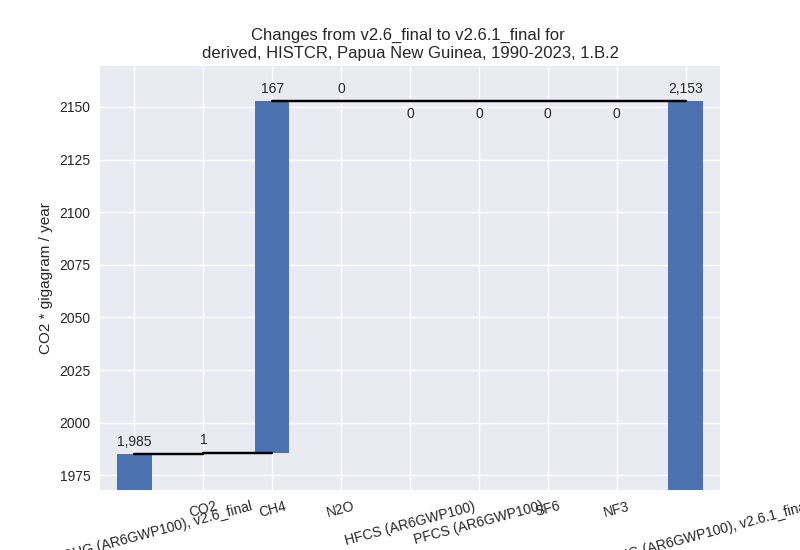
There is no subsector information available in PRIMAP-hist.
- 2: Total sectoral emissions in 2022 are 19.62 Gg
CO2 / year which is 0.2% of M.0.EL emissions. 2023 Emissions have
changed by -16.7% (-3.58 Gg CO2 /
year). 1990-2023 Emissions have changed by -1.8% (-0.39 Gg CO2 / year). For 2023 the
changes per gas
are:

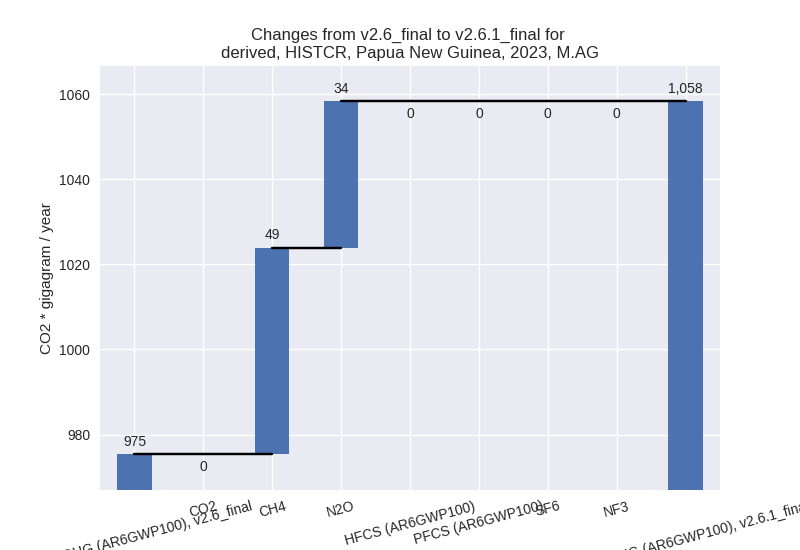
- M.AG: Total sectoral emissions in 2022 are 1052.82
Gg CO2 / year which is 8.7% of M.0.EL emissions. 2023 Emissions have
changed by 8.5% (82.94 Gg CO2 /
year). 1990-2023 Emissions have changed by 0.3% (2.98 Gg CO2 / year). For 2023 the
changes per gas
are:
The changes come from the following subsectors:- 3.A: Total sectoral emissions in 2022 are 454.20 Gg CO2 / year which is 43.1% of category M.AG emissions. 2023 Emissions have changed by 0.0% (0.05 Gg CO2 / year). 1990-2023 Emissions have changed by -0.1% (-0.43 Gg CO2 / year).
- M.AG.ELV: Total sectoral emissions in 2022 are
598.62 Gg CO2 / year which is 56.9% of category M.AG emissions. 2023
Emissions have changed by 16.0%
(82.88 Gg CO2 / year). 1990-2023 Emissions have changed by 0.7% (3.41 Gg CO2 / year). For 2023 the
changes per gas
are:
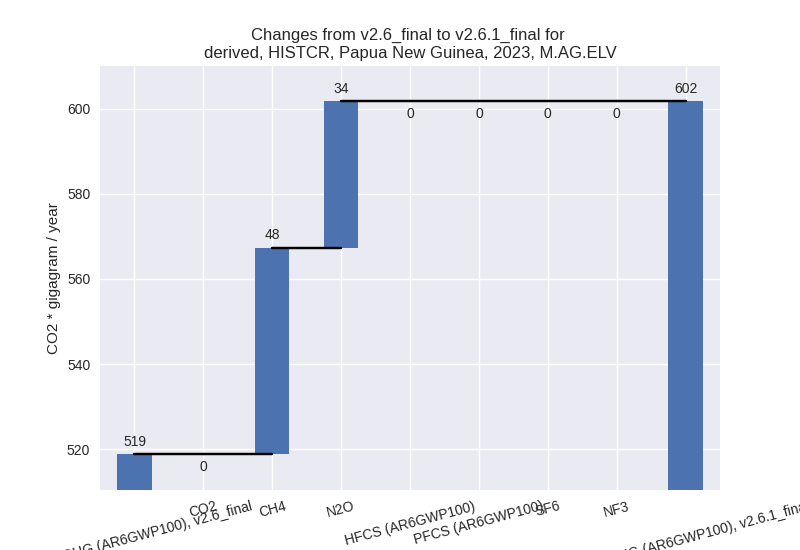
There is no subsector information available in PRIMAP-hist.
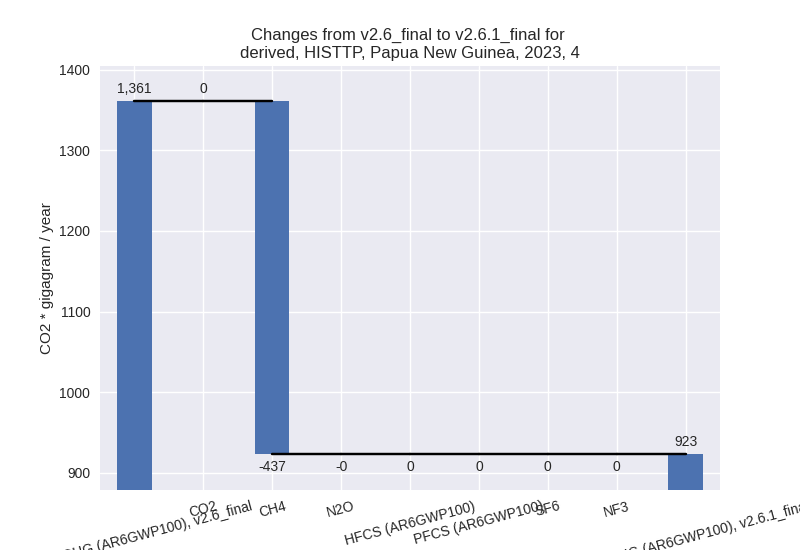
- 4: Total sectoral emissions in 2022 are 906.27 Gg
CO2 / year which is 7.5% of M.0.EL emissions. 2023 Emissions have
changed by -32.2% (-437.90 Gg CO2 /
year). 1990-2023 Emissions have changed by -32.6% (-311.56 Gg CO2 / year). For 2023
the changes per gas
are:

For 1990-2023 the changes per gas are:
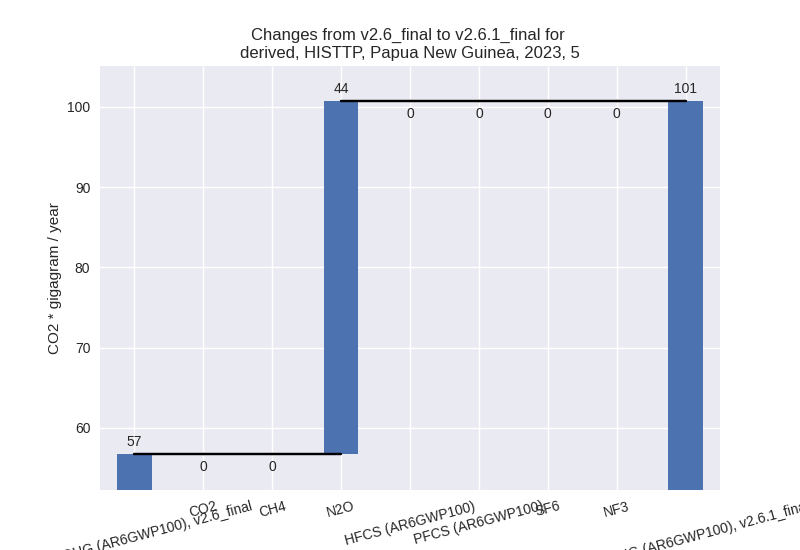
- 5: Total sectoral emissions in 2022 are 83.38 Gg
CO2 / year which is 0.7% of M.0.EL emissions. 2023 Emissions have
changed by 77.5% (43.97 Gg CO2 /
year). 1990-2023 Emissions have changed by -3.0% (-3.31 Gg CO2 / year). For 2023 the
changes per gas
are:

For 1990-2023 the changes per gas are: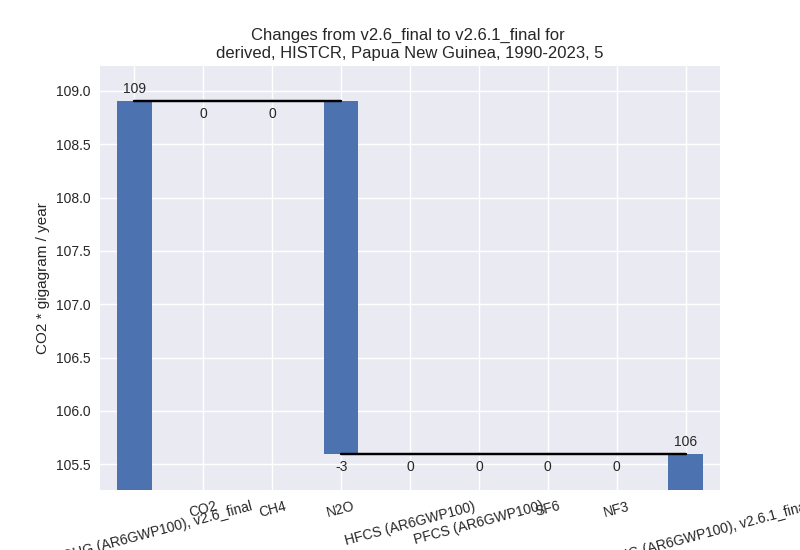
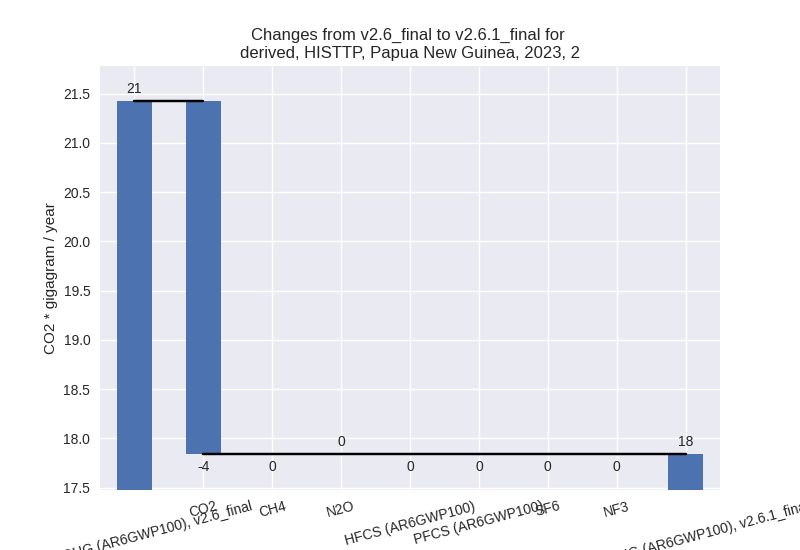
third party scenario (HISTTP):
Most important changes per time frame
For 2023 the following sector-gas combinations have the highest absolute impact on national total KyotoGHG (AR6GWP100) emissions in 2023 (top 5):
- 1: 4, CH4 with -437.49 Gg CO2 / year (-34.8%)
- 2: M.AG.ELV, N2O with 89.30 Gg CO2 / year (6.6%)
- 3: M.AG.ELV, CH4 with 48.49 Gg CO2 / year (inf%)
- 4: 5, N2O with 43.97 Gg CO2 / year (77.5%)
- 5: 1.B.2, CH4 with 38.30 Gg CO2 / year (3.2%)
For 1990-2023 the following sector-gas combinations have the highest absolute impact on national total KyotoGHG (AR6GWP100) emissions in 1990-2023 (top 5):
- 1: 4, CH4 with -311.79 Gg CO2 / year (-34.8%)
- 2: 1.B.2, CH4 with -102.86 Gg CO2 / year (-9.4%)
- 3: 1.A, CH4 with 24.11 Gg CO2 / year (5.9%)
- 4: 1.A, N2O with 5.91 Gg CO2 / year (7.0%)
- 5: 1.B.1, CH4 with 4.79 Gg CO2 / year (47.2%)
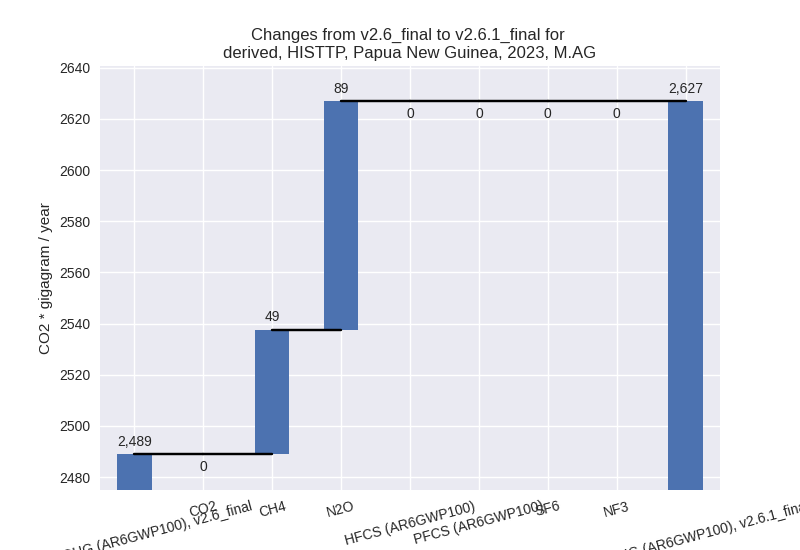
Changes in the main sectors for aggregate KyotoGHG (AR6GWP100) are
- 1: Total sectoral emissions in 2022 are 9624.22 Gg CO2 / year which is 72.7% of M.0.EL emissions. 2023 Emissions have changed by 0.2% (20.95 Gg CO2 / year). 1990-2023 Emissions have changed by -1.0% (-63.46 Gg CO2 / year).
- 2: Total sectoral emissions in 2022 are 19.62 Gg
CO2 / year which is 0.1% of M.0.EL emissions. 2023 Emissions have
changed by -16.7% (-3.58 Gg CO2 /
year). 1990-2023 Emissions have changed by -1.8% (-0.39 Gg CO2 / year). For 2023 the
changes per gas
are:
- M.AG: Total sectoral emissions in 2022 are 2613.02
Gg CO2 / year which is 19.7% of M.0.EL emissions. 2023 Emissions have
changed by 5.5% (137.96 Gg CO2 /
year). 1990-2023 Emissions have changed by 0.2% (4.94 Gg CO2 / year). For 2023 the
changes per gas
are:
The changes come from the following subsectors:- 3.A: Total sectoral emissions in 2022 are 1136.03 Gg CO2 / year which is 43.5% of category M.AG emissions. 2023 Emissions have changed by 0.0% (0.17 Gg CO2 / year). 1990-2023 Emissions have changed by -0.1% (-1.06 Gg CO2 / year).
- M.AG.ELV: Total sectoral emissions in 2022 are
1476.99 Gg CO2 / year which is 56.5% of category M.AG emissions. 2023
Emissions have changed by 10.2%
(137.79 Gg CO2 / year). 1990-2023 Emissions have changed by 0.4% (6.00 Gg CO2 / year). For 2023 the
changes per gas
are:

There is no subsector information available in PRIMAP-hist.
- 4: Total sectoral emissions in 2022 are 906.27 Gg
CO2 / year which is 6.8% of M.0.EL emissions. 2023 Emissions have
changed by -32.2% (-437.90 Gg CO2 /
year). 1990-2023 Emissions have changed by -32.6% (-311.56 Gg CO2 / year). For 2023
the changes per gas
are:
For 1990-2023 the changes per gas are:
- 5: Total sectoral emissions in 2022 are 83.38 Gg
CO2 / year which is 0.6% of M.0.EL emissions. 2023 Emissions have
changed by 77.5% (43.97 Gg CO2 /
year). 1990-2023 Emissions have changed by -3.0% (-3.31 Gg CO2 / year). For 2023 the
changes per gas
are:
For 1990-2023 the changes per gas are: