Changes in PRIMAP-hist v2.6.1_final compared to v2.6_final for Poland
2025-03-19
Johannes Gütschow
Change analysis for Poland for PRIMAP-hist v2.6.1_final compared to v2.6_final
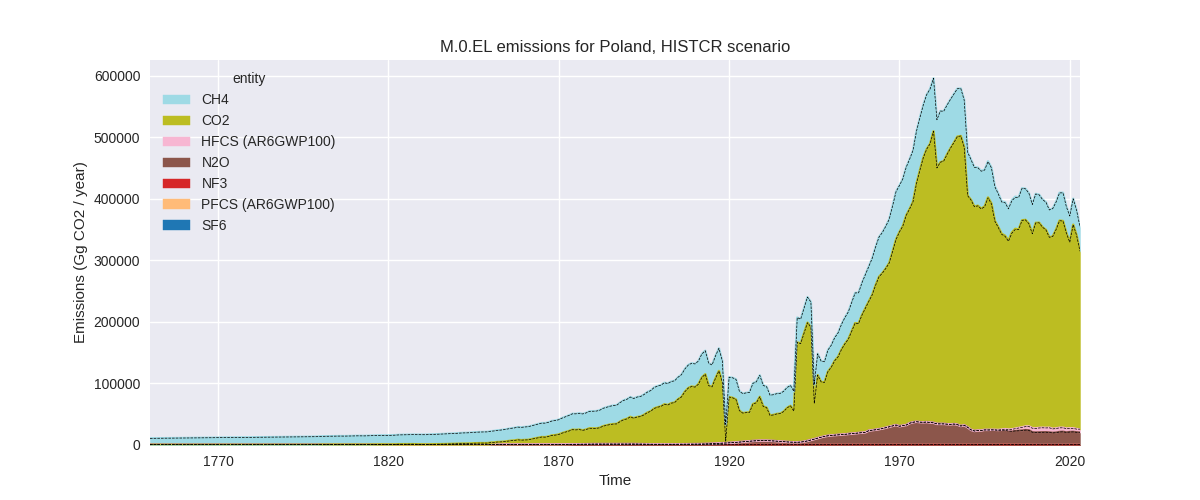
Overview over emissions by sector and gas
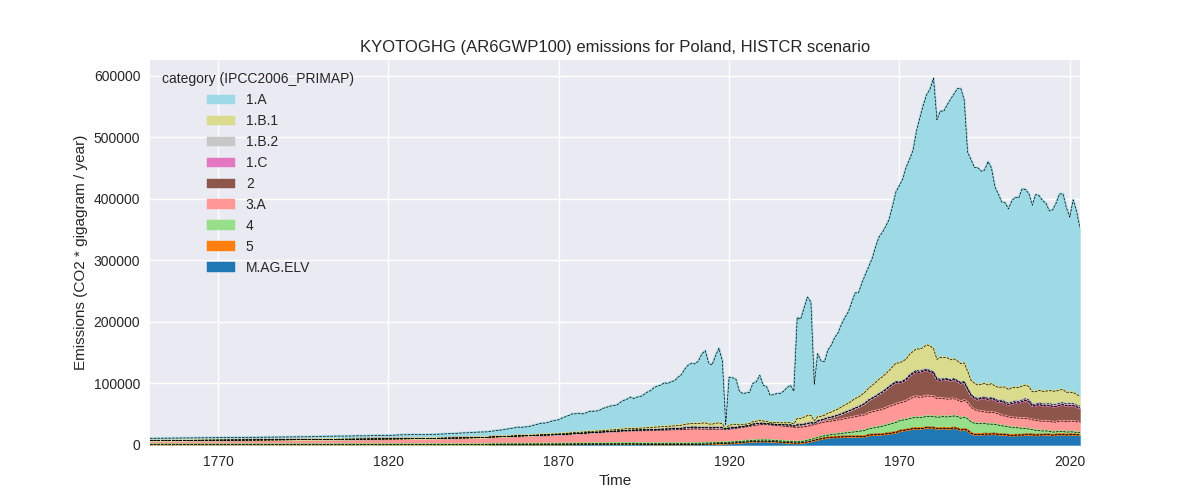
The following figures show the aggregate national total emissions excluding LULUCF AR6GWP100 for the country reported priority scenario. The dotted linesshow the v2.6_final data.
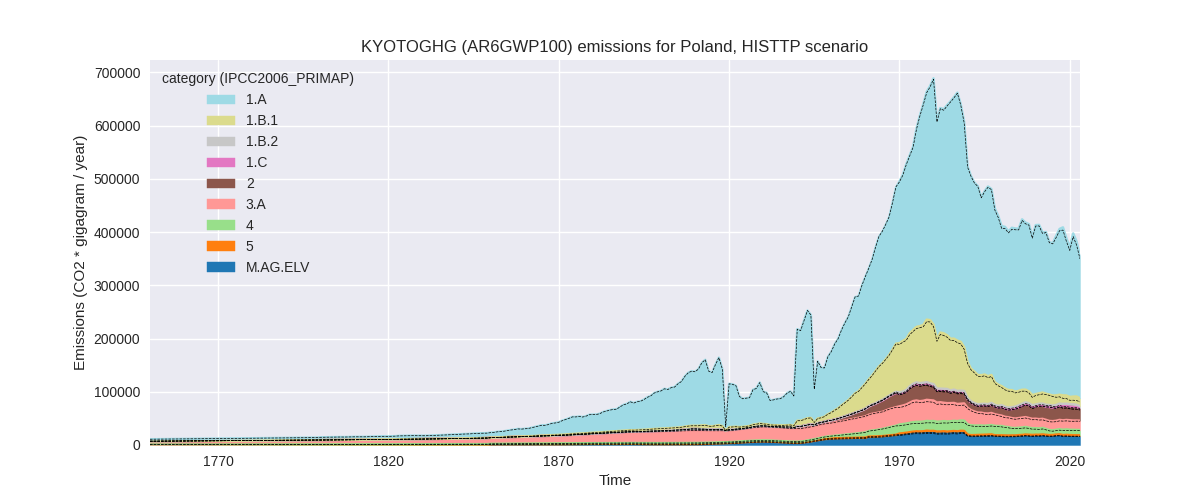
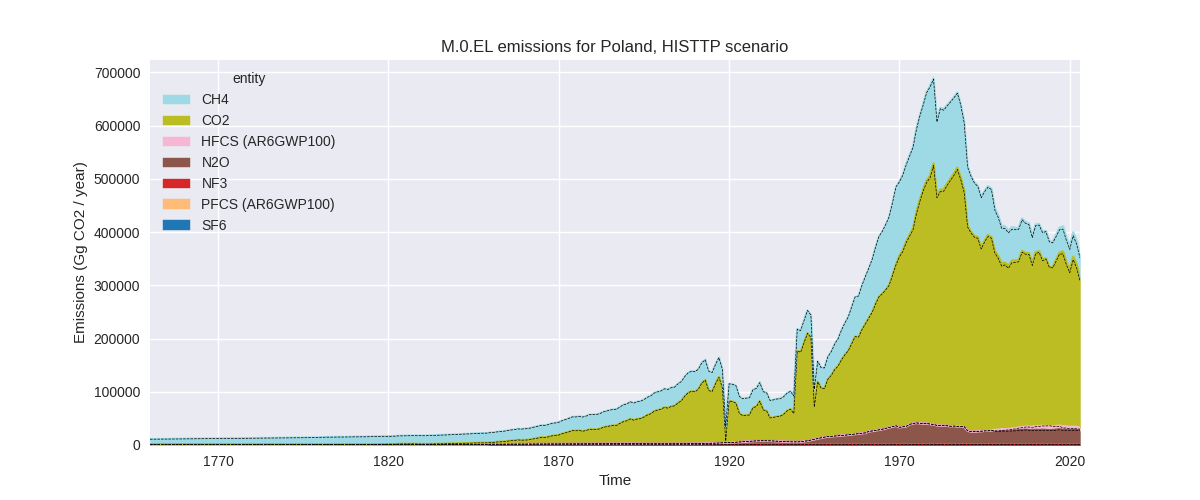
The following figures show the aggregate national total emissions excluding LULUCF AR6GWP100 for the third party priority scenario. The dotted linesshow the v2.6_final data.
Overview over changes
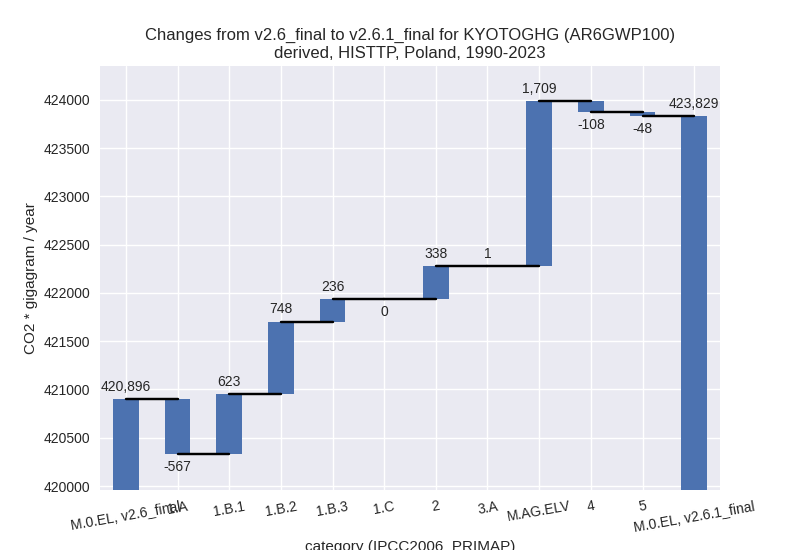
In the country reported priority scenario we have the following changes for aggregate Kyoto GHG and national total emissions excluding LULUCF (M.0.EL):
- Emissions in 2023 have changed by -0.5%% (-1711.62 Gg CO2 / year)
- Emissions in 1990-2023 have changed by 0.1%% (251.60 Gg CO2 / year)
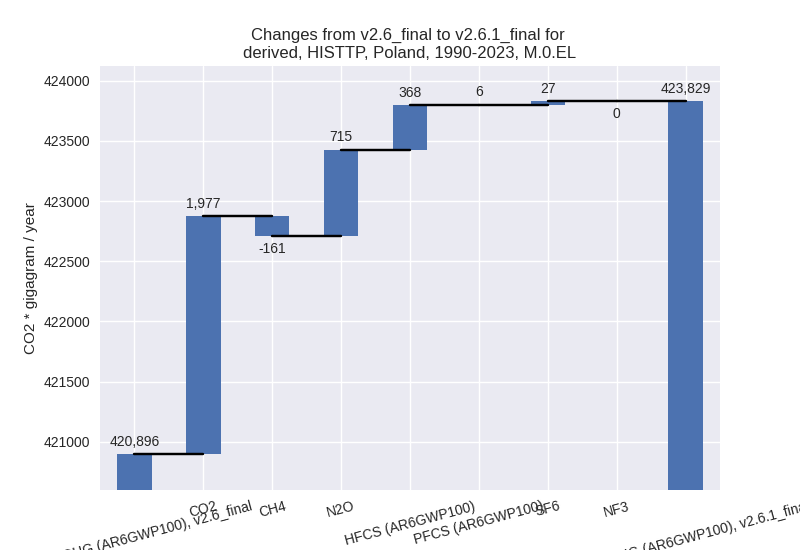
In the third party priority scenario we have the following changes for aggregate Kyoto GHG and national total emissions excluding LULUCF (M.0.EL):
- Emissions in 2023 have changed by 1.5%% (5394.07 Gg CO2 / year)
- Emissions in 1990-2023 have changed by 0.7%% (2932.60 Gg CO2 / year)
Most important changes per scenario and time frame
In the country reported priority scenario the following sector-gas combinations have the highest absolute impact on national total KyotoGHG (AR6GWP100) emissions in 2023 (top 5):
- 1: 1.B.1, CH4 with -951.61 Gg CO2 / year (-6.7%)
- 2: 2, CO2 with -345.87 Gg CO2 / year (-2.1%)
- 3: 1.A, N2O with -332.82 Gg CO2 / year (-12.8%)
- 4: 1.B.1, CO2 with 288.89 Gg CO2 / year (14.7%)
- 5: 3.A, CH4 with -270.55 Gg CO2 / year (-1.7%)
In the country reported priority scenario the following sector-gas combinations have the highest absolute impact on national total KyotoGHG (AR6GWP100) emissions in 1990-2023 (top 5):
- 1: 1.B.3, CO2 with 236.45 Gg CO2 / year (26.8%)
- 2: 2, HFCS (AR6GWP100) with 68.65 Gg CO2 / year (1.8%)
- 3: 1.B.1, CH4 with -27.99 Gg CO2 / year (-0.1%)
- 4: 2, CO2 with -10.17 Gg CO2 / year (-0.1%)
- 5: 1.A, N2O with -9.79 Gg CO2 / year (-0.4%)
In the third party priority scenario the following sector-gas combinations have the highest absolute impact on national total KyotoGHG (AR6GWP100) emissions in 2023 (top 5):
- 1: 2, HFCS (AR6GWP100) with 3221.93 Gg CO2 / year (136.0%)
- 2: 1.B.1, CO2 with 2465.93 Gg CO2 / year (101.4%)
- 3: 1.B.2, CH4 with 1736.32 Gg CO2 / year (69.3%)
- 4: M.AG.ELV, CO2 with 1645.28 Gg CO2 / year (21904.5%)
- 5: 1.A, CH4 with -1572.68 Gg CO2 / year (-28.4%)
In the third party priority scenario the following sector-gas combinations have the highest absolute impact on national total KyotoGHG (AR6GWP100) emissions in 1990-2023 (top 5):
- 1: M.AG.ELV, CO2 with 1708.65 Gg CO2 / year (3338.8%)
- 2: 1.A, CH4 with -1349.66 Gg CO2 / year (-23.9%)
- 3: 1.A, N2O with 782.75 Gg CO2 / year (25.1%)
- 4: 1.B.2, CH4 with 676.53 Gg CO2 / year (26.3%)
- 5: 1.B.1, CH4 with 487.60 Gg CO2 / year (1.8%)
Notes on data changes
Here we list notes explaining important emissions changes for the country.
- CRT data has been included but replaces official data reported to the EU which does not show noteworthy differences. Changes in the CR time-series are small and come from updated third party data (EDGAR, FAO) which is used to extrapolate the country reported data.
- TP scenario changes come directly from EDGAR.
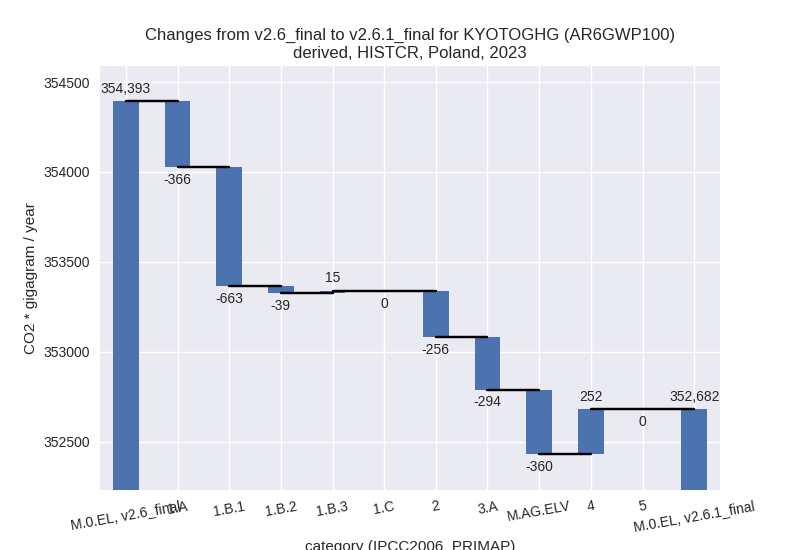
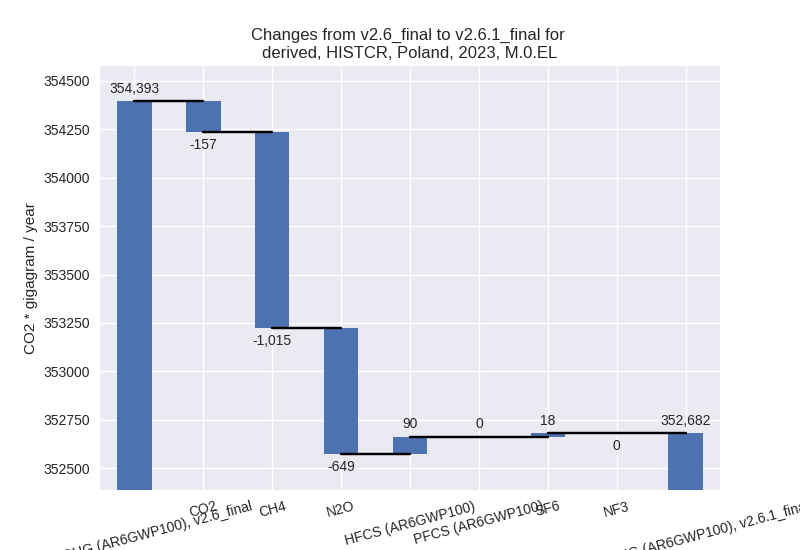
Changes by sector and gas
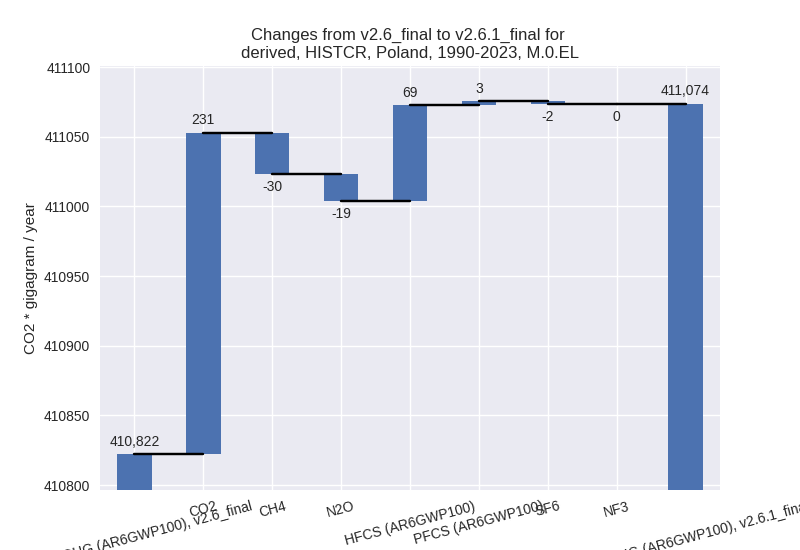
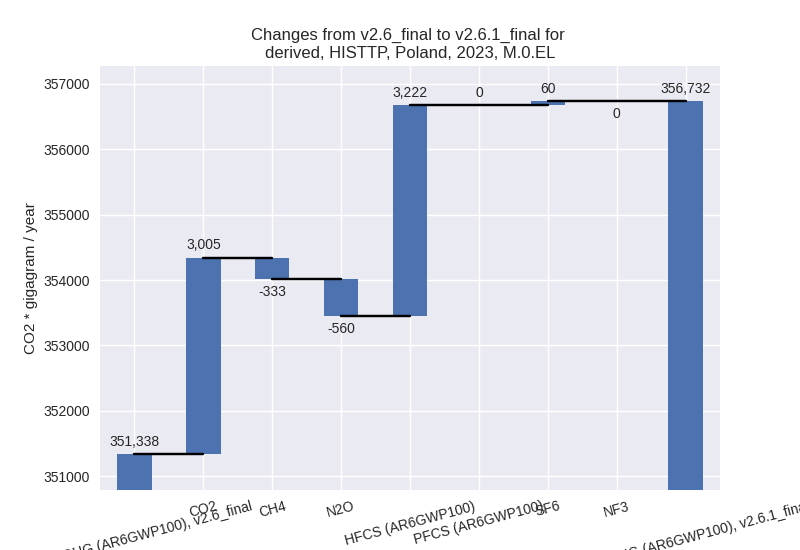
For each scenario and time frame the changes are displayed for all individual sectors and all individual gases. In the sector plot we use aggregate Kyoto GHGs in AR6GWP100. In the gas plot we usenational total emissions without LULUCF.
country reported scenario
2023
1990-2023
third party scenario
2023
1990-2023
Detailed changes for the scenarios:
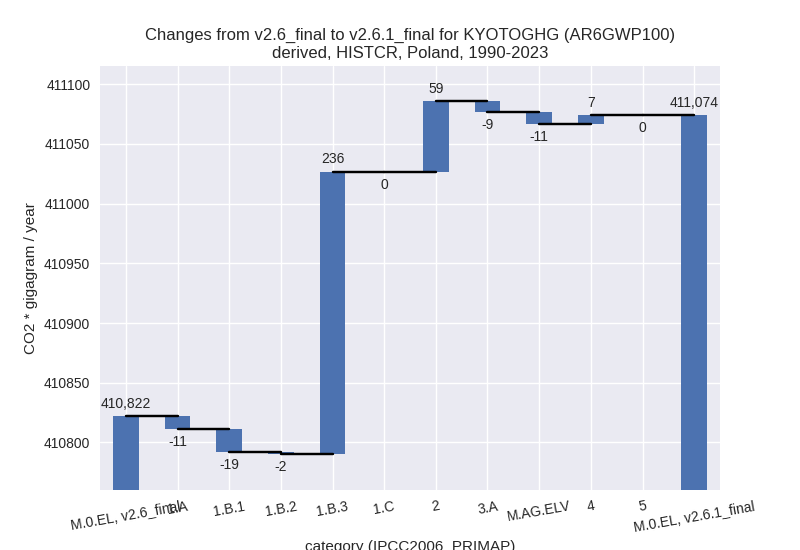
country reported scenario (HISTCR):
Most important changes per time frame
For 2023 the following sector-gas combinations have the highest absolute impact on national total KyotoGHG (AR6GWP100) emissions in 2023 (top 5):
- 1: 1.B.1, CH4 with -951.61 Gg CO2 / year (-6.7%)
- 2: 2, CO2 with -345.87 Gg CO2 / year (-2.1%)
- 3: 1.A, N2O with -332.82 Gg CO2 / year (-12.8%)
- 4: 1.B.1, CO2 with 288.89 Gg CO2 / year (14.7%)
- 5: 3.A, CH4 with -270.55 Gg CO2 / year (-1.7%)
For 1990-2023 the following sector-gas combinations have the highest absolute impact on national total KyotoGHG (AR6GWP100) emissions in 1990-2023 (top 5):
- 1: 1.B.3, CO2 with 236.45 Gg CO2 / year (26.8%)
- 2: 2, HFCS (AR6GWP100) with 68.65 Gg CO2 / year (1.8%)
- 3: 1.B.1, CH4 with -27.99 Gg CO2 / year (-0.1%)
- 4: 2, CO2 with -10.17 Gg CO2 / year (-0.1%)
- 5: 1.A, N2O with -9.79 Gg CO2 / year (-0.4%)
Changes in the main sectors for aggregate KyotoGHG (AR6GWP100) are
- 1: Total sectoral emissions in 2022 are 319327.45 Gg CO2 / year which is 83.7% of M.0.EL emissions. 2023 Emissions have changed by -0.4% (-1053.43 Gg CO2 / year). 1990-2023 Emissions have changed by 0.1% (204.48 Gg CO2 / year).
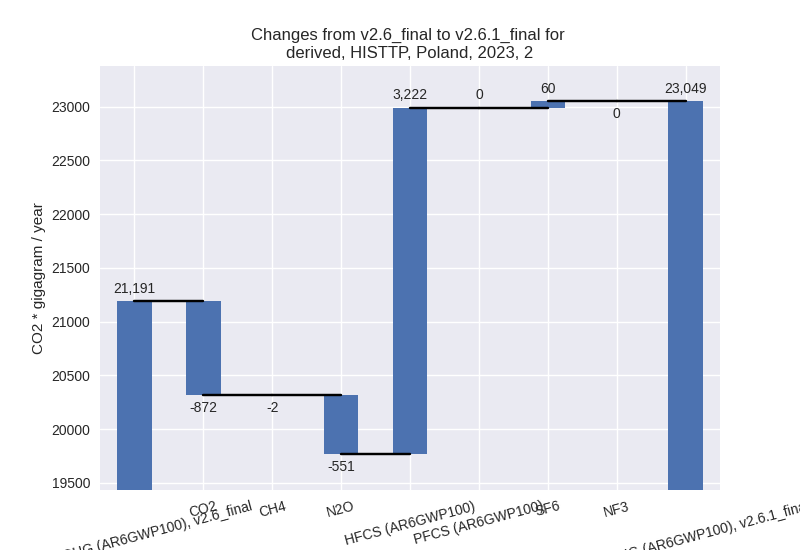
- 2: Total sectoral emissions in 2022 are 24510.45 Gg CO2 / year which is 6.4% of M.0.EL emissions. 2023 Emissions have changed by -1.1% (-255.52 Gg CO2 / year). 1990-2023 Emissions have changed by 0.2% (58.97 Gg CO2 / year).
- M.AG: Total sectoral emissions in 2022 are 33720.26 Gg CO2 / year which is 8.8% of M.0.EL emissions. 2023 Emissions have changed by -1.9% (-654.22 Gg CO2 / year). 1990-2023 Emissions have changed by -0.1% (-19.24 Gg CO2 / year).
- 4: Total sectoral emissions in 2022 are 3834.52 Gg
CO2 / year which is 1.0% of M.0.EL emissions. 2023 Emissions have
changed by 7.0% (251.56 Gg CO2 /
year). 1990-2023 Emissions have changed by 0.1% (7.40 Gg CO2 / year). For 2023 the
changes per gas
are:
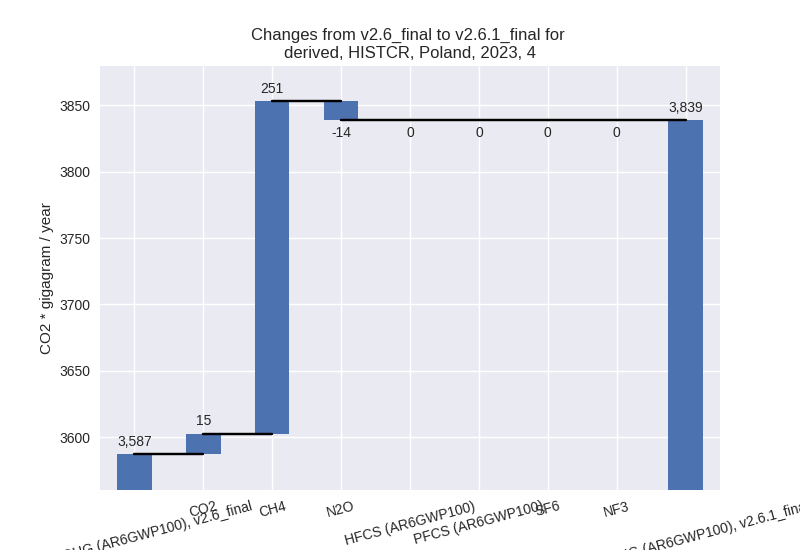
- 5: No data
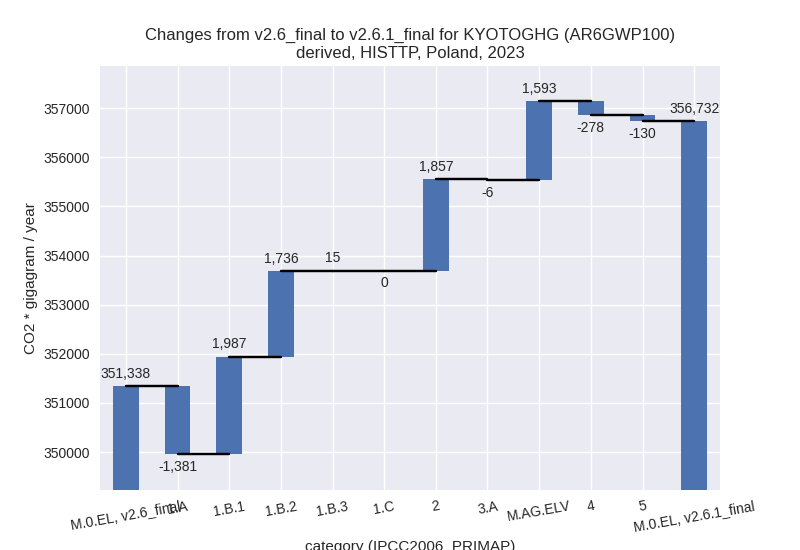
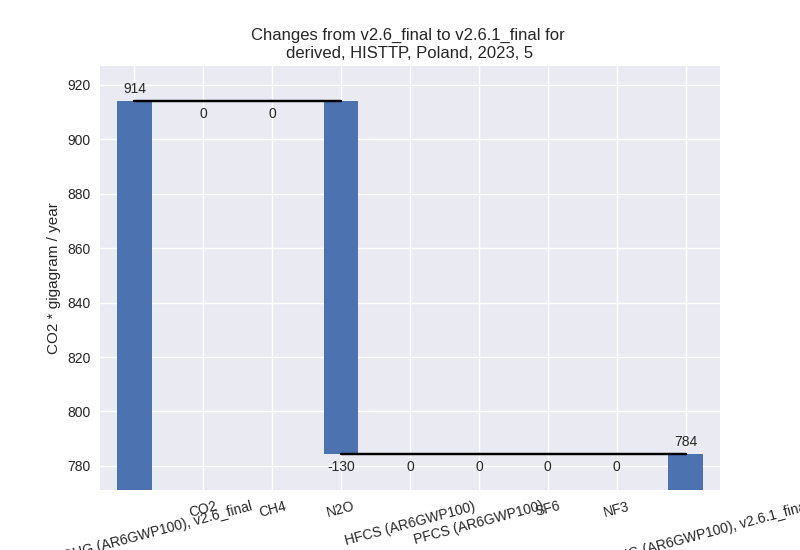
third party scenario (HISTTP):
Most important changes per time frame
For 2023 the following sector-gas combinations have the highest absolute impact on national total KyotoGHG (AR6GWP100) emissions in 2023 (top 5):
- 1: 2, HFCS (AR6GWP100) with 3221.93 Gg CO2 / year (136.0%)
- 2: 1.B.1, CO2 with 2465.93 Gg CO2 / year (101.4%)
- 3: 1.B.2, CH4 with 1736.32 Gg CO2 / year (69.3%)
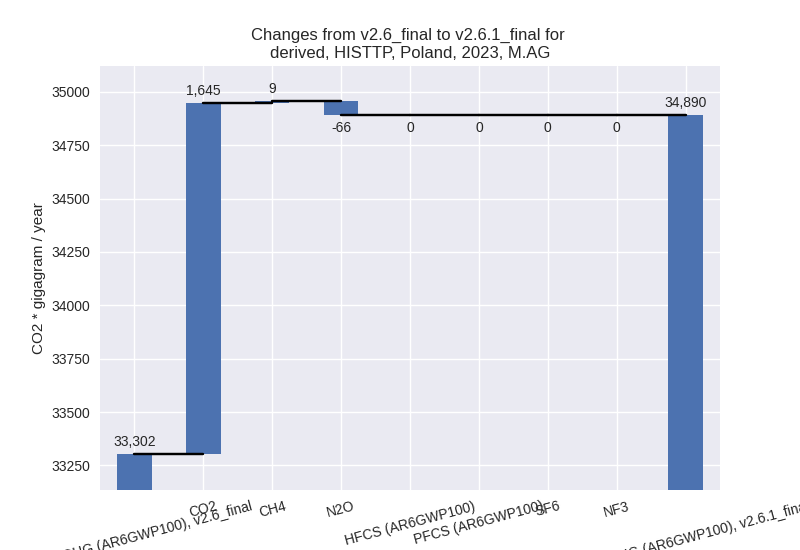
- 4: M.AG.ELV, CO2 with 1645.28 Gg CO2 / year (21904.5%)
- 5: 1.A, CH4 with -1572.68 Gg CO2 / year (-28.4%)
For 1990-2023 the following sector-gas combinations have the highest absolute impact on national total KyotoGHG (AR6GWP100) emissions in 1990-2023 (top 5):
- 1: M.AG.ELV, CO2 with 1708.65 Gg CO2 / year (3338.8%)
- 2: 1.A, CH4 with -1349.66 Gg CO2 / year (-23.9%)
- 3: 1.A, N2O with 782.75 Gg CO2 / year (25.1%)
- 4: 1.B.2, CH4 with 676.53 Gg CO2 / year (26.3%)
- 5: 1.B.1, CH4 with 487.60 Gg CO2 / year (1.8%)
Changes in the main sectors for aggregate KyotoGHG (AR6GWP100) are
- 1: Total sectoral emissions in 2022 are 313101.14 Gg CO2 / year which is 81.5% of M.0.EL emissions. 2023 Emissions have changed by 0.8% (2356.39 Gg CO2 / year). 1990-2023 Emissions have changed by 0.3% (1040.79 Gg CO2 / year).
- 2: Total sectoral emissions in 2022 are 25049.65 Gg
CO2 / year which is 6.5% of M.0.EL emissions. 2023 Emissions have
changed by 8.8% (1857.42 Gg CO2 /
year). 1990-2023 Emissions have changed by 1.7% (338.10 Gg CO2 / year). For 2023 the
changes per gas
are:
- M.AG: Total sectoral emissions in 2022 are 35098.12
Gg CO2 / year which is 9.1% of M.0.EL emissions. 2023 Emissions have
changed by 4.8% (1587.53 Gg CO2 /
year). 1990-2023 Emissions have changed by 4.8% (1709.64 Gg CO2 / year). For 2023 the
changes per gas
are:
For 1990-2023 the changes per gas are: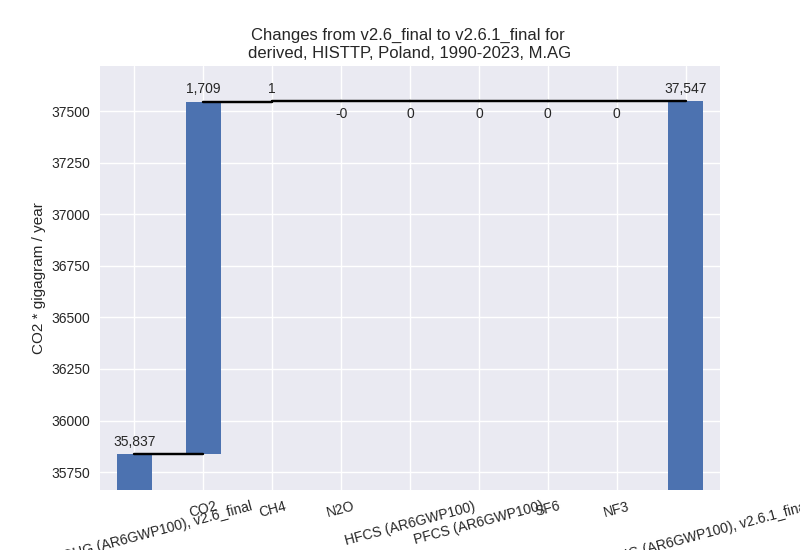
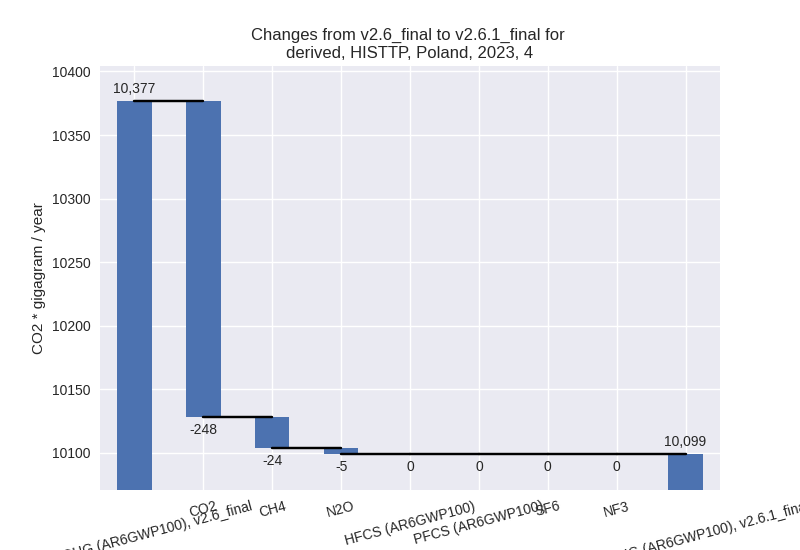
The changes come from the following subsectors:- 3.A: Total sectoral emissions in 2022 are 17640.94 Gg CO2 / year which is 50.3% of category M.AG emissions. 2023 Emissions have changed by -0.0% (-5.66 Gg CO2 / year). 1990-2023 Emissions have changed by 0.0% (0.76 Gg CO2 / year).
- M.AG.ELV: Total sectoral emissions in 2022 are
17457.18 Gg CO2 / year which is 49.7% of category M.AG emissions. 2023
Emissions have changed by 10.2%
(1593.19 Gg CO2 / year). 1990-2023 Emissions have changed by 10.7% (1708.88 Gg CO2 / year). For 2023
the changes per gas
are:
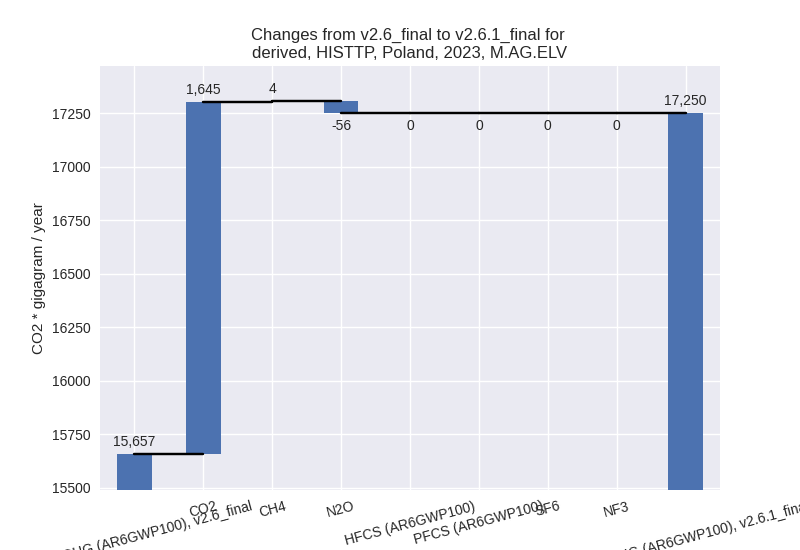
For 1990-2023 the changes per gas are:
There is no subsector information available in PRIMAP-hist.
- 4: Total sectoral emissions in 2022 are 10089.16 Gg
CO2 / year which is 2.6% of M.0.EL emissions. 2023 Emissions have
changed by -2.7% (-277.61 Gg CO2 /
year). 1990-2023 Emissions have changed by -0.8% (-108.28 Gg CO2 / year). For 2023
the changes per gas
are:
- 5: Total sectoral emissions in 2022 are 865.66 Gg
CO2 / year which is 0.2% of M.0.EL emissions. 2023 Emissions have
changed by -14.2% (-129.68 Gg CO2 /
year). 1990-2023 Emissions have changed by -4.2% (-47.65 Gg CO2 / year). For 2023 the
changes per gas
are:
For 1990-2023 the changes per gas are: