Changes in PRIMAP-hist v2.6.1_final compared to v2.6_final for Korea, Democratic People’s Republic of
2025-03-19
Johannes Gütschow
Change analysis for Korea, Democratic People’s Republic of for PRIMAP-hist v2.6.1_final compared to v2.6_final
Overview over emissions by sector and gas
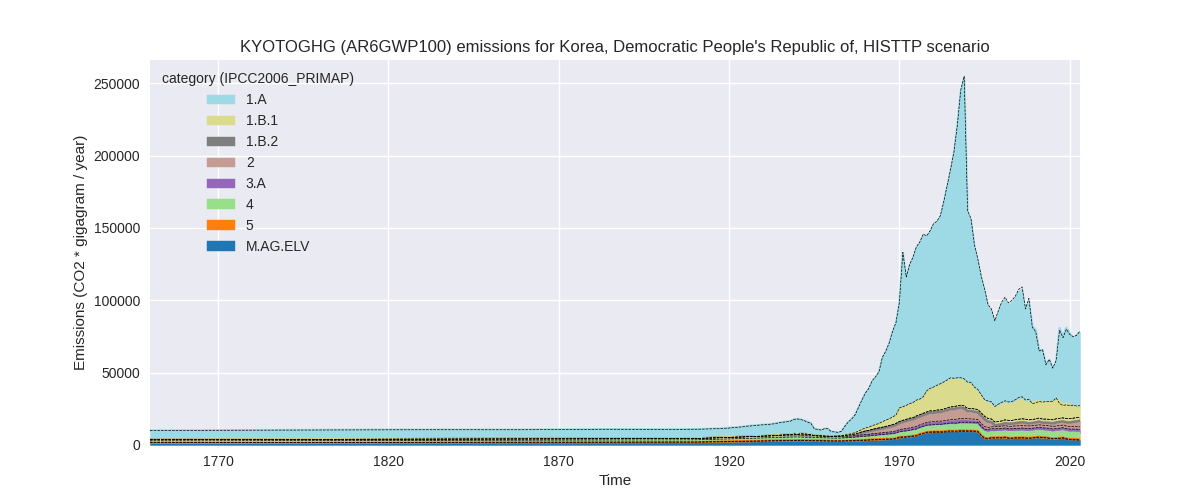
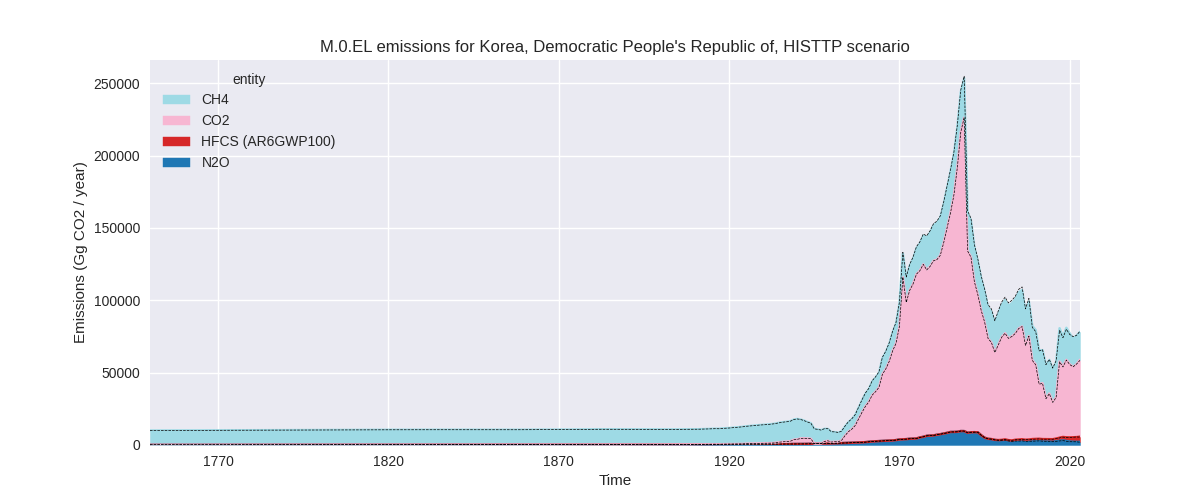
The following figures show the aggregate national total emissions excluding LULUCF AR6GWP100 for the country reported priority scenario. The dotted linesshow the v2.6_final data.
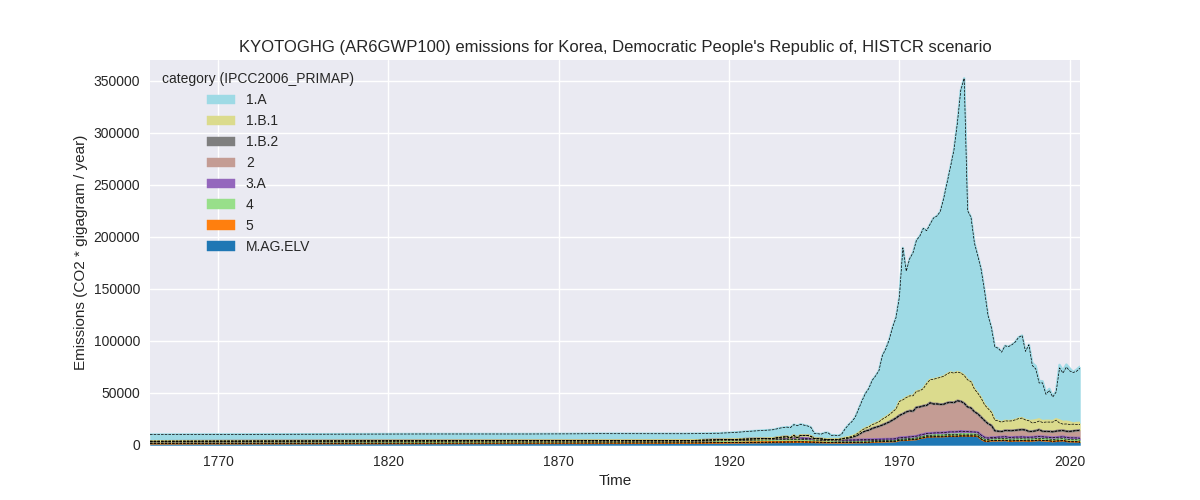
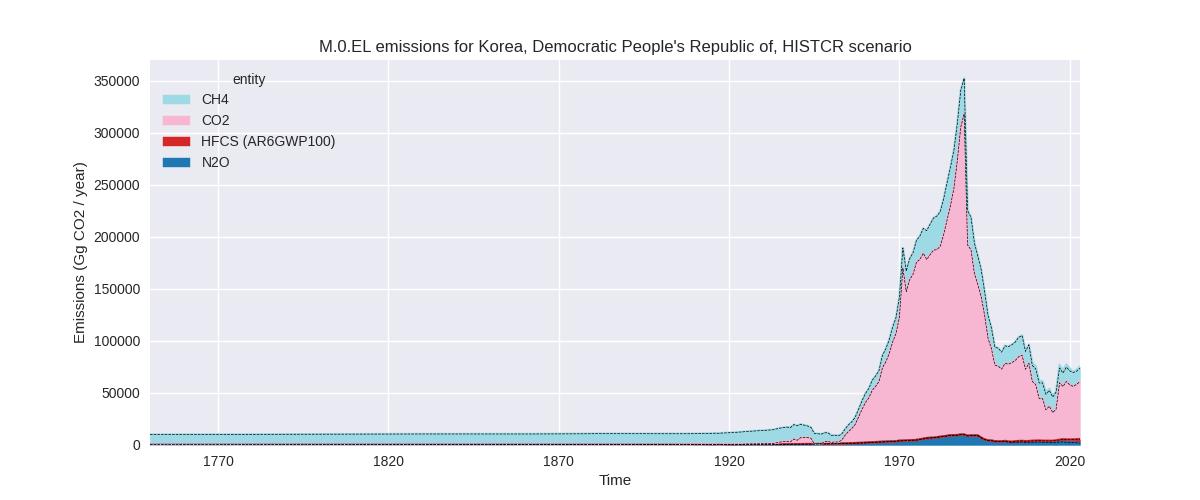
The following figures show the aggregate national total emissions excluding LULUCF AR6GWP100 for the third party priority scenario. The dotted linesshow the v2.6_final data.
Overview over changes
In the country reported priority scenario we have the following changes for aggregate Kyoto GHG and national total emissions excluding LULUCF (M.0.EL):
- Emissions in 2023 have changed by 1.9%% (1396.51 Gg CO2 / year)
- Emissions in 1990-2023 have changed by 0.8%% (764.43 Gg CO2 / year)
In the third party priority scenario we have the following changes for aggregate Kyoto GHG and national total emissions excluding LULUCF (M.0.EL):
- Emissions in 2023 have changed by -0.7%% (-546.91 Gg CO2 / year)
- Emissions in 1990-2023 have changed by -1.1%% (-1045.71 Gg CO2 / year)
Most important changes per scenario and time frame
In the country reported priority scenario the following sector-gas combinations have the highest absolute impact on national total KyotoGHG (AR6GWP100) emissions in 2023 (top 5):
- 1: 1.B.1, CH4 with 959.54 Gg CO2 / year (16.4%)
- 2: M.AG.ELV, N2O with 262.77 Gg CO2 / year (33.3%)
- 3: M.AG.ELV, CH4 with 109.73 Gg CO2 / year (6.2%)
- 4: 5, N2O with 35.33 Gg CO2 / year (9.4%)
- 5: 1.A, N2O with 29.43 Gg CO2 / year (13.5%)
In the country reported priority scenario the following sector-gas combinations have the highest absolute impact on national total KyotoGHG (AR6GWP100) emissions in 1990-2023 (top 5):
- 1: 1.B.1, CH4 with 673.03 Gg CO2 / year (6.4%)
- 2: 1.A, CH4 with 50.59 Gg CO2 / year (1.9%)
- 3: 2, CO2 with -23.05 Gg CO2 / year (-0.3%)
- 4: 1.B.1, CO2 with 20.32 Gg CO2 / year (3.5%)
- 5: 5, N2O with 16.73 Gg CO2 / year (5.0%)
In the third party priority scenario the following sector-gas combinations have the highest absolute impact on national total KyotoGHG (AR6GWP100) emissions in 2023 (top 5):
- 1: 4, CH4 with -2638.77 Gg CO2 / year (-38.4%)
- 2: 1.B.1, CH4 with 1526.70 Gg CO2 / year (18.9%)
- 3: M.AG.ELV, N2O with 262.77 Gg CO2 / year (33.3%)
- 4: M.AG.ELV, CH4 with 147.39 Gg CO2 / year (6.2%)
- 5: 2, CO2 with 83.12 Gg CO2 / year (2.9%)
In the third party priority scenario the following sector-gas combinations have the highest absolute impact on national total KyotoGHG (AR6GWP100) emissions in 1990-2023 (top 5):
- 1: 4, CH4 with -2333.00 Gg CO2 / year (-37.4%)
- 2: 1.B.1, CH4 with 1192.95 Gg CO2 / year (10.2%)
- 3: 1.A, CH4 with 27.56 Gg CO2 / year (2.0%)
- 4: 1.A, N2O with 20.36 Gg CO2 / year (6.7%)
- 5: 1.B.1, CO2 with 20.32 Gg CO2 / year (3.5%)
Notes on data changes
Here we list notes explaining important emissions changes for the country.
- No new country reported data has been included. Changes in the CR time-series have a small influence on total emissions and come from updated third party data (EDGAR, FAO) which is used to extrapolate the country reported data. As the country reported data only covers 1990-2002 and some sectors are totally uncovered, the changes in EDGAR and FAO also influence cumulative emissions.
- Changes in the TP time-series come from updated EDGAR and FAO data. FAO has adjusted data for the latest years while EDGAR has updated full time-series with the main changes coming from the waste sector and fugitive CH4 (1.B.1).
Changes by sector and gas
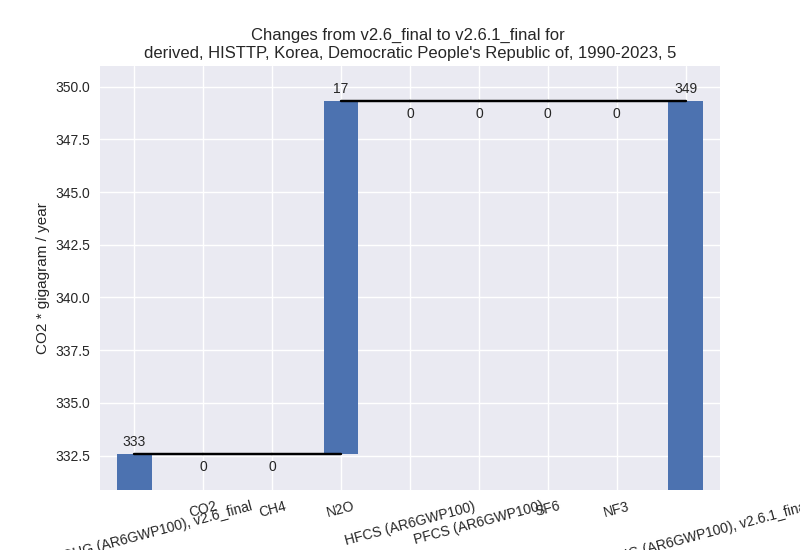
For each scenario and time frame the changes are displayed for all individual sectors and all individual gases. In the sector plot we use aggregate Kyoto GHGs in AR6GWP100. In the gas plot we usenational total emissions without LULUCF.
country reported scenario
2023
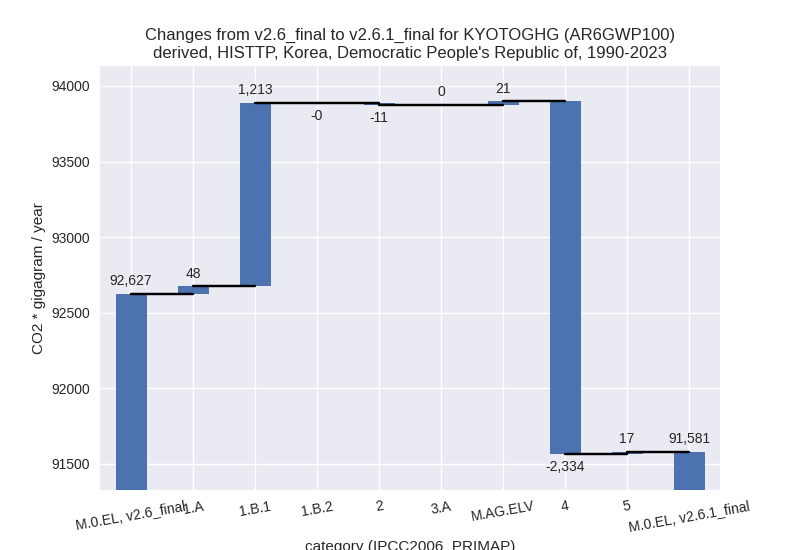
1990-2023
third party scenario
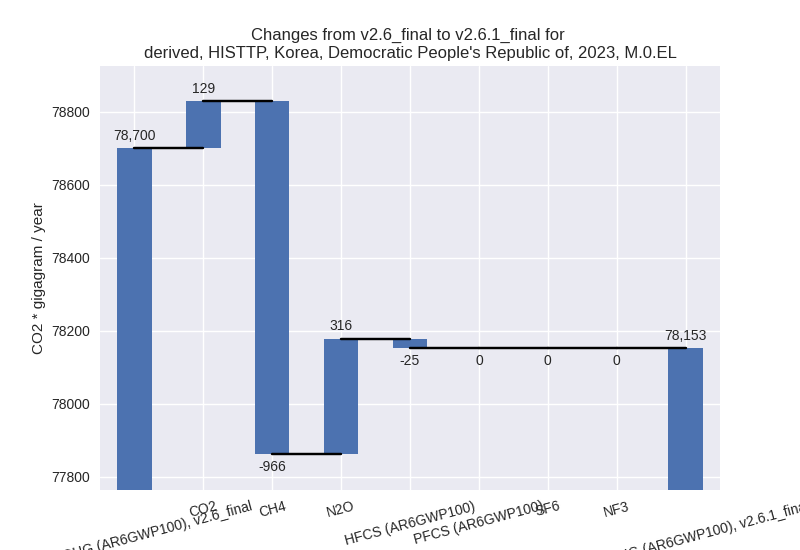
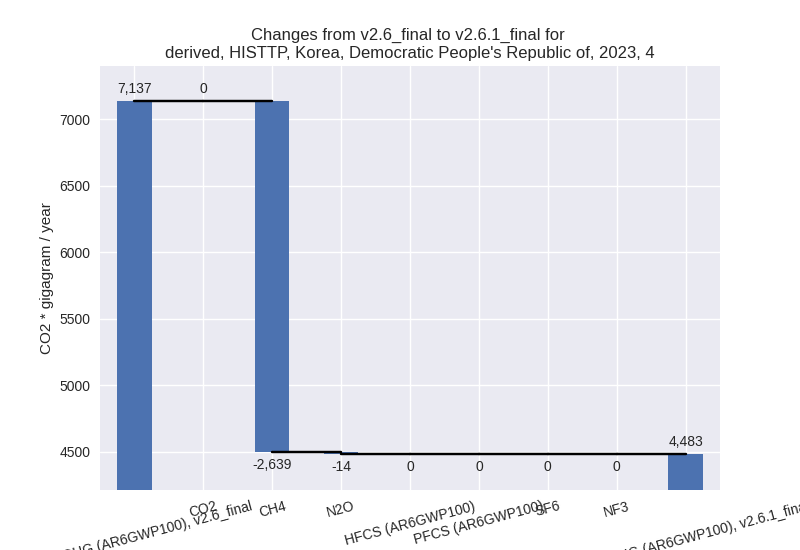
2023
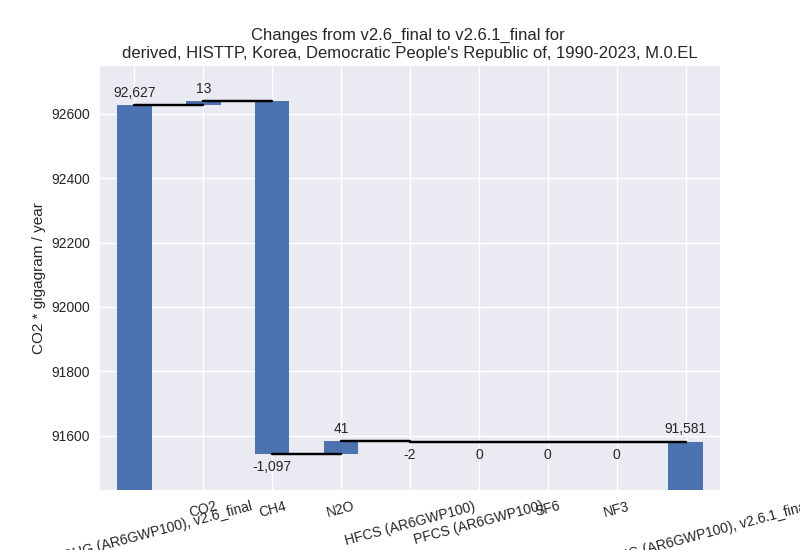
1990-2023
Detailed changes for the scenarios:
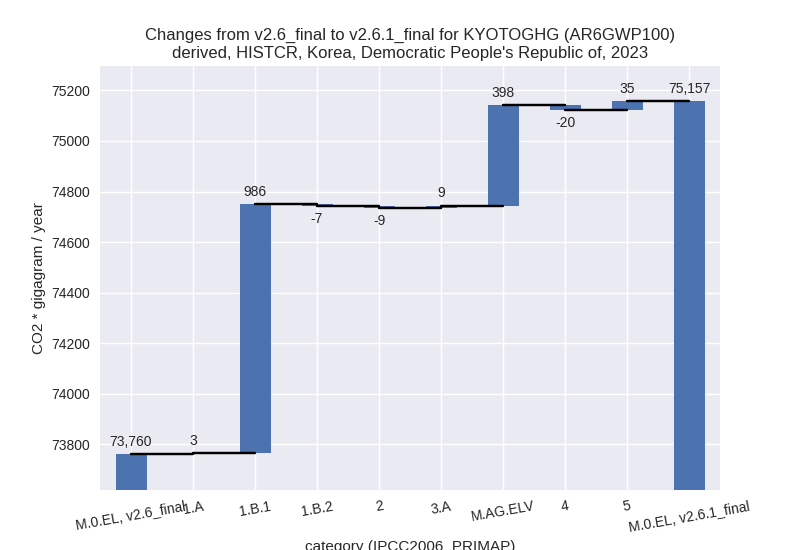
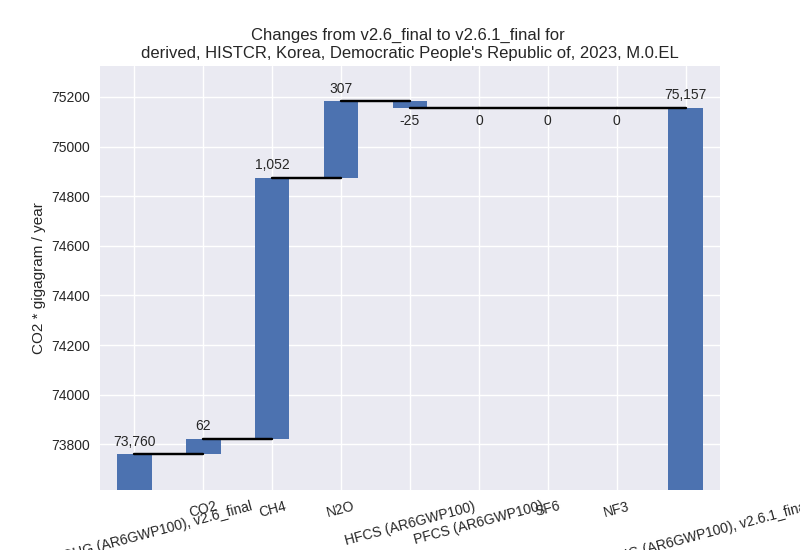
country reported scenario (HISTCR):
Most important changes per time frame
For 2023 the following sector-gas combinations have the highest absolute impact on national total KyotoGHG (AR6GWP100) emissions in 2023 (top 5):
- 1: 1.B.1, CH4 with 959.54 Gg CO2 / year (16.4%)
- 2: M.AG.ELV, N2O with 262.77 Gg CO2 / year (33.3%)
- 3: M.AG.ELV, CH4 with 109.73 Gg CO2 / year (6.2%)
- 4: 5, N2O with 35.33 Gg CO2 / year (9.4%)
- 5: 1.A, N2O with 29.43 Gg CO2 / year (13.5%)
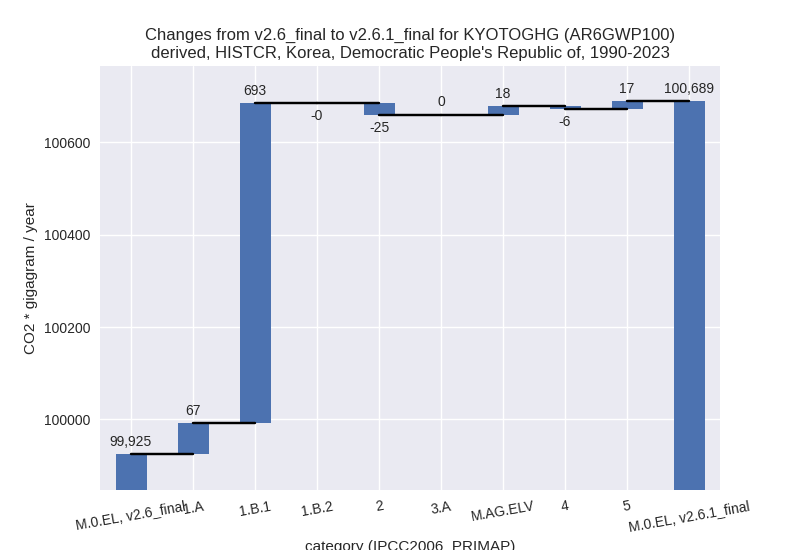
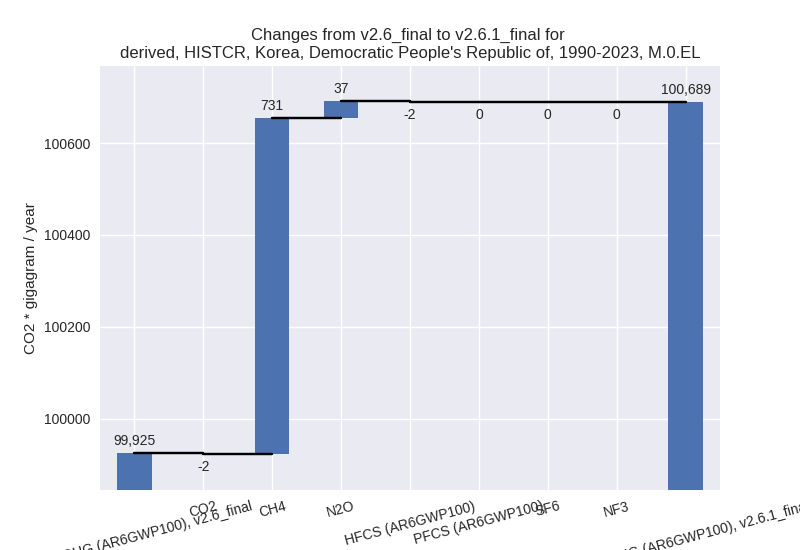
For 1990-2023 the following sector-gas combinations have the highest absolute impact on national total KyotoGHG (AR6GWP100) emissions in 1990-2023 (top 5):
- 1: 1.B.1, CH4 with 673.03 Gg CO2 / year (6.4%)
- 2: 1.A, CH4 with 50.59 Gg CO2 / year (1.9%)
- 3: 2, CO2 with -23.05 Gg CO2 / year (-0.3%)
- 4: 1.B.1, CO2 with 20.32 Gg CO2 / year (3.5%)
- 5: 5, N2O with 16.73 Gg CO2 / year (5.0%)
Changes in the main sectors for aggregate KyotoGHG (AR6GWP100) are
- 1: Total sectoral emissions in 2022 are 58515.31 Gg CO2 / year which is 81.0% of M.0.EL emissions. 2023 Emissions have changed by 1.6% (983.26 Gg CO2 / year). 1990-2023 Emissions have changed by 0.9% (760.02 Gg CO2 / year).
- 2: Total sectoral emissions in 2022 are 6923.32 Gg CO2 / year which is 9.6% of M.0.EL emissions. 2023 Emissions have changed by -0.1% (-8.73 Gg CO2 / year). 1990-2023 Emissions have changed by -0.3% (-24.85 Gg CO2 / year).
- M.AG: Total sectoral emissions in 2022 are 4772.48
Gg CO2 / year which is 6.6% of M.0.EL emissions. 2023 Emissions have
changed by 9.3% (406.64 Gg CO2 /
year). 1990-2023 Emissions have changed by 0.3% (18.09 Gg CO2 / year). For 2023 the
changes per gas
are:

The changes come from the following subsectors:- 3.A: Total sectoral emissions in 2022 are 1822.55 Gg CO2 / year which is 38.2% of category M.AG emissions. 2023 Emissions have changed by 0.5% (8.73 Gg CO2 / year). 1990-2023 Emissions have changed by 0.0% (0.34 Gg CO2 / year).
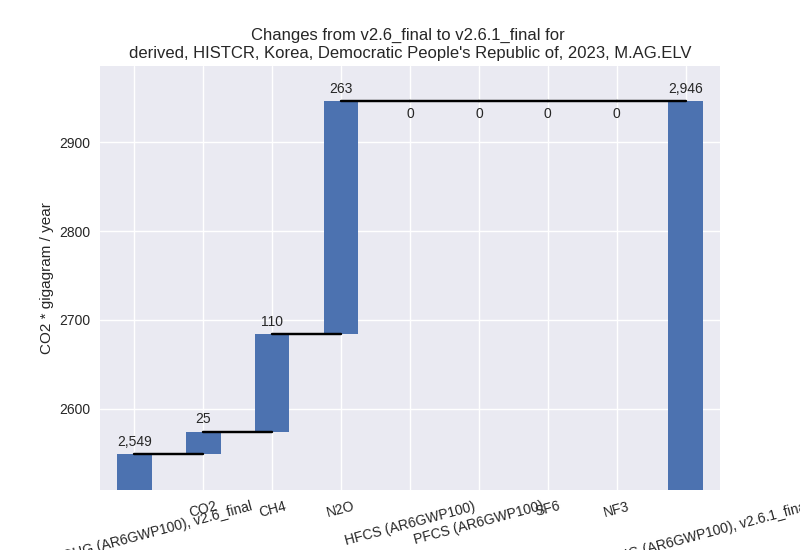
- M.AG.ELV: Total sectoral emissions in 2022 are
2949.93 Gg CO2 / year which is 61.8% of category M.AG emissions. 2023
Emissions have changed by 15.6%
(397.91 Gg CO2 / year). 1990-2023 Emissions have changed by 0.4% (17.75 Gg CO2 / year). For 2023 the
changes per gas
are:
There is no subsector information available in PRIMAP-hist.
- 4: Total sectoral emissions in 2022 are 1663.25 Gg CO2 / year which is 2.3% of M.0.EL emissions. 2023 Emissions have changed by -1.2% (-19.99 Gg CO2 / year). 1990-2023 Emissions have changed by -0.4% (-5.56 Gg CO2 / year).
- 5: Total sectoral emissions in 2022 are 381.44 Gg
CO2 / year which is 0.5% of M.0.EL emissions. 2023 Emissions have
changed by 9.4% (35.33 Gg CO2 /
year). 1990-2023 Emissions have changed by 5.0% (16.73 Gg CO2 / year). For 2023 the
changes per gas
are:

For 1990-2023 the changes per gas are: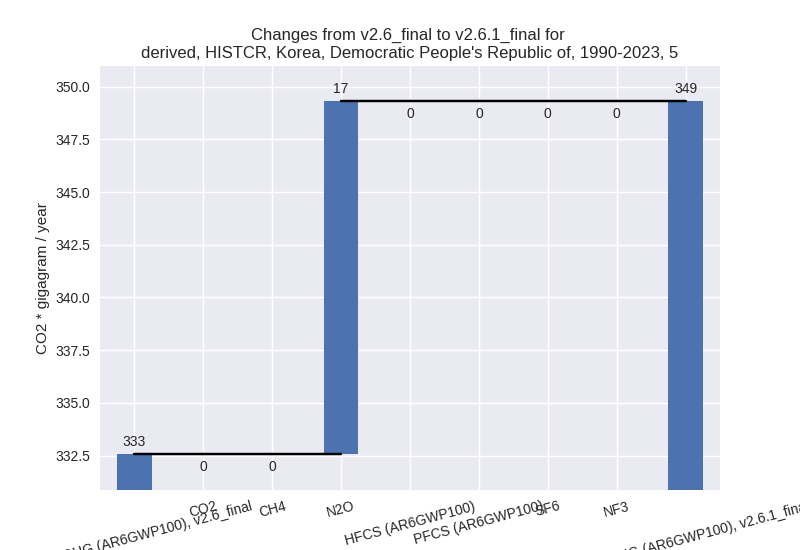
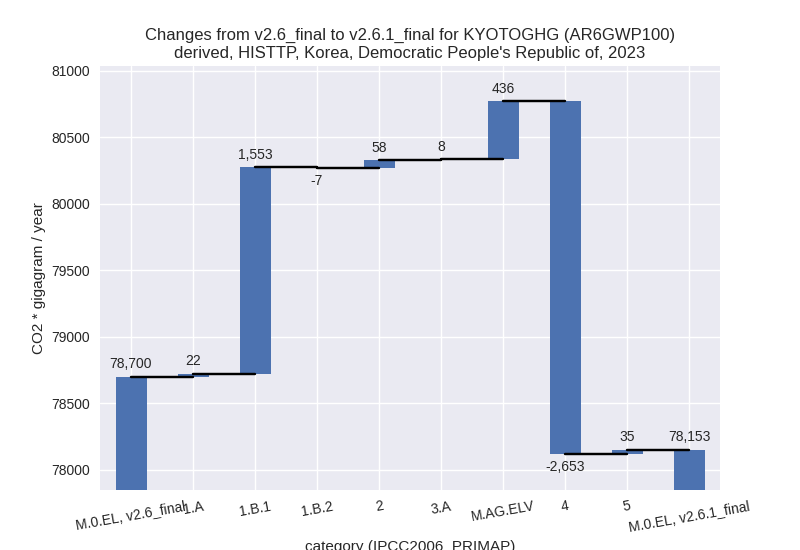
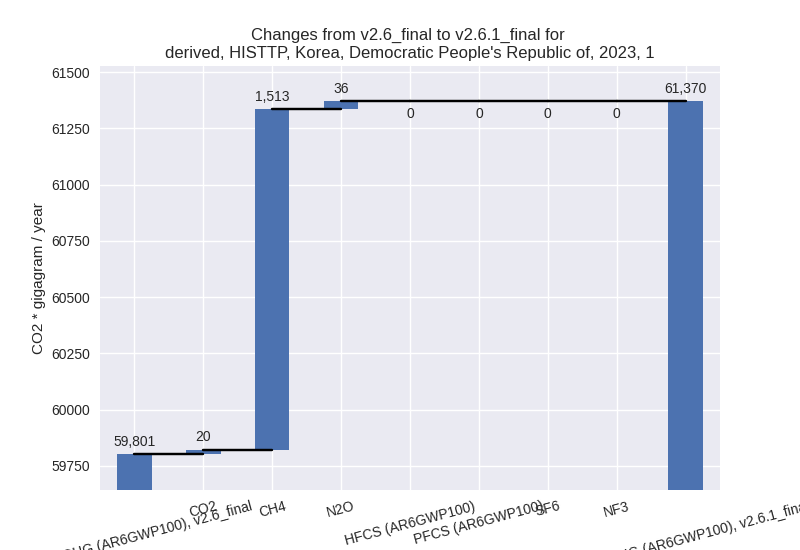
third party scenario (HISTTP):
Most important changes per time frame
For 2023 the following sector-gas combinations have the highest absolute impact on national total KyotoGHG (AR6GWP100) emissions in 2023 (top 5):
- 1: 4, CH4 with -2638.77 Gg CO2 / year (-38.4%)
- 2: 1.B.1, CH4 with 1526.70 Gg CO2 / year (18.9%)
- 3: M.AG.ELV, N2O with 262.77 Gg CO2 / year (33.3%)
- 4: M.AG.ELV, CH4 with 147.39 Gg CO2 / year (6.2%)
- 5: 2, CO2 with 83.12 Gg CO2 / year (2.9%)
For 1990-2023 the following sector-gas combinations have the highest absolute impact on national total KyotoGHG (AR6GWP100) emissions in 1990-2023 (top 5):
- 1: 4, CH4 with -2333.00 Gg CO2 / year (-37.4%)
- 2: 1.B.1, CH4 with 1192.95 Gg CO2 / year (10.2%)
- 3: 1.A, CH4 with 27.56 Gg CO2 / year (2.0%)
- 4: 1.A, N2O with 20.36 Gg CO2 / year (6.7%)
- 5: 1.B.1, CO2 with 20.32 Gg CO2 / year (3.5%)
Changes in the main sectors for aggregate KyotoGHG (AR6GWP100) are
- 1: Total sectoral emissions in 2022 are 59296.59 Gg
CO2 / year which is 78.4% of M.0.EL emissions. 2023 Emissions have
changed by 2.6% (1569.10 Gg CO2 /
year). 1990-2023 Emissions have changed by 1.7% (1260.71 Gg CO2 / year). For 2023 the
changes per gas
are:
The changes come from the following subsectors:- 1.A: Total sectoral emissions in 2022 are 48802.71 Gg CO2 / year which is 82.3% of category 1 emissions. 2023 Emissions have changed by 0.0% (22.15 Gg CO2 / year). 1990-2023 Emissions have changed by 0.1% (47.93 Gg CO2 / year).
- 1.B.1: Total sectoral emissions in 2022 are
10489.54 Gg CO2 / year which is 17.7% of category 1 emissions. 2023
Emissions have changed by 18.8%
(1553.50 Gg CO2 / year). 1990-2023 Emissions have changed by 9.8% (1213.27 Gg CO2 / year). For 2023 the
changes per gas
are:
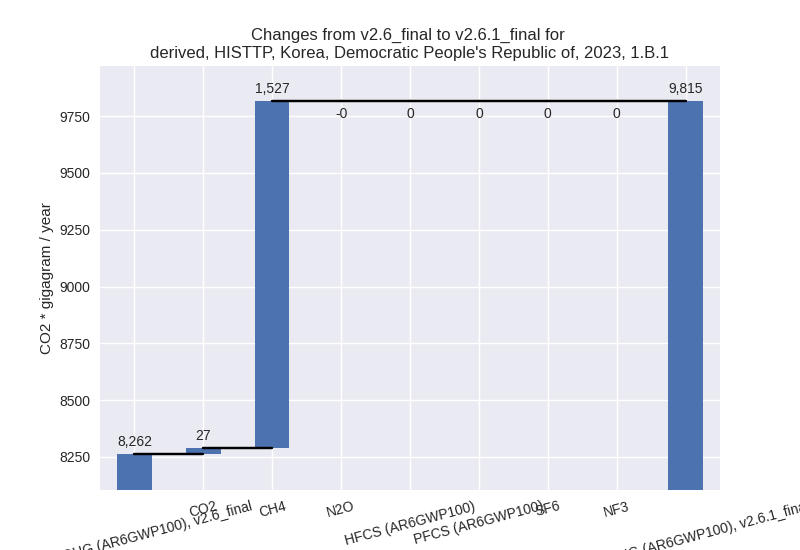
For 1990-2023 the changes per gas are: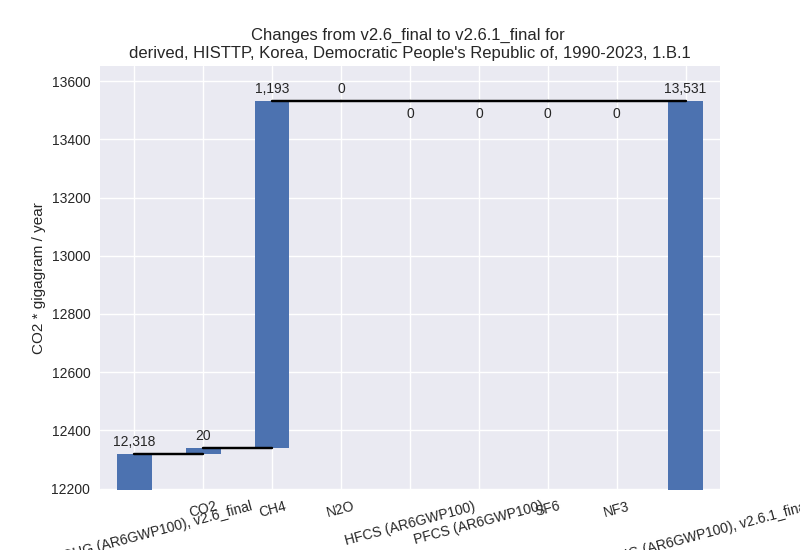
There is no subsector information available in PRIMAP-hist. - 1.B.2: Total sectoral emissions in 2022 are 4.33 Gg
CO2 / year which is 0.0% of category 1 emissions. 2023 Emissions have
changed by -63.2% (-6.55 Gg CO2 /
year). 1990-2023 Emissions have changed by -8.4% (-0.49 Gg CO2 / year). For 2023 the
changes per gas
are:
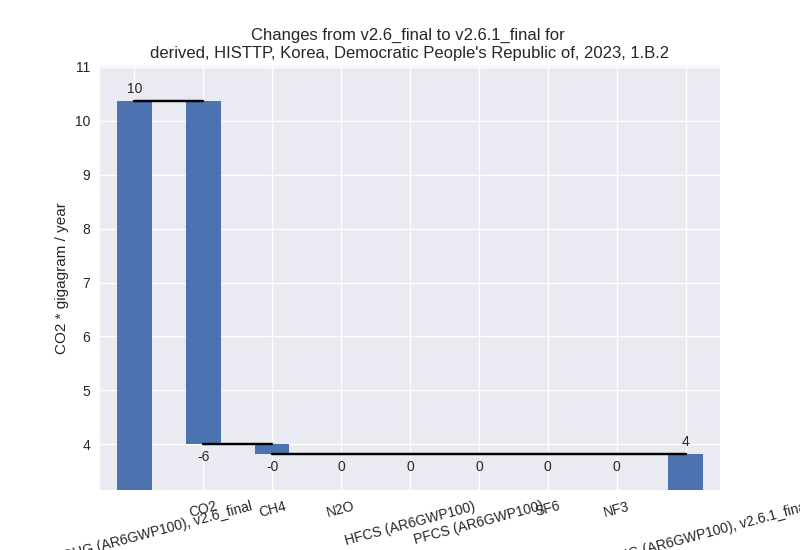
For 1990-2023 the changes per gas are: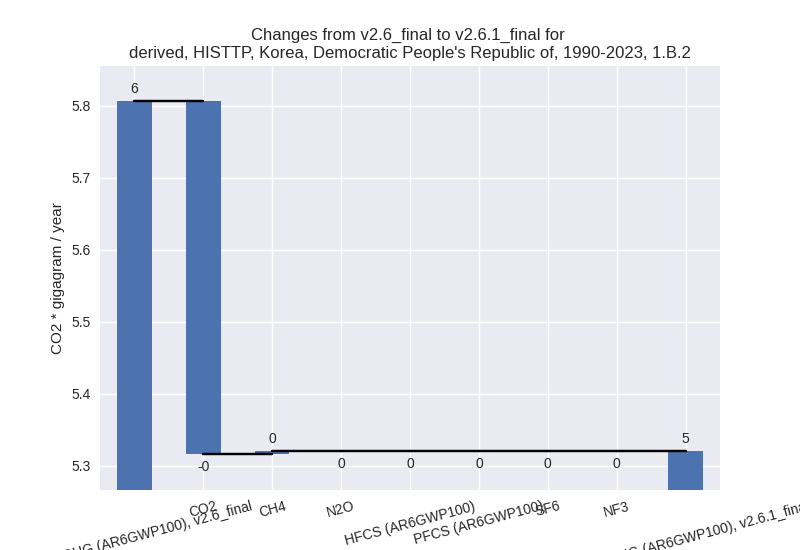
There is no subsector information available in PRIMAP-hist.
- 2: Total sectoral emissions in 2022 are 6079.15 Gg CO2 / year which is 8.0% of M.0.EL emissions. 2023 Emissions have changed by 0.9% (57.82 Gg CO2 / year). 1990-2023 Emissions have changed by -0.2% (-10.60 Gg CO2 / year).
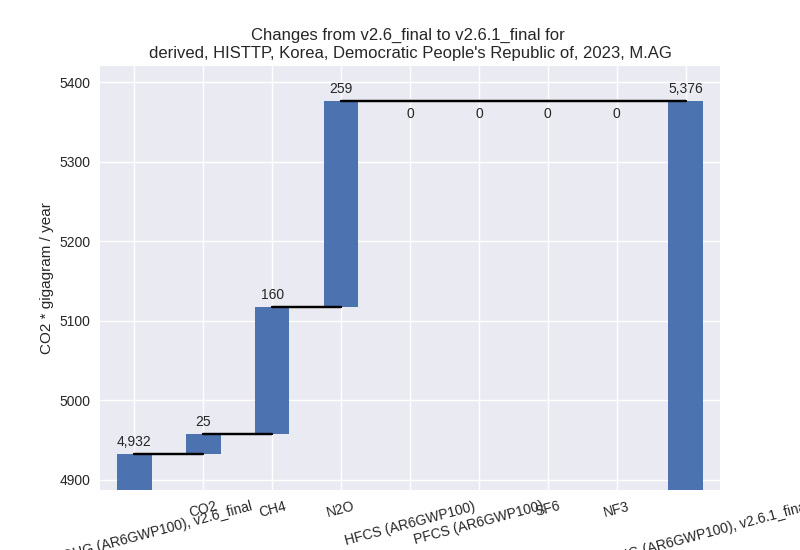
- M.AG: Total sectoral emissions in 2022 are 5378.18
Gg CO2 / year which is 7.1% of M.0.EL emissions. 2023 Emissions have
changed by 9.0% (444.03 Gg CO2 /
year). 1990-2023 Emissions have changed by 0.3% (21.81 Gg CO2 / year). For 2023 the
changes per gas
are:
The changes come from the following subsectors:- 3.A: Total sectoral emissions in 2022 are 1788.56 Gg CO2 / year which is 33.3% of category M.AG emissions. 2023 Emissions have changed by 0.5% (8.47 Gg CO2 / year). 1990-2023 Emissions have changed by 0.0% (0.32 Gg CO2 / year).
- M.AG.ELV: Total sectoral emissions in 2022 are
3589.62 Gg CO2 / year which is 66.7% of category M.AG emissions. 2023
Emissions have changed by 13.8%
(435.57 Gg CO2 / year). 1990-2023 Emissions have changed by 0.4% (21.49 Gg CO2 / year). For 2023 the
changes per gas
are:
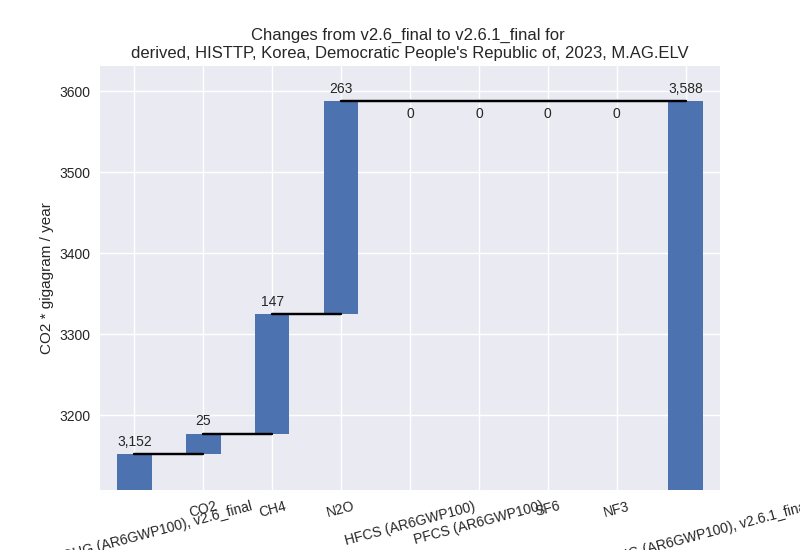
There is no subsector information available in PRIMAP-hist.
- 4: Total sectoral emissions in 2022 are 4455.81 Gg
CO2 / year which is 5.9% of M.0.EL emissions. 2023 Emissions have
changed by -37.2% (-2653.20 Gg CO2 /
year). 1990-2023 Emissions have changed by -36.0% (-2334.37 Gg CO2 / year). For 2023
the changes per gas
are:
For 1990-2023 the changes per gas are:
- 5: Total sectoral emissions in 2022 are 381.44 Gg
CO2 / year which is 0.5% of M.0.EL emissions. 2023 Emissions have
changed by 9.4% (35.33 Gg CO2 /
year). 1990-2023 Emissions have changed by 5.0% (16.73 Gg CO2 / year). For 2023 the
changes per gas
are:

For 1990-2023 the changes per gas are: