Changes in PRIMAP-hist v2.6.1_final compared to v2.6_final for Portugal
2025-03-19
Johannes Gütschow
Change analysis for Portugal for PRIMAP-hist v2.6.1_final compared to v2.6_final
Overview over emissions by sector and gas
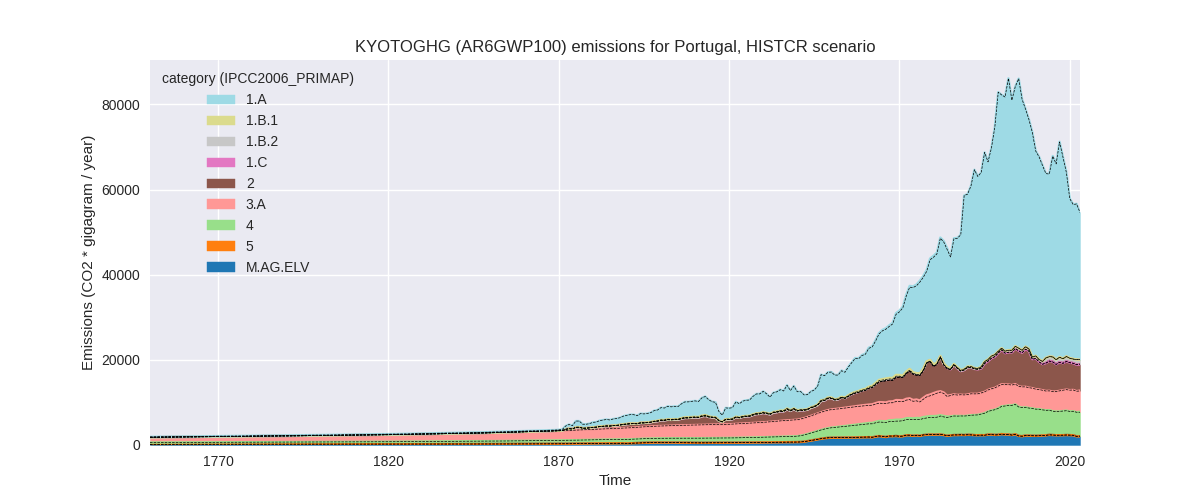
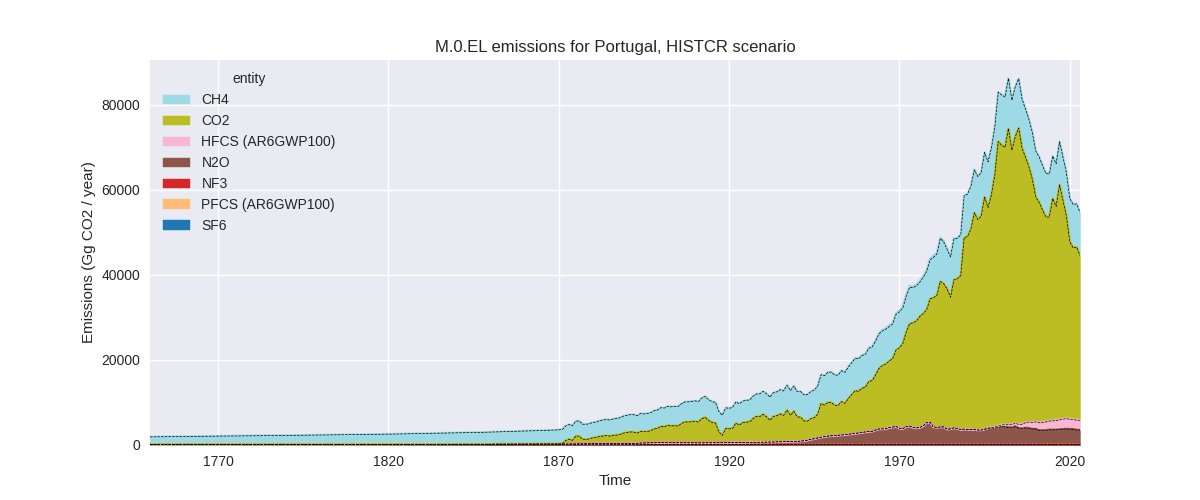
The following figures show the aggregate national total emissions excluding LULUCF AR6GWP100 for the country reported priority scenario. The dotted linesshow the v2.6_final data.
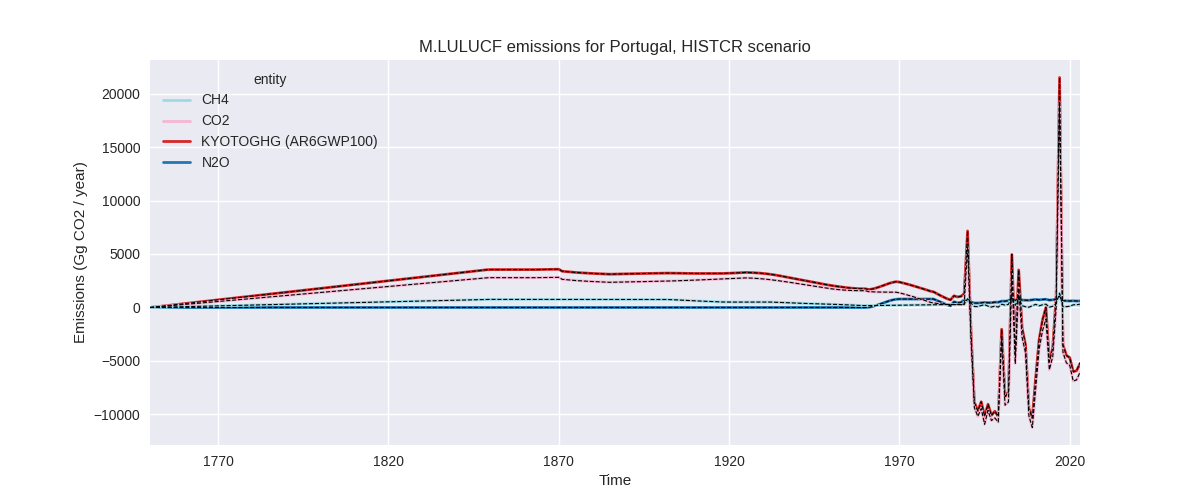
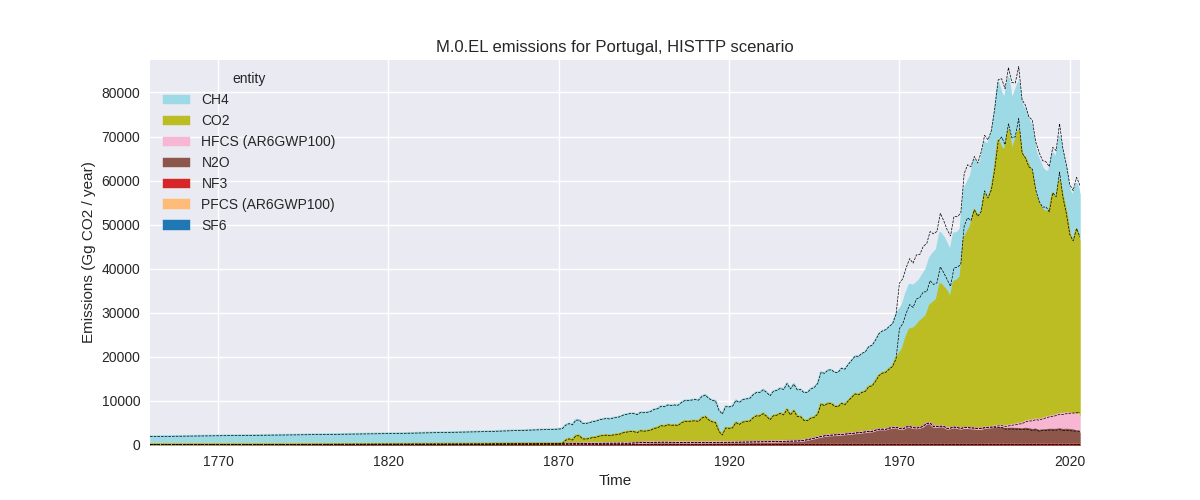
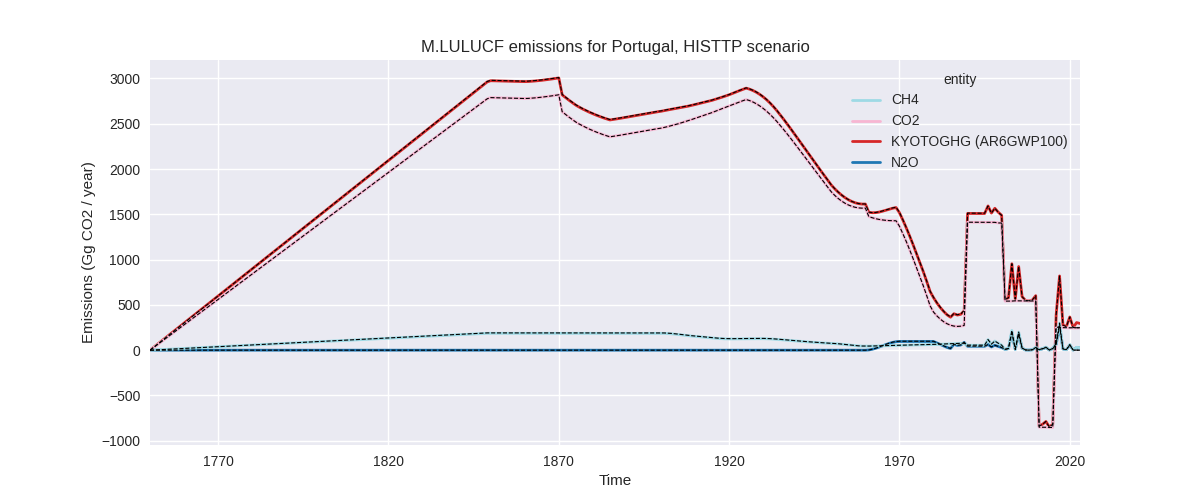
The following figures show the aggregate national total emissions excluding LULUCF AR6GWP100 for the third party priority scenario. The dotted linesshow the v2.6_final data.

Overview over changes
In the country reported priority scenario we have the following changes for aggregate Kyoto GHG and national total emissions excluding LULUCF (M.0.EL):
- Emissions in 2023 have changed by -0.2%% (-90.92 Gg CO2 / year)
- Emissions in 1990-2023 have changed by 0.0%% (12.64 Gg CO2 / year)
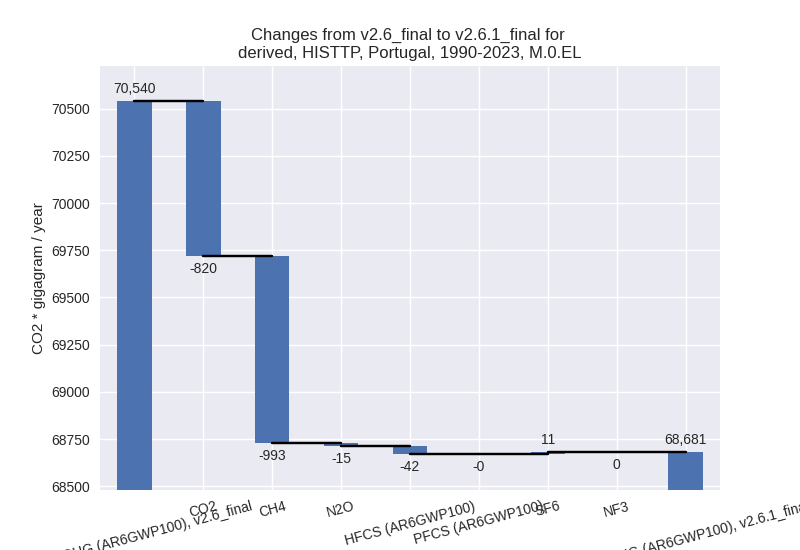
In the third party priority scenario we have the following changes for aggregate Kyoto GHG and national total emissions excluding LULUCF (M.0.EL):
- Emissions in 2023 have changed by -3.3%% (-1956.68 Gg CO2 / year)
- Emissions in 1990-2023 have changed by -2.6%% (-1858.39 Gg CO2 / year)
Most important changes per scenario and time frame
In the country reported priority scenario the following sector-gas combinations have the highest absolute impact on national total KyotoGHG (AR6GWP100) emissions in 2023 (top 5):
- 1: 2, CO2 with -236.82 Gg CO2 / year (-6.1%)
- 2: 4, CH4 with 146.13 Gg CO2 / year (3.1%)
- 3: 2, HFCS (AR6GWP100) with 77.68 Gg CO2 / year (3.4%)
- 4: M.AG.ELV, N2O with -47.74 Gg CO2 / year (-2.5%)
- 5: 3.A, CH4 with -16.71 Gg CO2 / year (-0.3%)
In the country reported priority scenario the following sector-gas combinations have the highest absolute impact on national total KyotoGHG (AR6GWP100) emissions in 1990-2023 (top 5):
- 1: 2, HFCS (AR6GWP100) with 17.83 Gg CO2 / year (1.5%)
- 2: 2, CO2 with -6.97 Gg CO2 / year (-0.1%)
- 3: 4, CH4 with 4.30 Gg CO2 / year (0.1%)
- 4: M.AG.ELV, N2O with -1.40 Gg CO2 / year (-0.1%)
- 5: 3.A, CH4 with -0.49 Gg CO2 / year (-0.0%)
In the third party priority scenario the following sector-gas combinations have the highest absolute impact on national total KyotoGHG (AR6GWP100) emissions in 2023 (top 5):
- 1: 4, CH4 with -1262.88 Gg CO2 / year (-24.2%)
- 2: 2, HFCS (AR6GWP100) with -465.22 Gg CO2 / year (-10.8%)
- 3: M.AG.ELV, CO2 with -382.20 Gg CO2 / year (-92.3%)
- 4: 1.B.2, CO2 with 226.43 Gg CO2 / year (3260741.7%)
- 5: 4, CO2 with 181.54 Gg CO2 / year (769.8%)
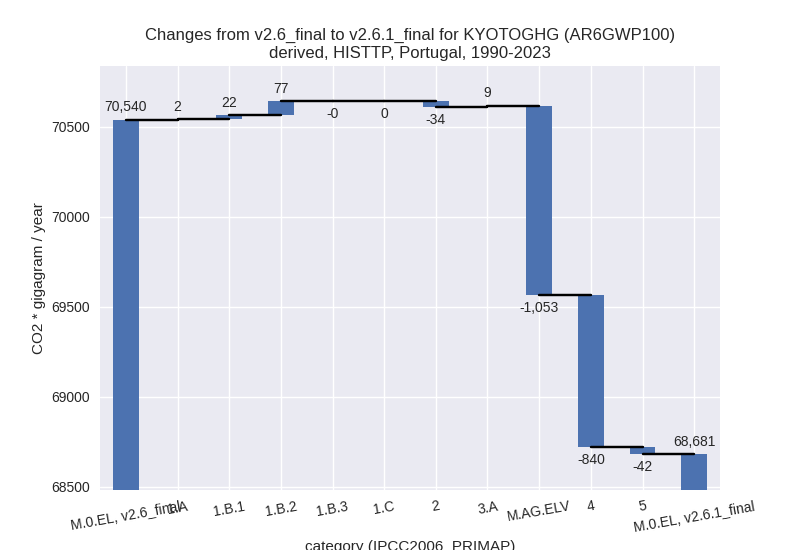
In the third party priority scenario the following sector-gas combinations have the highest absolute impact on national total KyotoGHG (AR6GWP100) emissions in 1990-2023 (top 5):
- 1: M.AG.ELV, CO2 with -1053.29 Gg CO2 / year (-94.9%)
- 2: 4, CH4 with -1042.13 Gg CO2 / year (-18.1%)
- 3: 4, CO2 with 175.24 Gg CO2 / year (1375.8%)
- 4: 1.B.2, CO2 with 60.56 Gg CO2 / year (16443.5%)
- 5: 5, N2O with -41.90 Gg CO2 / year (-14.5%)
Notes on data changes
Here we list notes explaining important emissions changes for the country.
- CRT data has been included but replaces official data reported to the EU which does not show noteworthy differences. Changes in the CR time-series are small and come from updated third party data (EDGAR, FAO) which is used to extrapolate the country reported data (e.g. for CO2 in 2.B, 2.D).
- Changes in the TP scenario come directly from EDGAR
Changes by sector and gas
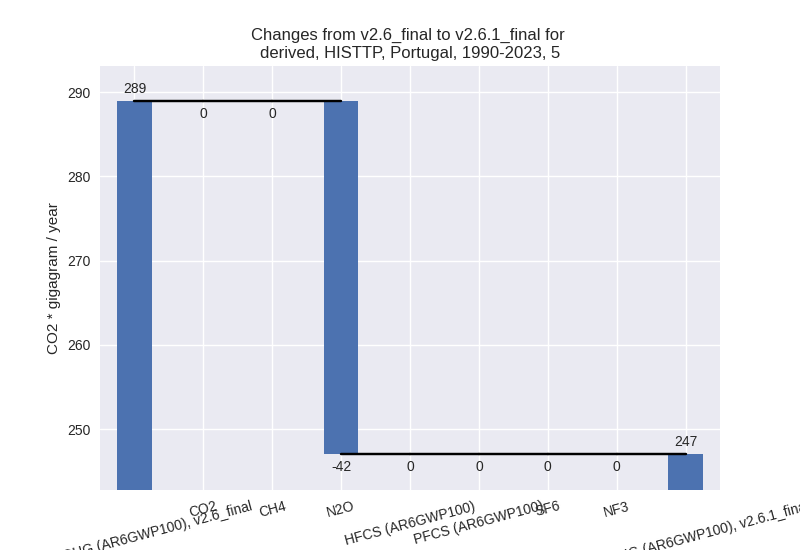
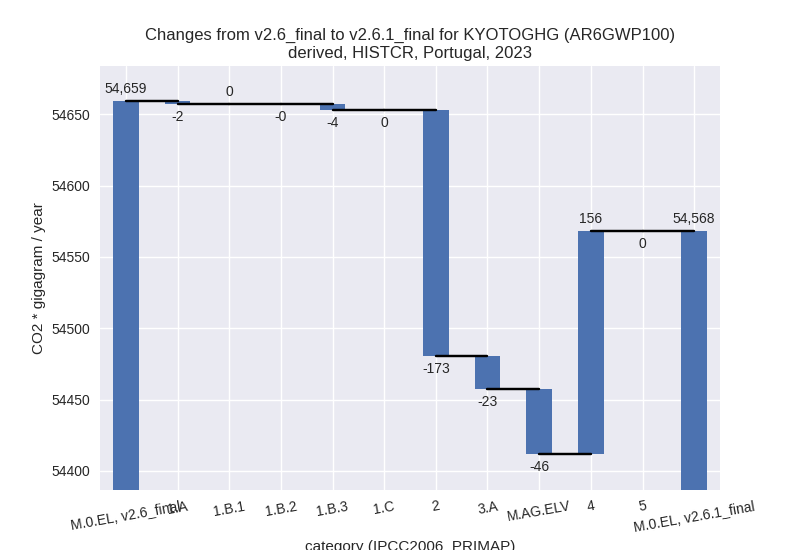
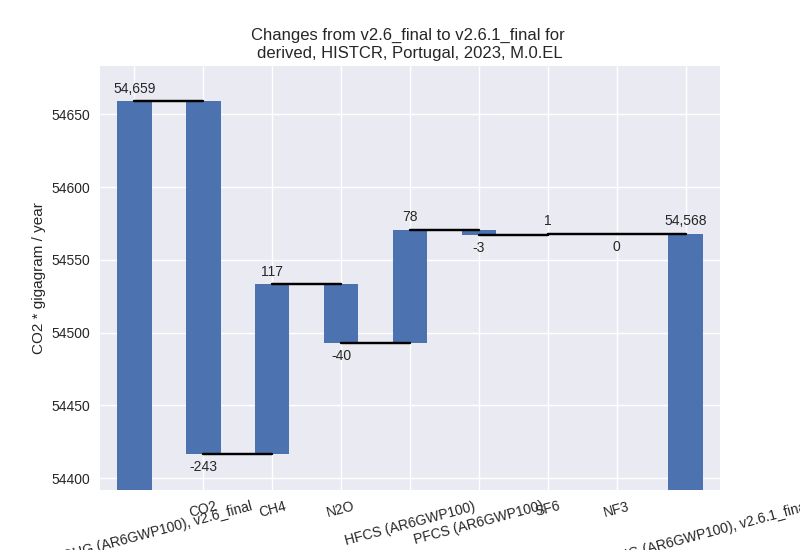
For each scenario and time frame the changes are displayed for all individual sectors and all individual gases. In the sector plot we use aggregate Kyoto GHGs in AR6GWP100. In the gas plot we usenational total emissions without LULUCF.
country reported scenario
2023
1990-2023
third party scenario
2023
1990-2023
Detailed changes for the scenarios:
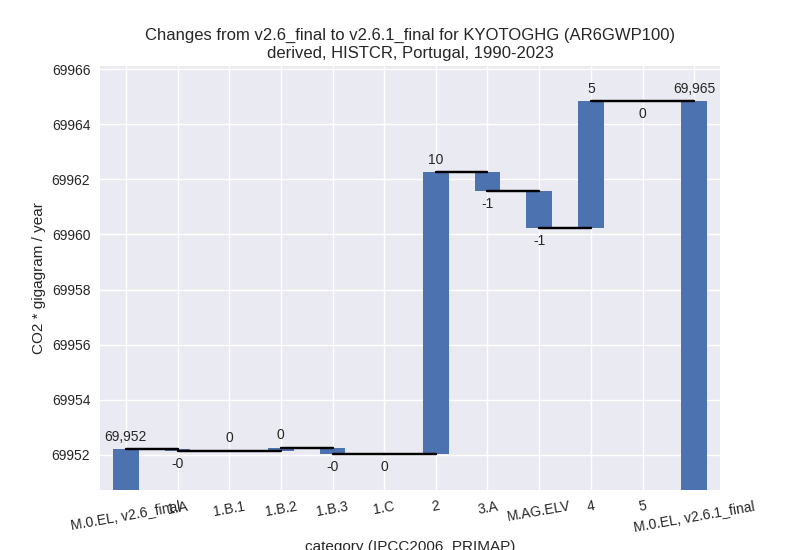
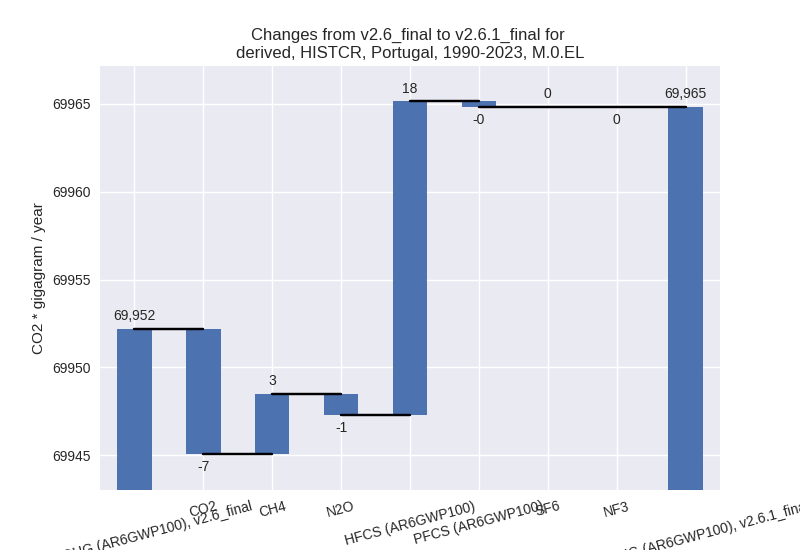
country reported scenario (HISTCR):
Most important changes per time frame
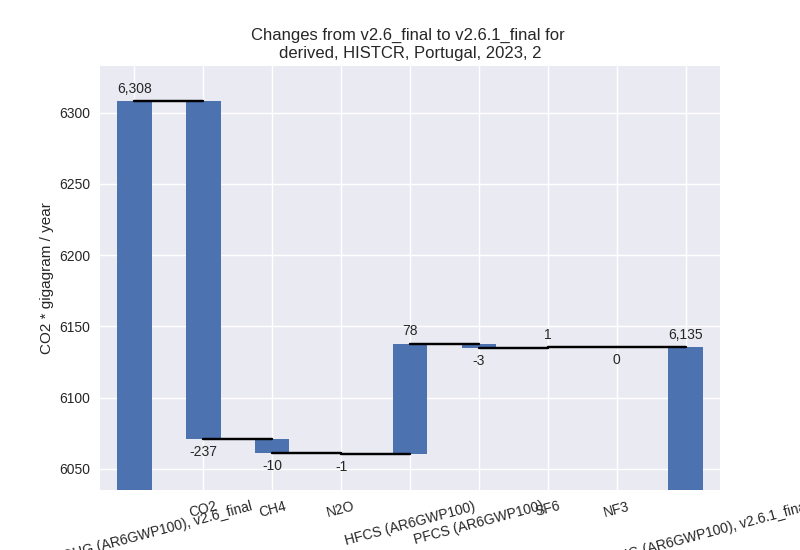
For 2023 the following sector-gas combinations have the highest absolute impact on national total KyotoGHG (AR6GWP100) emissions in 2023 (top 5):
- 1: 2, CO2 with -236.82 Gg CO2 / year (-6.1%)
- 2: 4, CH4 with 146.13 Gg CO2 / year (3.1%)
- 3: 2, HFCS (AR6GWP100) with 77.68 Gg CO2 / year (3.4%)
- 4: M.AG.ELV, N2O with -47.74 Gg CO2 / year (-2.5%)
- 5: 3.A, CH4 with -16.71 Gg CO2 / year (-0.3%)
For 1990-2023 the following sector-gas combinations have the highest absolute impact on national total KyotoGHG (AR6GWP100) emissions in 1990-2023 (top 5):
- 1: 2, HFCS (AR6GWP100) with 17.83 Gg CO2 / year (1.5%)
- 2: 2, CO2 with -6.97 Gg CO2 / year (-0.1%)
- 3: 4, CH4 with 4.30 Gg CO2 / year (0.1%)
- 4: M.AG.ELV, N2O with -1.40 Gg CO2 / year (-0.1%)
- 5: 3.A, CH4 with -0.49 Gg CO2 / year (-0.0%)
Changes in the main sectors for aggregate KyotoGHG (AR6GWP100) are
- 1: Total sectoral emissions in 2022 are 37807.34 Gg CO2 / year which is 66.7% of M.0.EL emissions. 2023 Emissions have changed by -0.0% (-6.02 Gg CO2 / year). 1990-2023 Emissions have changed by -0.0% (-0.18 Gg CO2 / year).
- 2: Total sectoral emissions in 2022 are 6242.57 Gg
CO2 / year which is 11.0% of M.0.EL emissions. 2023 Emissions have
changed by -2.7% (-172.65 Gg CO2 /
year). 1990-2023 Emissions have changed by 0.1% (10.23 Gg CO2 / year). For 2023 the
changes per gas
are:
- M.AG: Total sectoral emissions in 2022 are 6981.35 Gg CO2 / year which is 12.3% of M.0.EL emissions. 2023 Emissions have changed by -1.0% (-68.66 Gg CO2 / year). 1990-2023 Emissions have changed by -0.0% (-2.02 Gg CO2 / year).
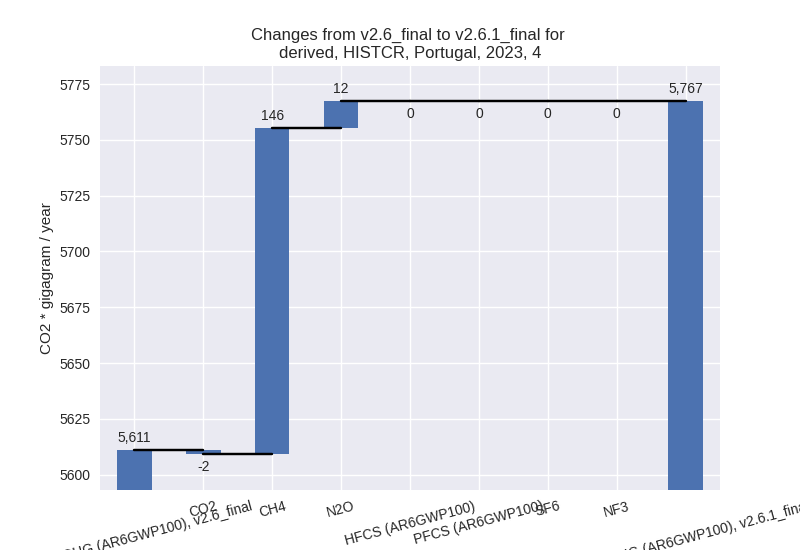
- 4: Total sectoral emissions in 2022 are 5651.53 Gg
CO2 / year which is 10.0% of M.0.EL emissions. 2023 Emissions have
changed by 2.8% (156.41 Gg CO2 /
year). 1990-2023 Emissions have changed by 0.1% (4.60 Gg CO2 / year). For 2023 the
changes per gas
are:
- 5: No data
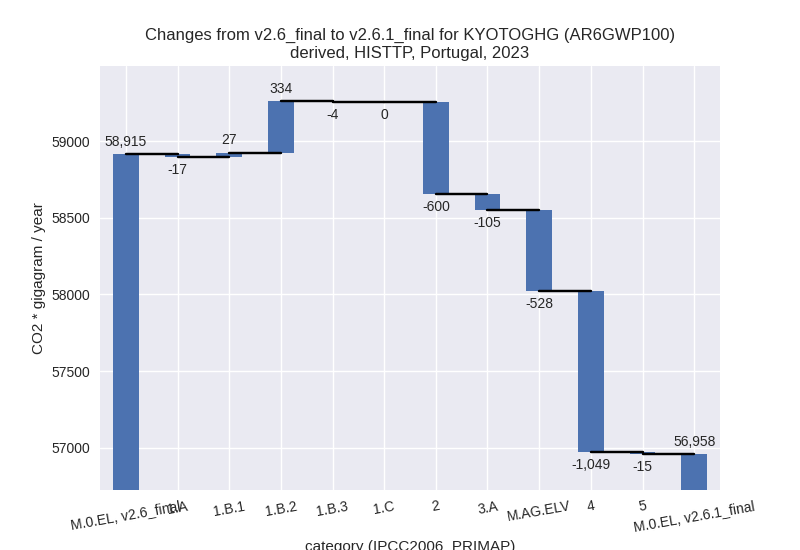
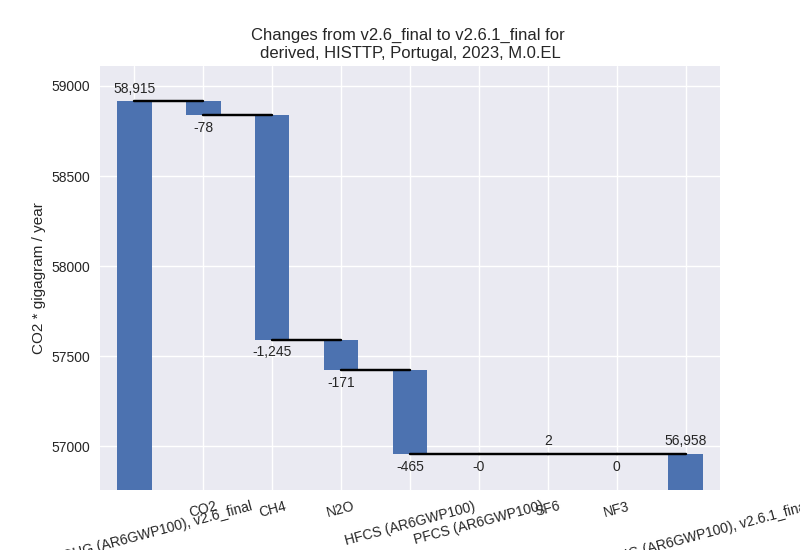
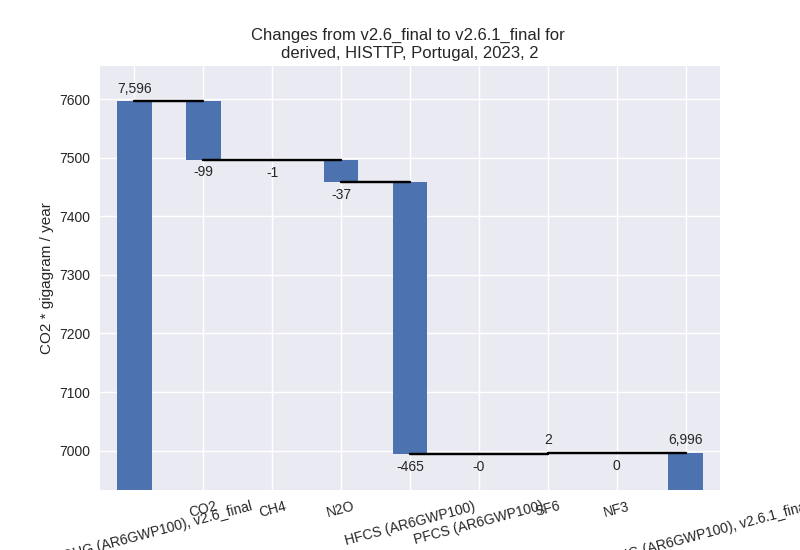
third party scenario (HISTTP):
Most important changes per time frame
For 2023 the following sector-gas combinations have the highest absolute impact on national total KyotoGHG (AR6GWP100) emissions in 2023 (top 5):
- 1: 4, CH4 with -1262.88 Gg CO2 / year (-24.2%)
- 2: 2, HFCS (AR6GWP100) with -465.22 Gg CO2 / year (-10.8%)
- 3: M.AG.ELV, CO2 with -382.20 Gg CO2 / year (-92.3%)
- 4: 1.B.2, CO2 with 226.43 Gg CO2 / year (3260741.7%)
- 5: 4, CO2 with 181.54 Gg CO2 / year (769.8%)
For 1990-2023 the following sector-gas combinations have the highest absolute impact on national total KyotoGHG (AR6GWP100) emissions in 1990-2023 (top 5):
- 1: M.AG.ELV, CO2 with -1053.29 Gg CO2 / year (-94.9%)
- 2: 4, CH4 with -1042.13 Gg CO2 / year (-18.1%)
- 3: 4, CO2 with 175.24 Gg CO2 / year (1375.8%)
- 4: 1.B.2, CO2 with 60.56 Gg CO2 / year (16443.5%)
- 5: 5, N2O with -41.90 Gg CO2 / year (-14.5%)
Changes in the main sectors for aggregate KyotoGHG (AR6GWP100) are
- 1: Total sectoral emissions in 2022 are 40425.32 Gg CO2 / year which is 68.3% of M.0.EL emissions. 2023 Emissions have changed by 0.9% (340.16 Gg CO2 / year). 1990-2023 Emissions have changed by 0.2% (100.98 Gg CO2 / year).
- 2: Total sectoral emissions in 2022 are 7135.91 Gg
CO2 / year which is 12.1% of M.0.EL emissions. 2023 Emissions have
changed by -7.9% (-600.20 Gg CO2 /
year). 1990-2023 Emissions have changed by -0.5% (-33.77 Gg CO2 / year). For 2023 the
changes per gas
are:
- M.AG: Total sectoral emissions in 2022 are 7129.57
Gg CO2 / year which is 12.0% of M.0.EL emissions. 2023 Emissions have
changed by -8.1% (-632.82 Gg CO2 /
year). 1990-2023 Emissions have changed by -12.1% (-1044.05 Gg CO2 / year). For 2023
the changes per gas
are:
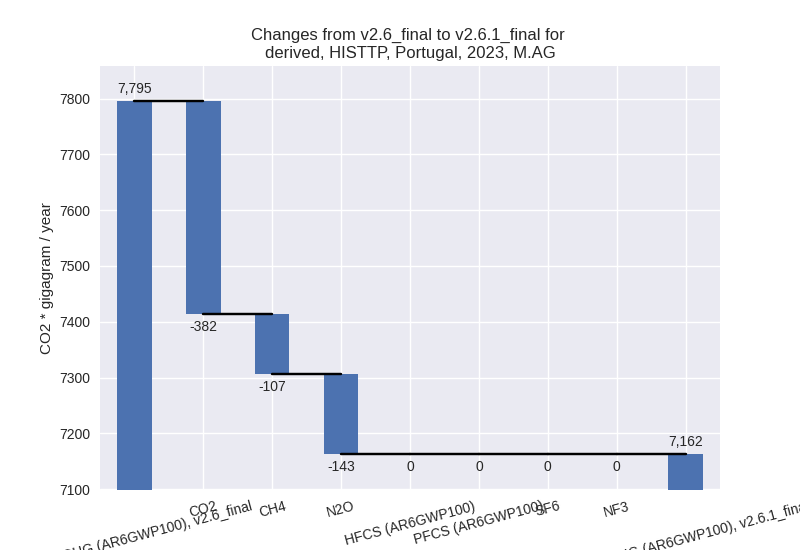
For 1990-2023 the changes per gas are: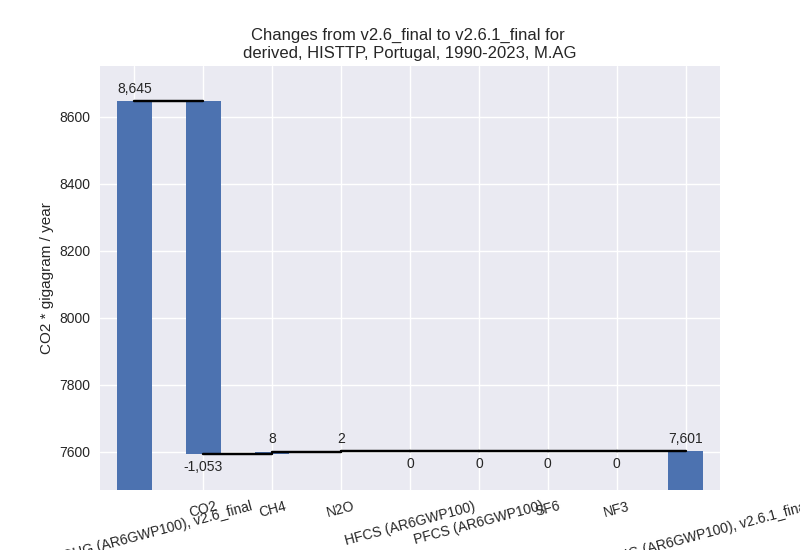
The changes come from the following subsectors:- 3.A: Total sectoral emissions in 2022 are 5163.33 Gg CO2 / year which is 72.4% of category M.AG emissions. 2023 Emissions have changed by -2.0% (-104.70 Gg CO2 / year). 1990-2023 Emissions have changed by 0.2% (9.45 Gg CO2 / year).
- M.AG.ELV: Total sectoral emissions in 2022 are
1966.24 Gg CO2 / year which is 27.6% of category M.AG emissions. 2023
Emissions have changed by -21.2%
(-528.11 Gg CO2 / year). 1990-2023 Emissions have changed by -31.0% (-1053.50 Gg CO2 / year). For 2023
the changes per gas
are:
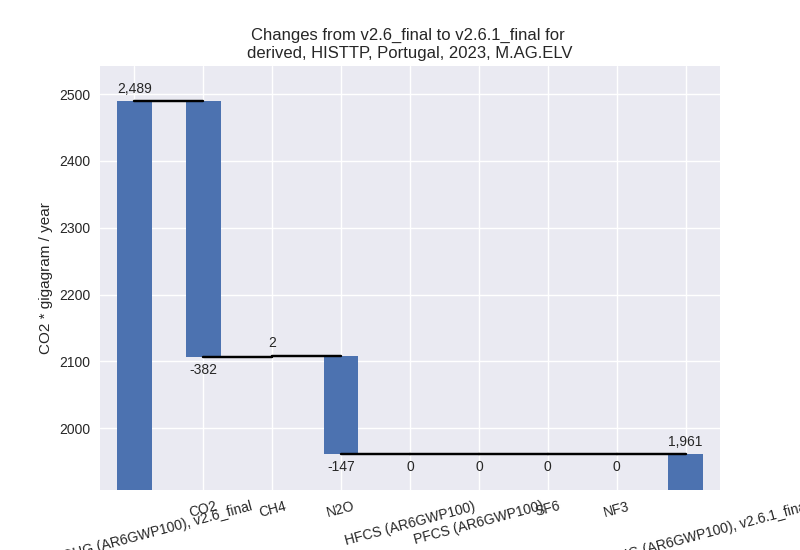
For 1990-2023 the changes per gas are: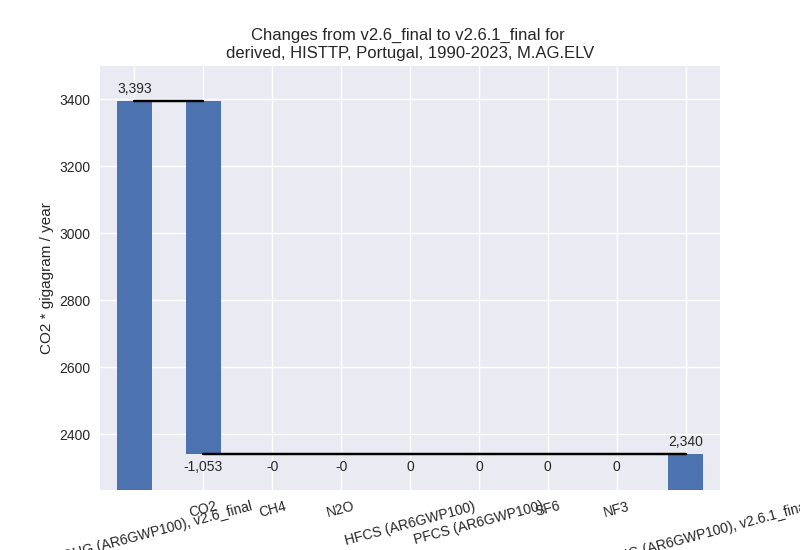
There is no subsector information available in PRIMAP-hist.
- 4: Total sectoral emissions in 2022 are 4336.71 Gg
CO2 / year which is 7.3% of M.0.EL emissions. 2023 Emissions have
changed by -19.1% (-1048.66 Gg CO2 /
year). 1990-2023 Emissions have changed by -14.0% (-839.65 Gg CO2 / year). For 2023
the changes per gas
are:
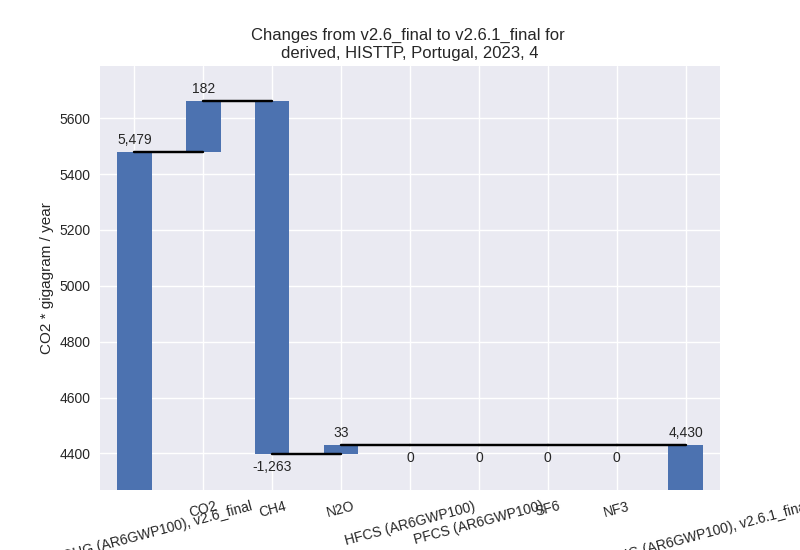
For 1990-2023 the changes per gas are: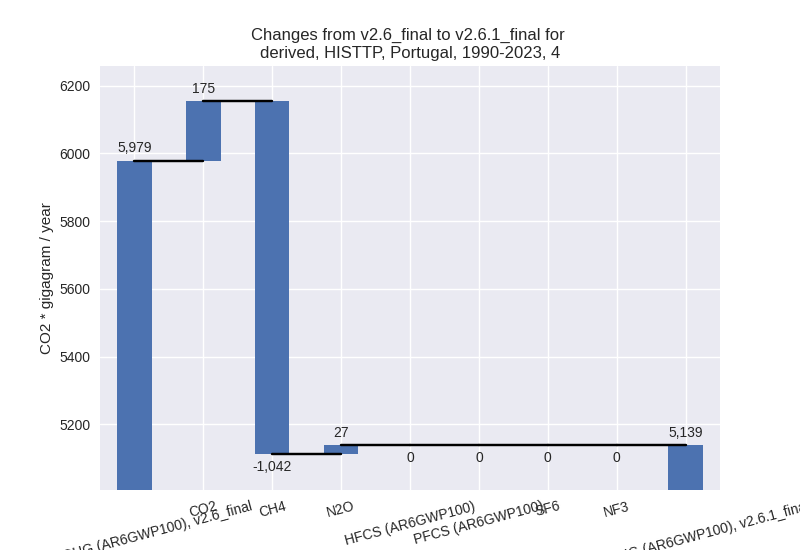
- 5: Total sectoral emissions in 2022 are 161.07 Gg
CO2 / year which is 0.3% of M.0.EL emissions. 2023 Emissions have
changed by -9.4% (-15.17 Gg CO2 /
year). 1990-2023 Emissions have changed by -14.5% (-41.90 Gg CO2 / year). For 2023
the changes per gas
are:

For 1990-2023 the changes per gas are: