Changes in PRIMAP-hist v2.6.1_final compared to v2.6_final for Romania
2025-03-19
Johannes Gütschow
Change analysis for Romania for PRIMAP-hist v2.6.1_final compared to v2.6_final
Overview over emissions by sector and gas
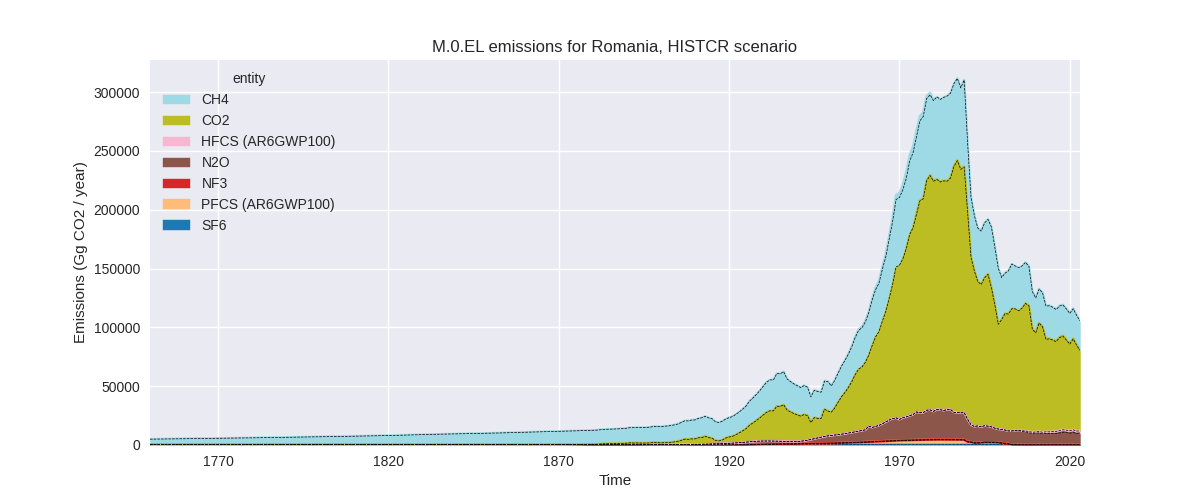
The following figures show the aggregate national total emissions excluding LULUCF AR6GWP100 for the country reported priority scenario. The dotted linesshow the v2.6_final data.
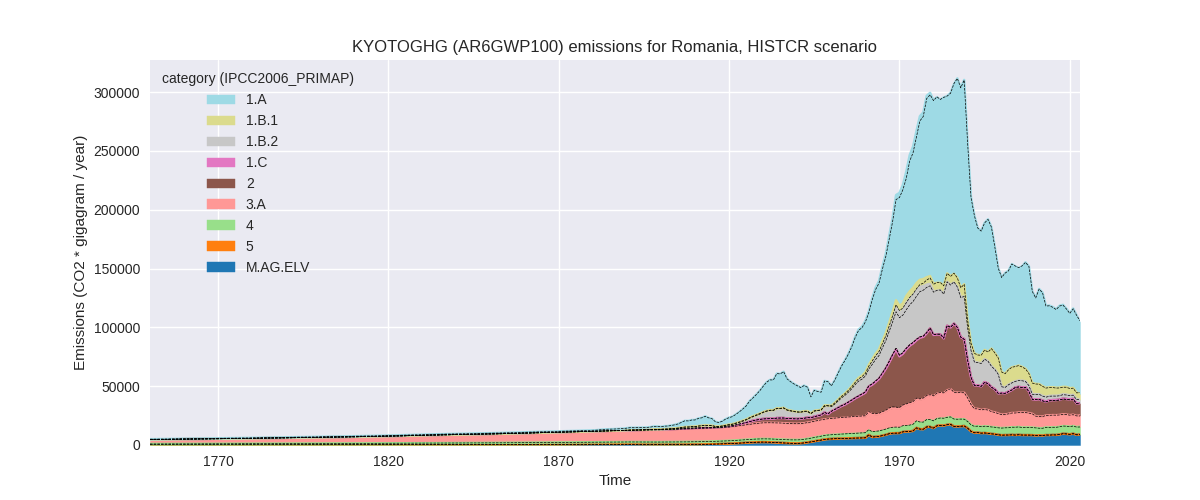
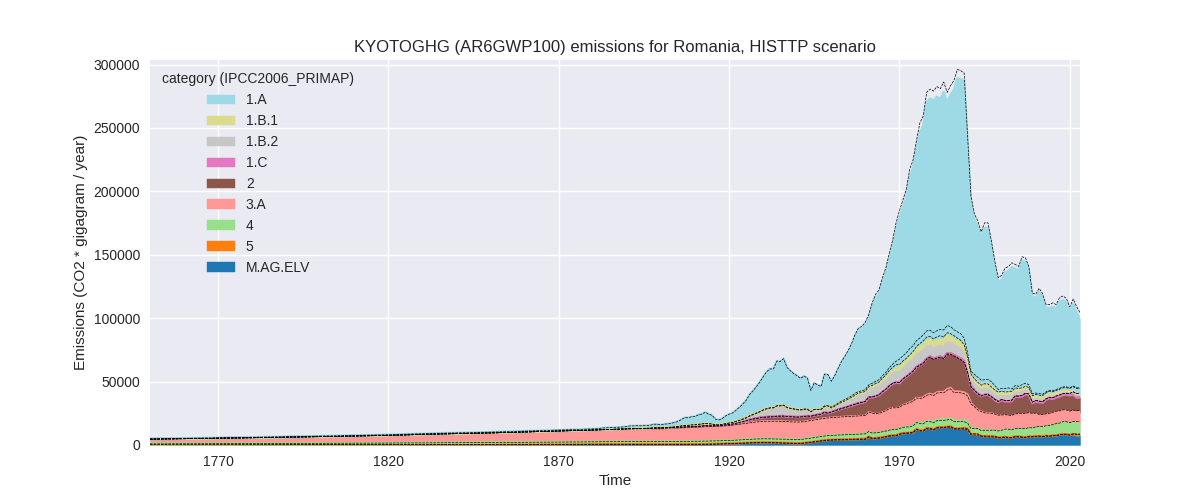
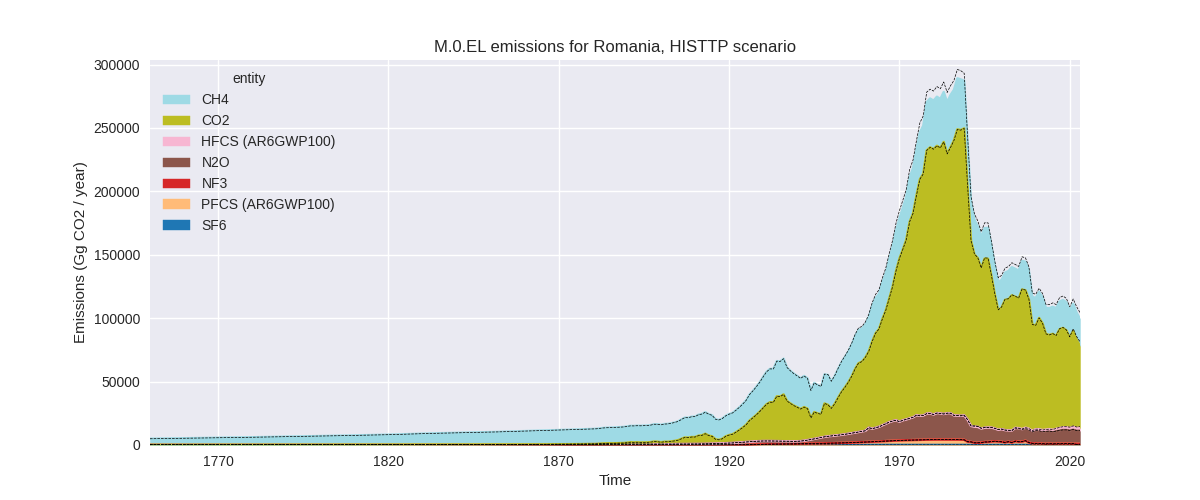
The following figures show the aggregate national total emissions excluding LULUCF AR6GWP100 for the third party priority scenario. The dotted linesshow the v2.6_final data.
Overview over changes
In the country reported priority scenario we have the following changes for aggregate Kyoto GHG and national total emissions excluding LULUCF (M.0.EL):
- Emissions in 2023 have changed by -1.2%% (-1232.81 Gg CO2 / year)
- Emissions in 1990-2023 have changed by 0.0%% (50.79 Gg CO2 / year)
In the third party priority scenario we have the following changes for aggregate Kyoto GHG and national total emissions excluding LULUCF (M.0.EL):
- Emissions in 2023 have changed by -4.7%% (-4904.45 Gg CO2 / year)
- Emissions in 1990-2023 have changed by -2.6%% (-3572.28 Gg CO2 / year)
Most important changes per scenario and time frame
In the country reported priority scenario the following sector-gas combinations have the highest absolute impact on national total KyotoGHG (AR6GWP100) emissions in 2023 (top 5):
- 1: 1.B.1, CH4 with -857.91 Gg CO2 / year (-15.2%)
- 2: 2, CO2 with -727.97 Gg CO2 / year (-8.5%)
- 3: M.AG.ELV, N2O with 213.40 Gg CO2 / year (2.7%)
- 4: 3.A, CH4 with 138.03 Gg CO2 / year (1.5%)
- 5: 4, CH4 with 88.08 Gg CO2 / year (1.4%)
In the country reported priority scenario the following sector-gas combinations have the highest absolute impact on national total KyotoGHG (AR6GWP100) emissions in 1990-2023 (top 5):
- 1: 2, CO2 with 98.73 Gg CO2 / year (0.7%)
- 2: 1.A, CO2 with -66.52 Gg CO2 / year (-0.1%)
- 3: 1.B.1, CH4 with -25.23 Gg CO2 / year (-0.3%)
- 4: 2, PFCS (AR6GWP100) with 24.67 Gg CO2 / year (3.2%)
- 5: 2, HFCS (AR6GWP100) with 8.74 Gg CO2 / year (1.0%)
In the third party priority scenario the following sector-gas combinations have the highest absolute impact on national total KyotoGHG (AR6GWP100) emissions in 2023 (top 5):
- 1: 2, CO2 with -1846.37 Gg CO2 / year (-23.4%)
- 2: 1.B.2, CH4 with -1745.30 Gg CO2 / year (-46.4%)
- 3: 2, HFCS (AR6GWP100) with -557.30 Gg CO2 / year (-18.9%)
- 4: M.AG.ELV, CO2 with -509.45 Gg CO2 / year (-37.6%)
- 5: 4, CH4 with -459.09 Gg CO2 / year (-4.9%)
In the third party priority scenario the following sector-gas combinations have the highest absolute impact on national total KyotoGHG (AR6GWP100) emissions in 1990-2023 (top 5):
- 1: 1.B.2, CH4 with -2723.78 Gg CO2 / year (-45.6%)
- 2: 4, CH4 with -397.69 Gg CO2 / year (-6.2%)
- 3: 1.B.2, CO2 with -126.54 Gg CO2 / year (-59.8%)
- 4: 2, HFCS (AR6GWP100) with -114.49 Gg CO2 / year (-11.5%)
- 5: 2, CO2 with -113.38 Gg CO2 / year (-1.5%)
Notes on data changes
Here we list notes explaining important emissions changes for the country.
- CRT data has been included but replaces official data reported to the EU which does not show noteworthy differences. Changes in the CR time-series are small and come from updated third party data (EDGAR, FAO) which is used to extrapolate the country reported data.
- Changes in the TP time-series come from updated EDGAR data. EDGAR has updated the last year data for some sectors (leading to 2023 emissions changes) and full time-series for others (leading to high cumulative emissions changes).
Changes by sector and gas
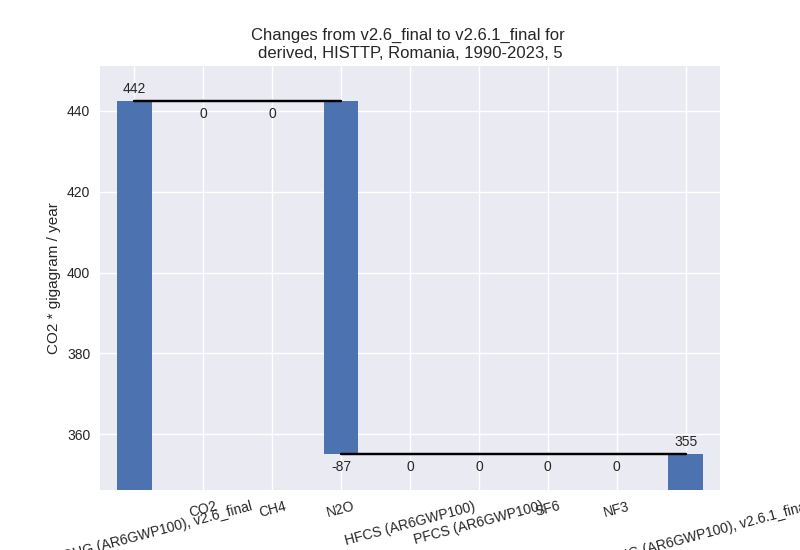
For each scenario and time frame the changes are displayed for all individual sectors and all individual gases. In the sector plot we use aggregate Kyoto GHGs in AR6GWP100. In the gas plot we usenational total emissions without LULUCF.
country reported scenario
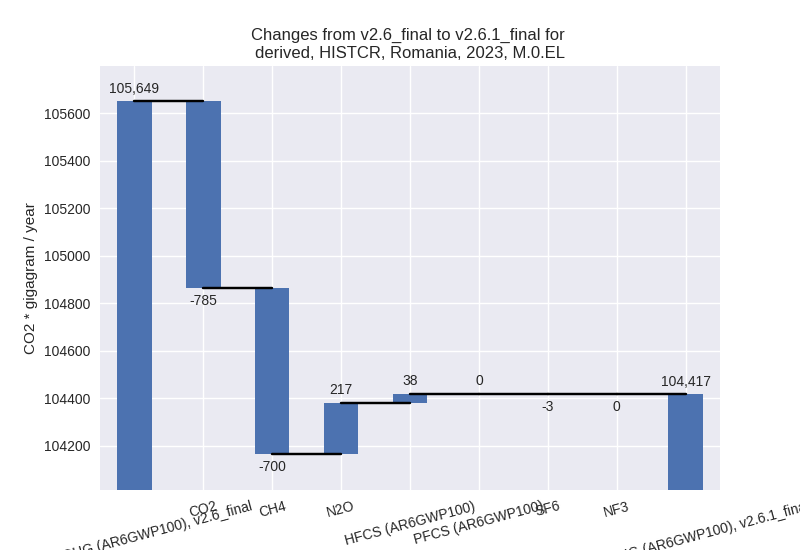
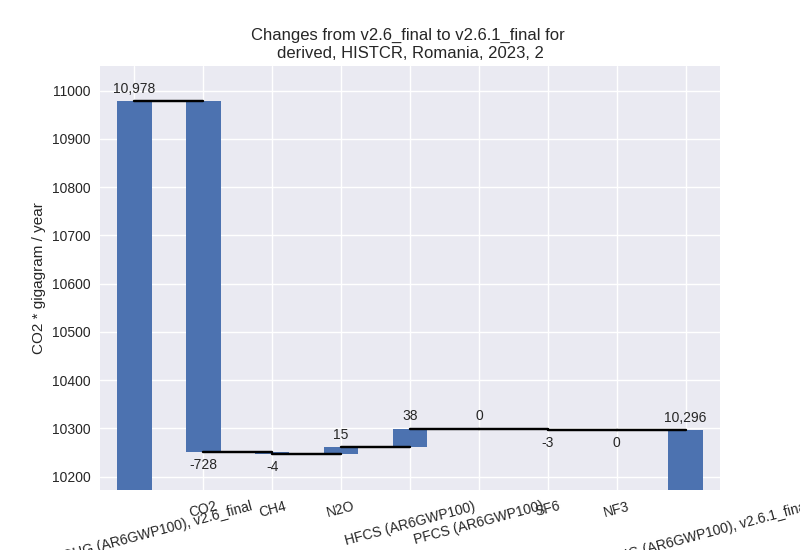
2023
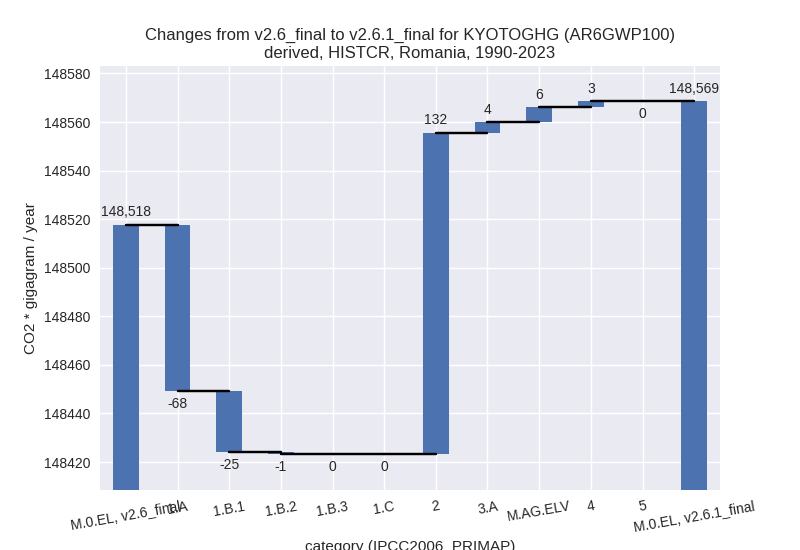
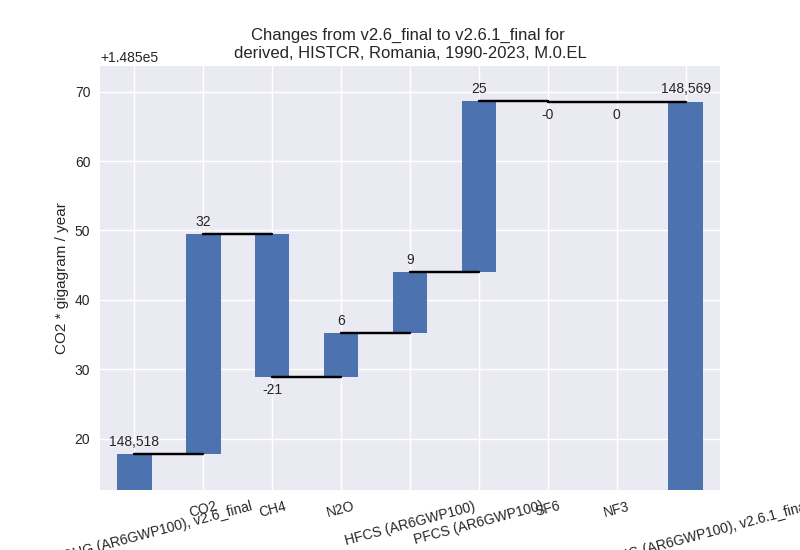
1990-2023
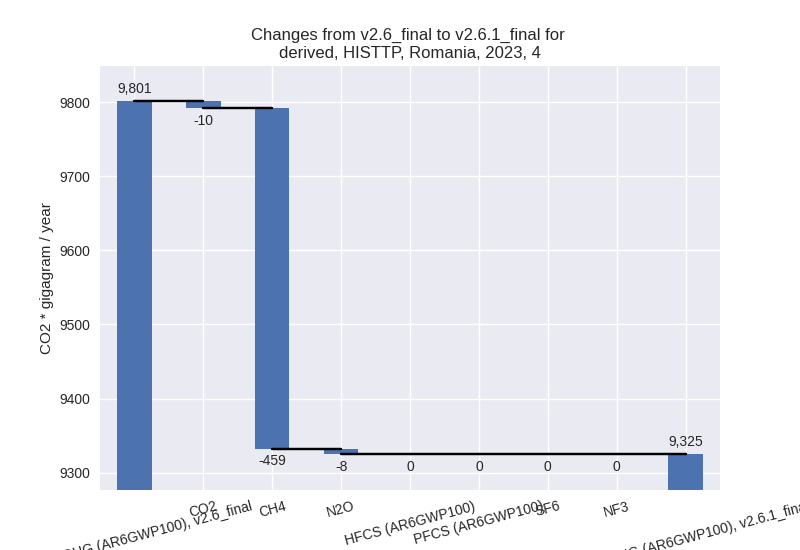
third party scenario
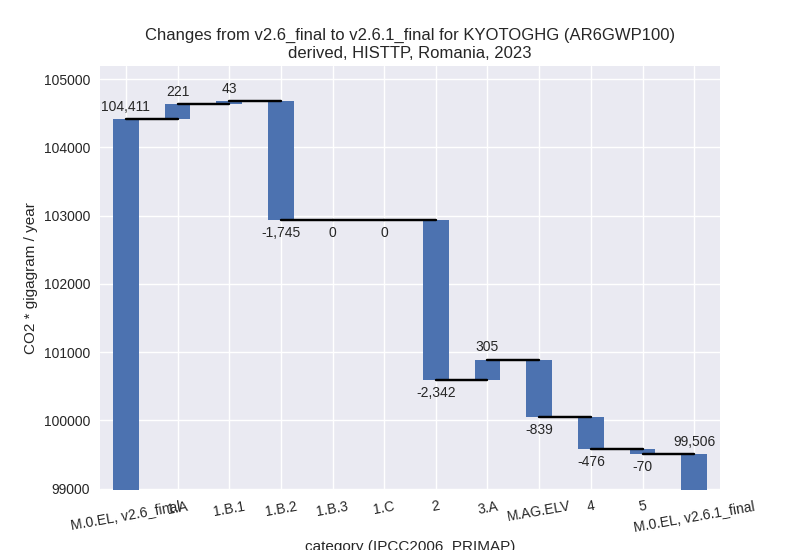
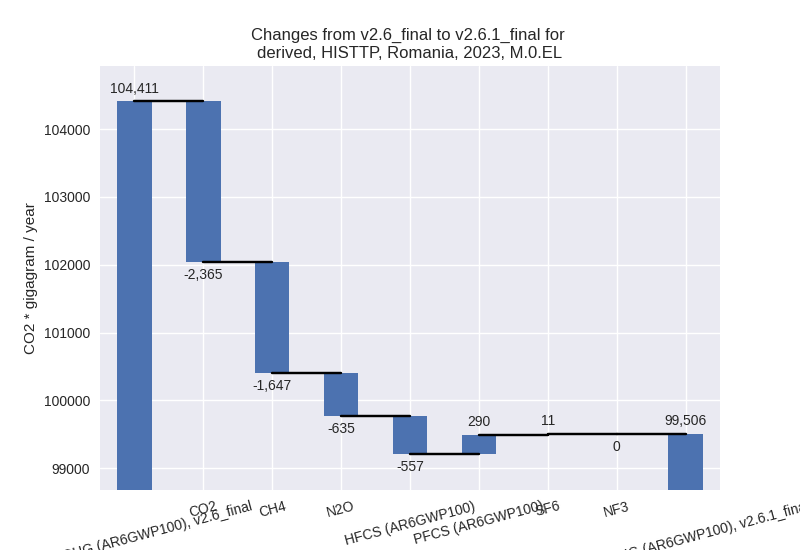
2023
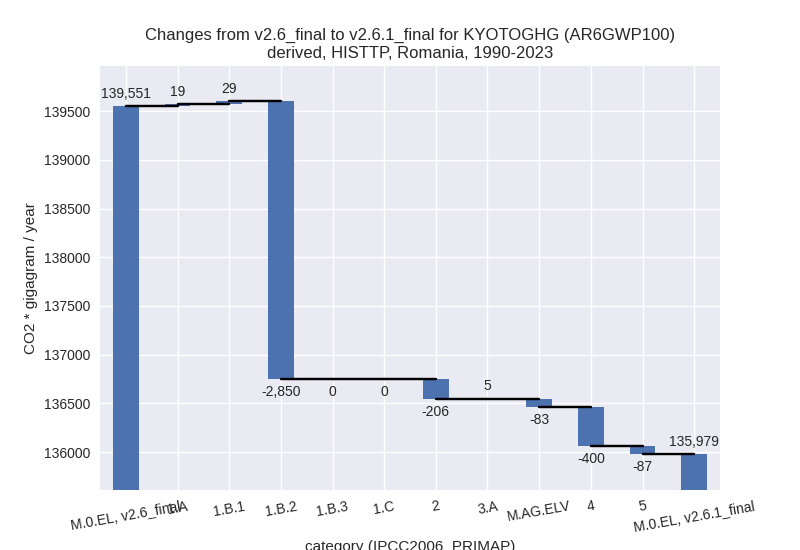
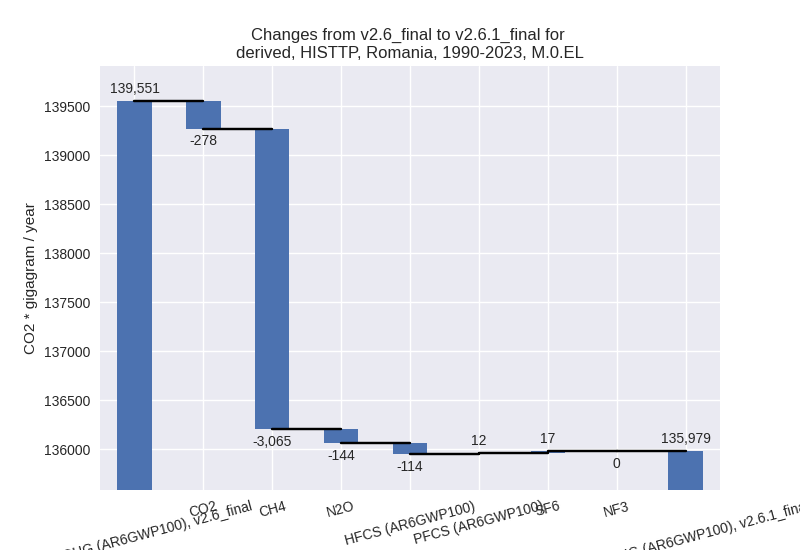
1990-2023
Detailed changes for the scenarios:
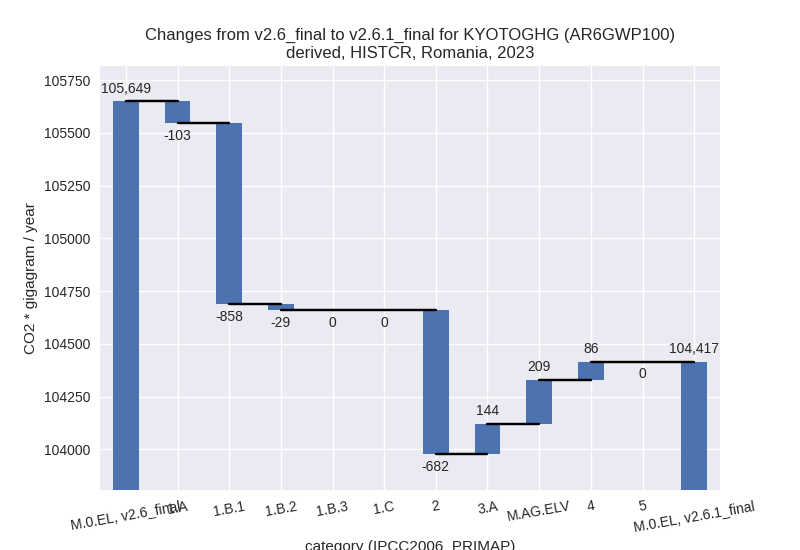
country reported scenario (HISTCR):
Most important changes per time frame
For 2023 the following sector-gas combinations have the highest absolute impact on national total KyotoGHG (AR6GWP100) emissions in 2023 (top 5):
- 1: 1.B.1, CH4 with -857.91 Gg CO2 / year (-15.2%)
- 2: 2, CO2 with -727.97 Gg CO2 / year (-8.5%)
- 3: M.AG.ELV, N2O with 213.40 Gg CO2 / year (2.7%)
- 4: 3.A, CH4 with 138.03 Gg CO2 / year (1.5%)
- 5: 4, CH4 with 88.08 Gg CO2 / year (1.4%)
For 1990-2023 the following sector-gas combinations have the highest absolute impact on national total KyotoGHG (AR6GWP100) emissions in 1990-2023 (top 5):
- 1: 2, CO2 with 98.73 Gg CO2 / year (0.7%)
- 2: 1.A, CO2 with -66.52 Gg CO2 / year (-0.1%)
- 3: 1.B.1, CH4 with -25.23 Gg CO2 / year (-0.3%)
- 4: 2, PFCS (AR6GWP100) with 24.67 Gg CO2 / year (3.2%)
- 5: 2, HFCS (AR6GWP100) with 8.74 Gg CO2 / year (1.0%)
Changes in the main sectors for aggregate KyotoGHG (AR6GWP100) are
- 1: Total sectoral emissions in 2022 are 75040.36 Gg CO2 / year which is 67.9% of M.0.EL emissions. 2023 Emissions have changed by -1.4% (-989.78 Gg CO2 / year). 1990-2023 Emissions have changed by -0.1% (-94.50 Gg CO2 / year).
- 2: Total sectoral emissions in 2022 are 10738.77 Gg
CO2 / year which is 9.7% of M.0.EL emissions. 2023 Emissions have
changed by -6.2% (-682.08 Gg CO2 /
year). 1990-2023 Emissions have changed by 0.8% (132.38 Gg CO2 / year). For 2023 the
changes per gas
are:
- M.AG: Total sectoral emissions in 2022 are 18199.75 Gg CO2 / year which is 16.5% of M.0.EL emissions. 2023 Emissions have changed by 1.9% (353.00 Gg CO2 / year). 1990-2023 Emissions have changed by 0.0% (10.38 Gg CO2 / year).
- 4: Total sectoral emissions in 2022 are 6540.54 Gg CO2 / year which is 5.9% of M.0.EL emissions. 2023 Emissions have changed by 1.3% (86.05 Gg CO2 / year). 1990-2023 Emissions have changed by 0.0% (2.53 Gg CO2 / year).
- 5: No data
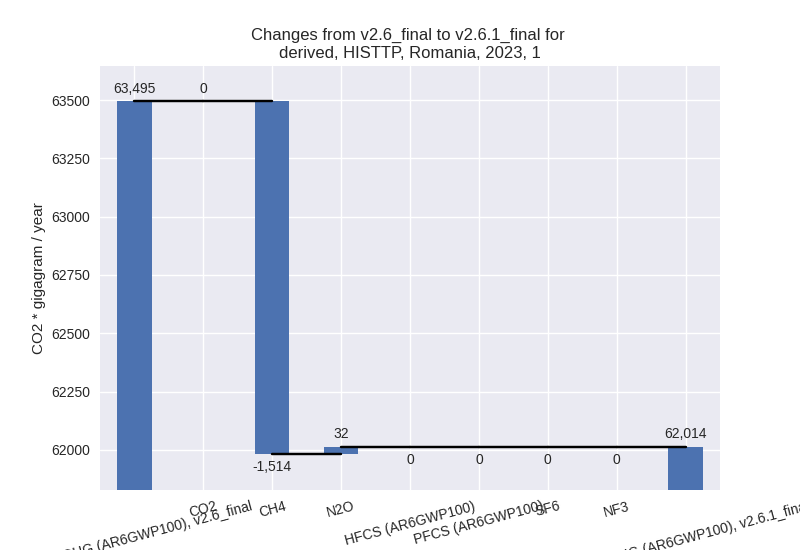
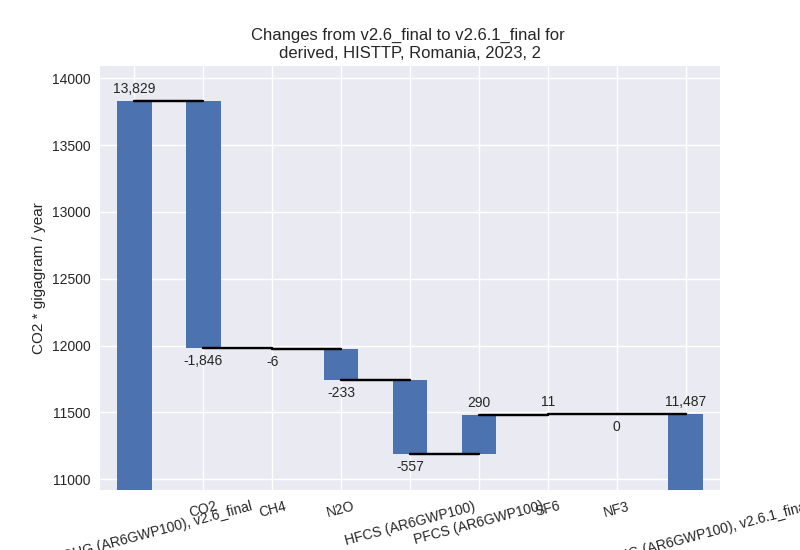
third party scenario (HISTTP):
Most important changes per time frame
For 2023 the following sector-gas combinations have the highest absolute impact on national total KyotoGHG (AR6GWP100) emissions in 2023 (top 5):
- 1: 2, CO2 with -1846.37 Gg CO2 / year (-23.4%)
- 2: 1.B.2, CH4 with -1745.30 Gg CO2 / year (-46.4%)
- 3: 2, HFCS (AR6GWP100) with -557.30 Gg CO2 / year (-18.9%)
- 4: M.AG.ELV, CO2 with -509.45 Gg CO2 / year (-37.6%)
- 5: 4, CH4 with -459.09 Gg CO2 / year (-4.9%)
For 1990-2023 the following sector-gas combinations have the highest absolute impact on national total KyotoGHG (AR6GWP100) emissions in 1990-2023 (top 5):
- 1: 1.B.2, CH4 with -2723.78 Gg CO2 / year (-45.6%)
- 2: 4, CH4 with -397.69 Gg CO2 / year (-6.2%)
- 3: 1.B.2, CO2 with -126.54 Gg CO2 / year (-59.8%)
- 4: 2, HFCS (AR6GWP100) with -114.49 Gg CO2 / year (-11.5%)
- 5: 2, CO2 with -113.38 Gg CO2 / year (-1.5%)
Changes in the main sectors for aggregate KyotoGHG (AR6GWP100) are
- 1: Total sectoral emissions in 2022 are 66985.86 Gg
CO2 / year which is 64.2% of M.0.EL emissions. 2023 Emissions have
changed by -2.3% (-1481.38 Gg CO2 /
year). 1990-2023 Emissions have changed by -2.8% (-2801.49 Gg CO2 / year). For 2023
the changes per gas
are:
For 1990-2023 the changes per gas are: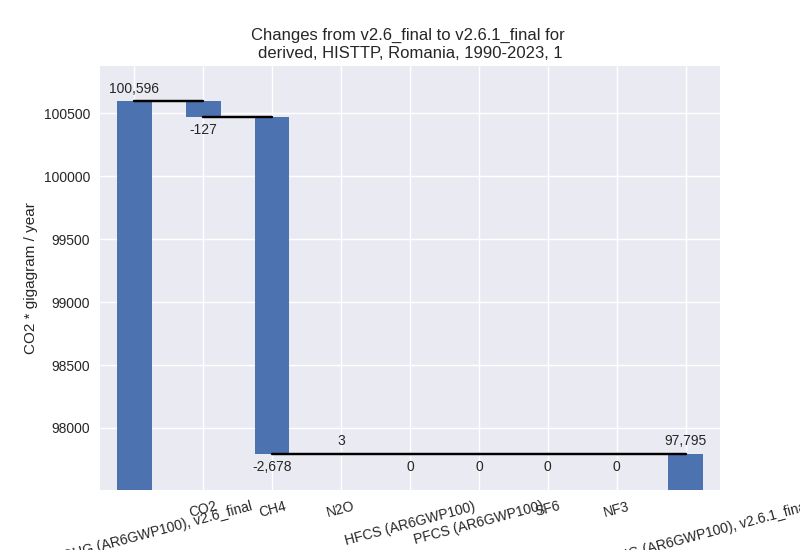
The changes come from the following subsectors:- 1.A: Total sectoral emissions in 2022 are 64239.90 Gg CO2 / year which is 95.9% of category 1 emissions. 2023 Emissions have changed by 0.4% (220.66 Gg CO2 / year). 1990-2023 Emissions have changed by 0.0% (19.41 Gg CO2 / year).
- 1.B.1: Total sectoral emissions in 2022 are 613.78
Gg CO2 / year which is 0.9% of category 1 emissions. 2023 Emissions have
changed by 9.4% (43.16 Gg CO2 /
year). 1990-2023 Emissions have changed by 1.5% (29.27 Gg CO2 / year). For 2023 the
changes per gas
are:
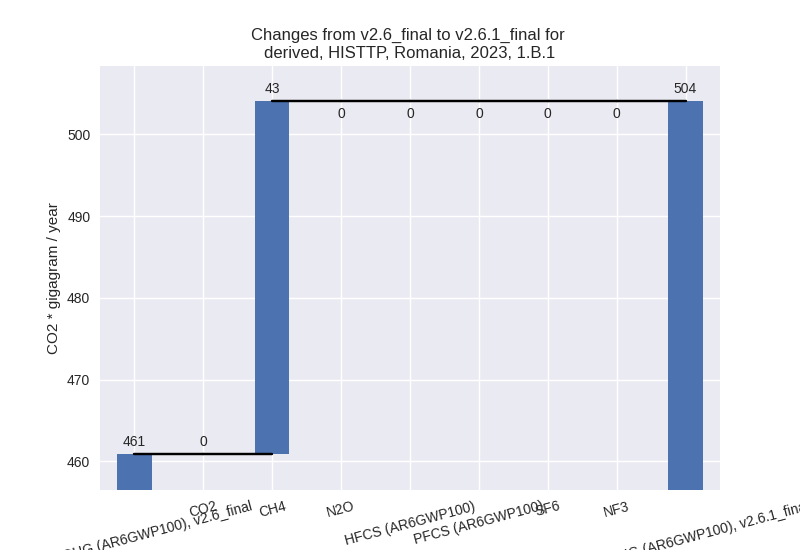
There is no subsector information available in PRIMAP-hist. - 1.B.2: Total sectoral emissions in 2022 are 2132.18
Gg CO2 / year which is 3.2% of category 1 emissions. 2023 Emissions have
changed by -45.7% (-1745.20 Gg CO2 /
year). 1990-2023 Emissions have changed by -46.0% (-2850.16 Gg CO2 / year). For 2023
the changes per gas
are:

For 1990-2023 the changes per gas are: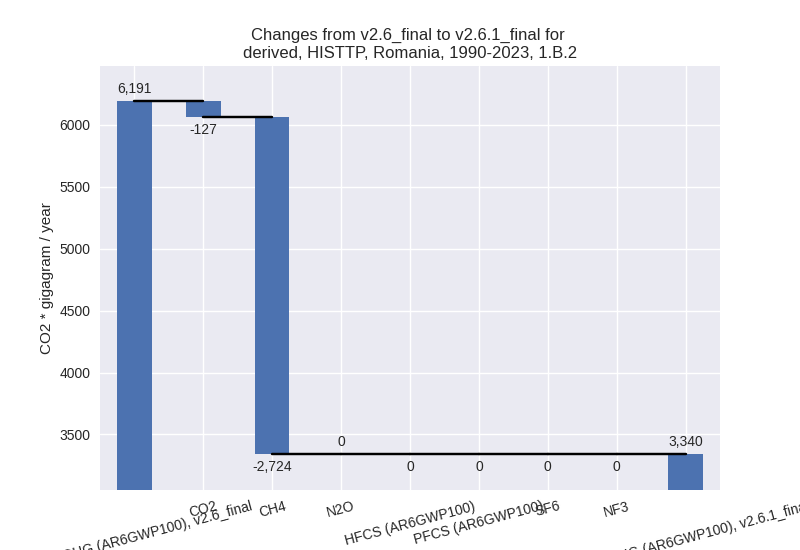
There is no subsector information available in PRIMAP-hist.
- 2: Total sectoral emissions in 2022 are 11699.73 Gg
CO2 / year which is 11.2% of M.0.EL emissions. 2023 Emissions have
changed by -16.9% (-2342.13 Gg CO2 /
year). 1990-2023 Emissions have changed by -1.6% (-205.69 Gg CO2 / year). For 2023
the changes per gas
are:
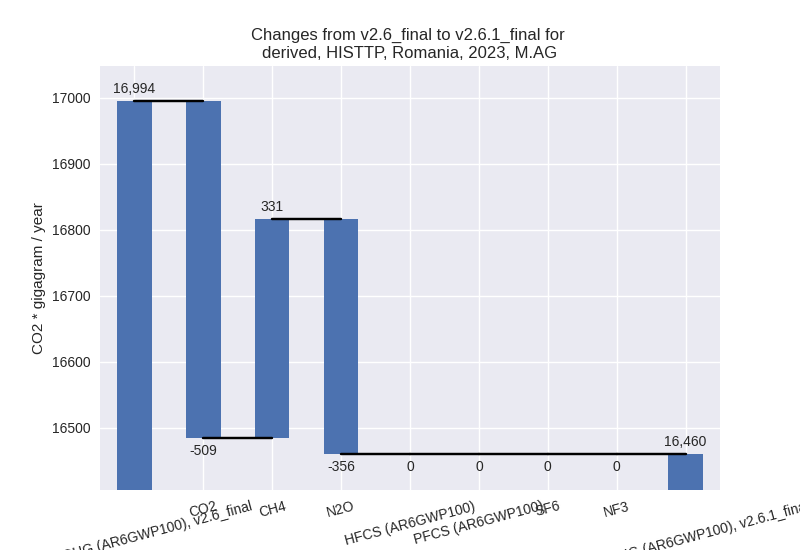
- M.AG: Total sectoral emissions in 2022 are 16231.32
Gg CO2 / year which is 15.6% of M.0.EL emissions. 2023 Emissions have
changed by -3.1% (-534.07 Gg CO2 /
year). 1990-2023 Emissions have changed by -0.4% (-78.02 Gg CO2 / year). For 2023 the
changes per gas
are:
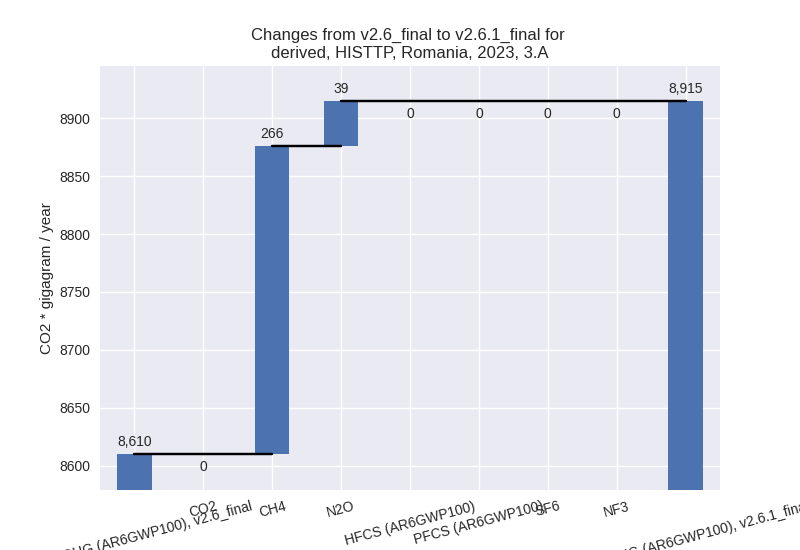
The changes come from the following subsectors:- 3.A: Total sectoral emissions in 2022 are 8905.90
Gg CO2 / year which is 54.9% of category M.AG emissions. 2023 Emissions
have changed by 3.5% (304.81 Gg CO2
/ year). 1990-2023 Emissions have changed by 0.0% (5.16 Gg CO2 / year). For 2023 the
changes per gas
are:
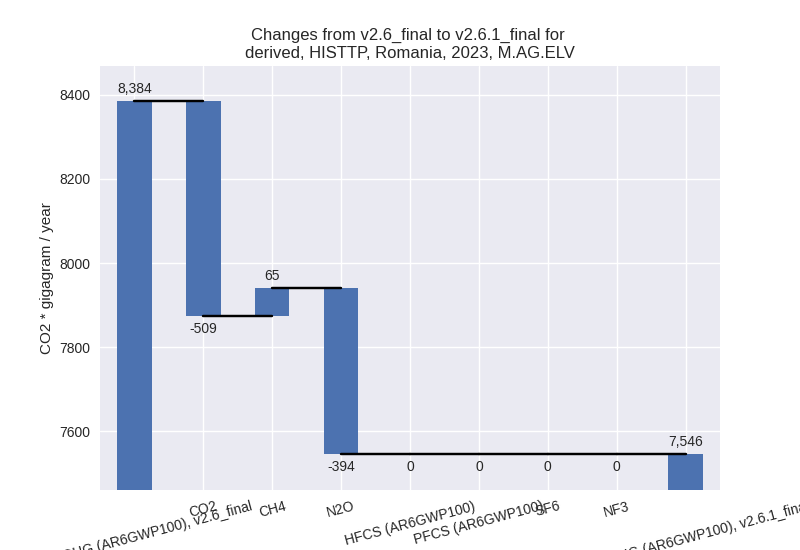
There is no subsector information available in PRIMAP-hist. - M.AG.ELV: Total sectoral emissions in 2022 are
7325.41 Gg CO2 / year which is 45.1% of category M.AG emissions. 2023
Emissions have changed by -10.0%
(-838.88 Gg CO2 / year). 1990-2023 Emissions have changed by -1.2% (-83.18 Gg CO2 / year). For 2023 the
changes per gas
are:
There is no subsector information available in PRIMAP-hist.
- 3.A: Total sectoral emissions in 2022 are 8905.90
Gg CO2 / year which is 54.9% of category M.AG emissions. 2023 Emissions
have changed by 3.5% (304.81 Gg CO2
/ year). 1990-2023 Emissions have changed by 0.0% (5.16 Gg CO2 / year). For 2023 the
changes per gas
are:
- 4: Total sectoral emissions in 2022 are 9190.80 Gg
CO2 / year which is 8.8% of M.0.EL emissions. 2023 Emissions have
changed by -4.9% (-476.44 Gg CO2 /
year). 1990-2023 Emissions have changed by -5.8% (-399.68 Gg CO2 / year). For 2023
the changes per gas
are:
For 1990-2023 the changes per gas are: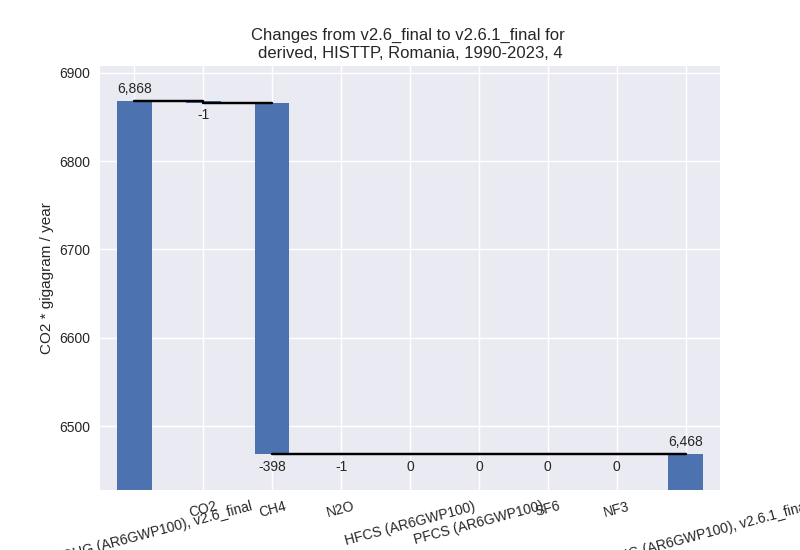
- 5: Total sectoral emissions in 2022 are 247.42 Gg
CO2 / year which is 0.2% of M.0.EL emissions. 2023 Emissions have
changed by -24.2% (-70.43 Gg CO2 /
year). 1990-2023 Emissions have changed by -19.8% (-87.40 Gg CO2 / year). For 2023
the changes per gas
are:

For 1990-2023 the changes per gas are: