Changes in PRIMAP-hist v2.6.1_final compared to v2.6_final for Russian Federation
2025-03-19
Johannes Gütschow
Change analysis for Russian Federation for PRIMAP-hist v2.6.1_final compared to v2.6_final
Overview over emissions by sector and gas
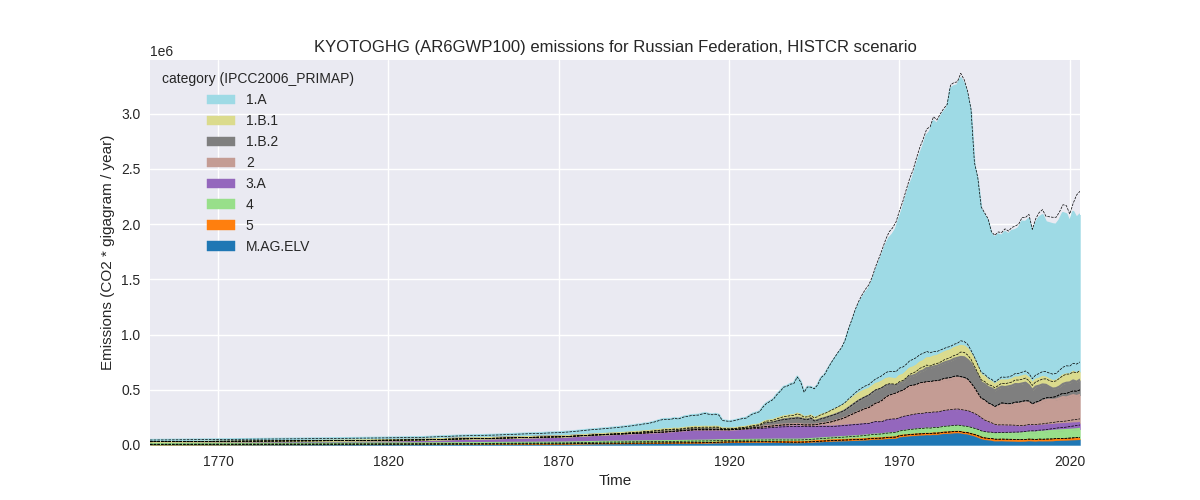
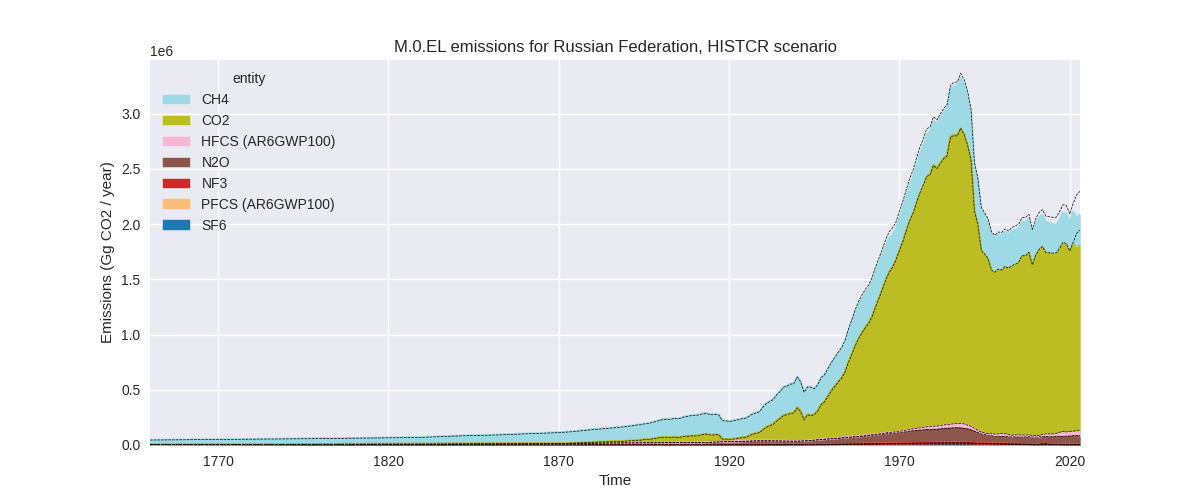
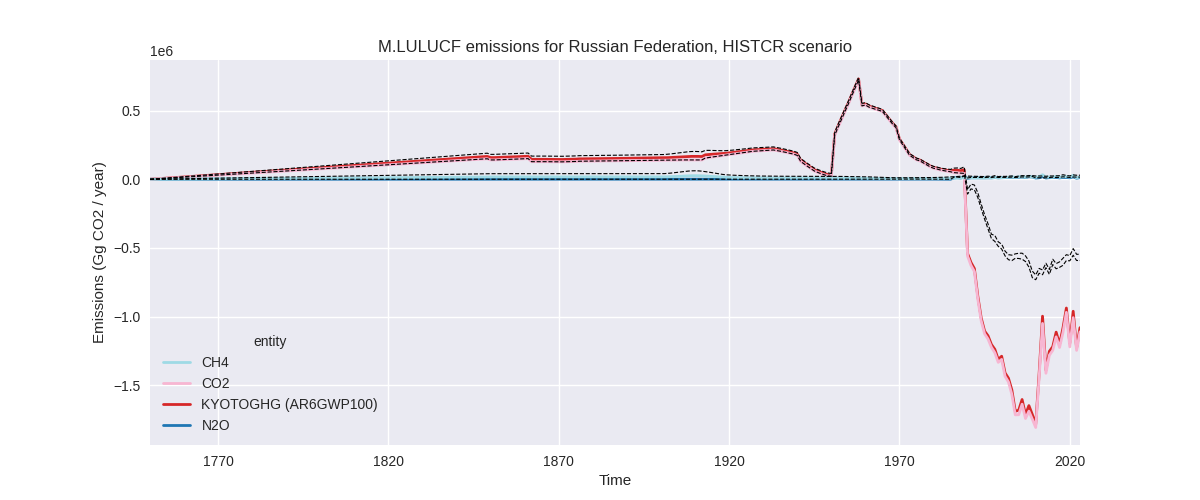
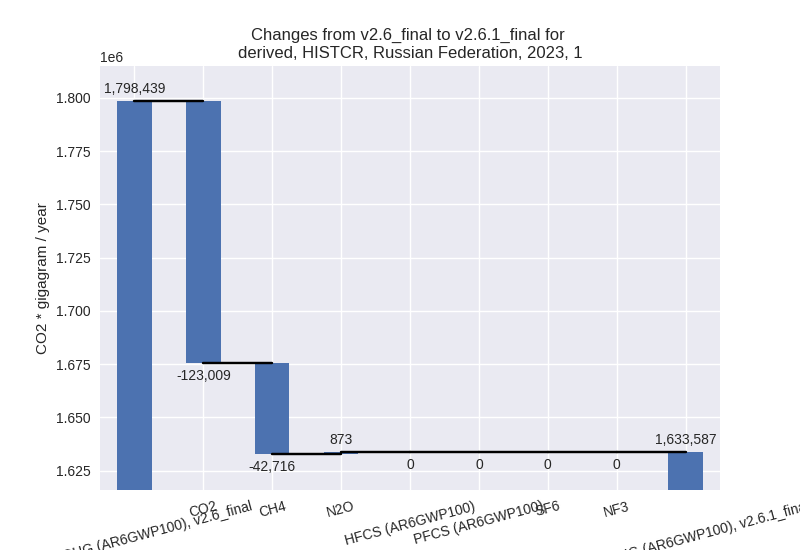
The following figures show the aggregate national total emissions excluding LULUCF AR6GWP100 for the country reported priority scenario. The dotted linesshow the v2.6_final data.
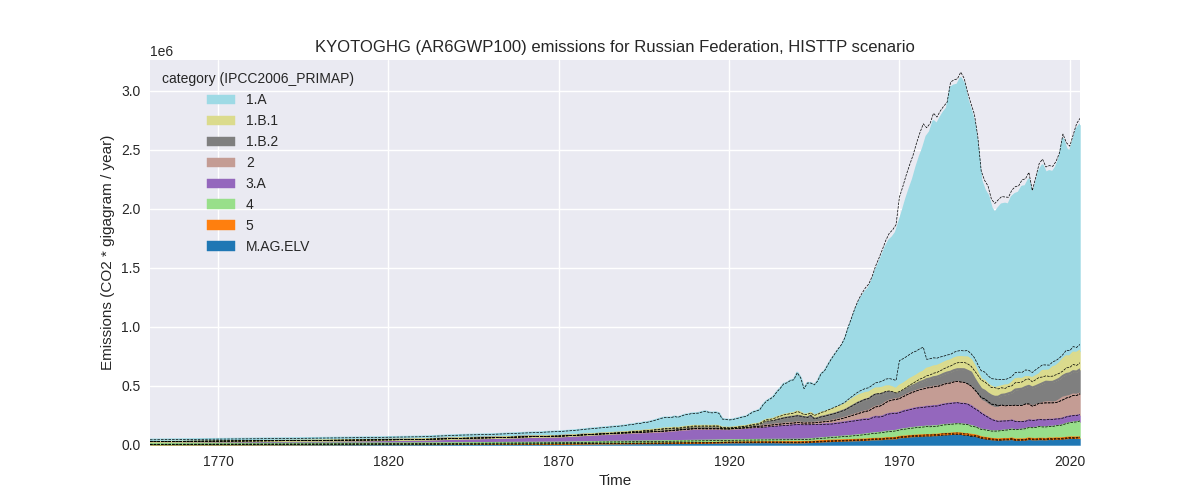
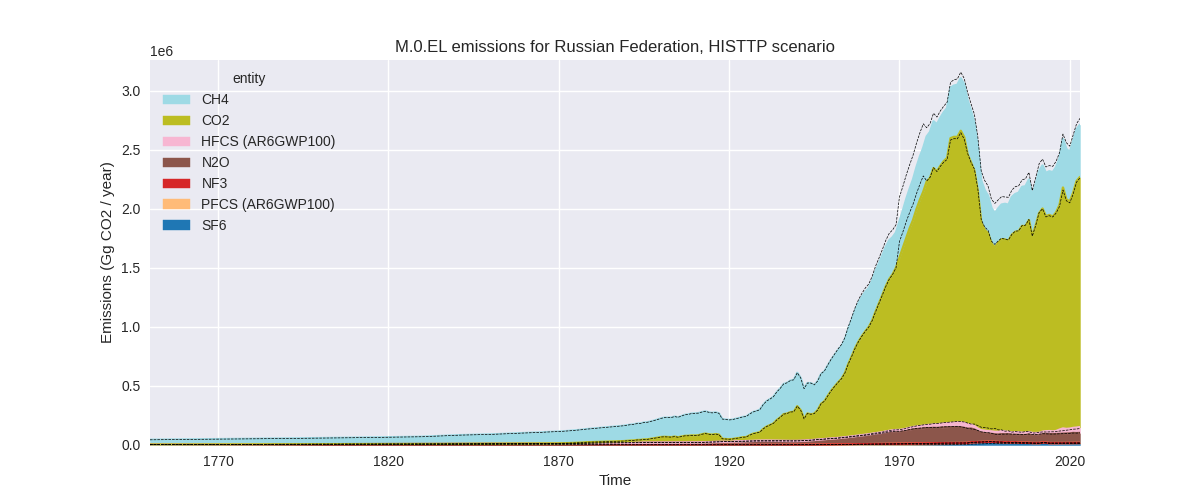
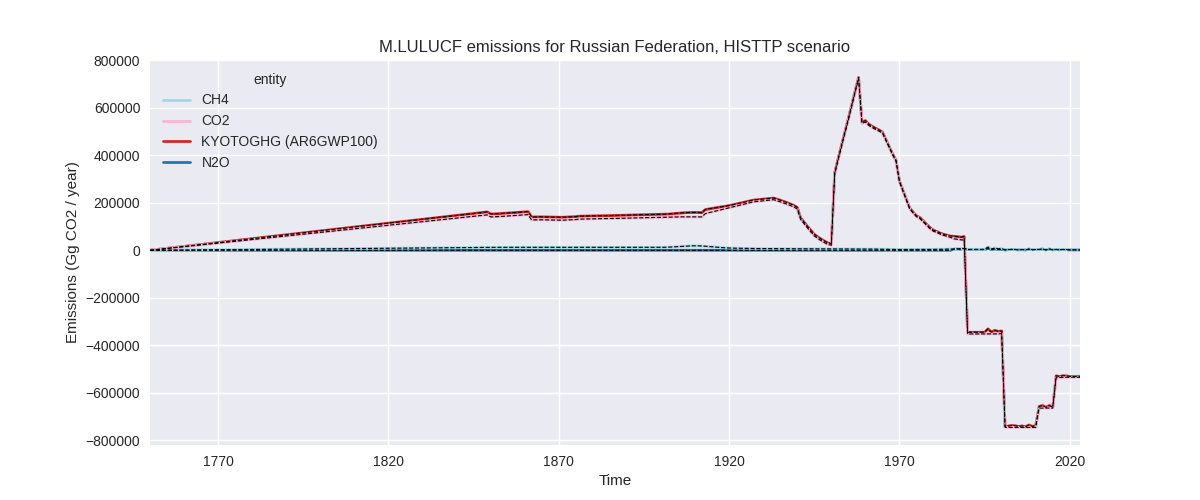
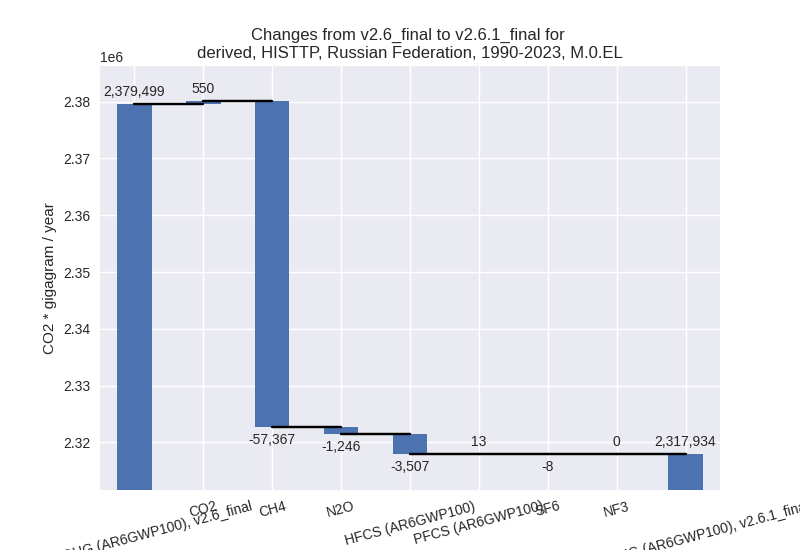
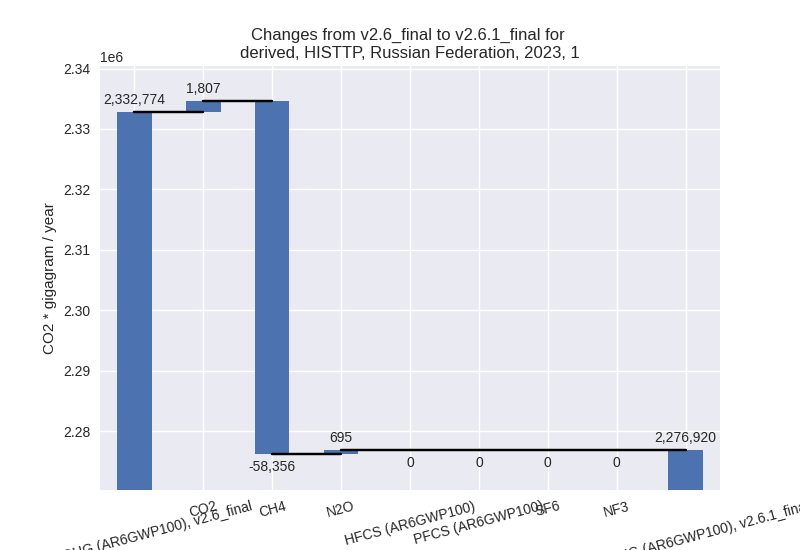
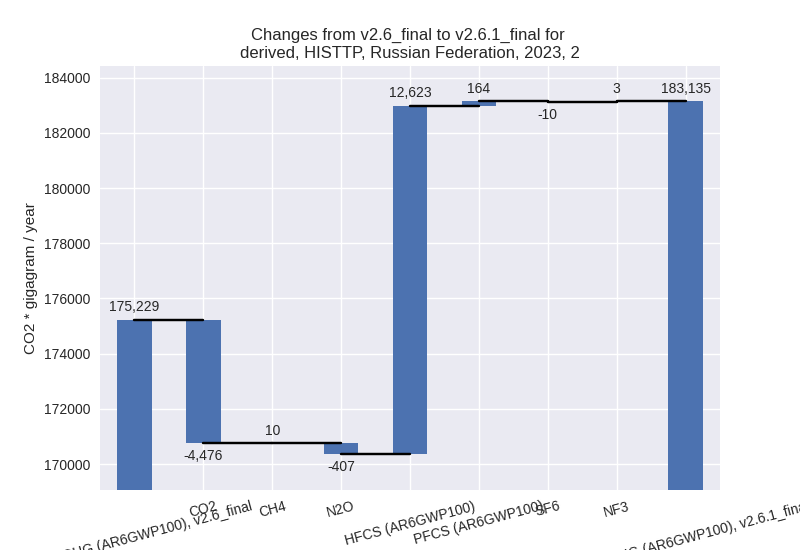
The following figures show the aggregate national total emissions excluding LULUCF AR6GWP100 for the third party priority scenario. The dotted linesshow the v2.6_final data.
Overview over changes
In the country reported priority scenario we have the following changes for aggregate Kyoto GHG and national total emissions excluding LULUCF (M.0.EL):
- Emissions in 2023 have changed by -9.2%% (-211677.10 Gg CO2 / year)
- Emissions in 1990-2023 have changed by -2.5%% (-54347.87 Gg CO2 / year)
In the third party priority scenario we have the following changes for aggregate Kyoto GHG and national total emissions excluding LULUCF (M.0.EL):
- Emissions in 2023 have changed by -2.0%% (-54940.80 Gg CO2 / year)
- Emissions in 1990-2023 have changed by -2.6%% (-61564.76 Gg CO2 / year)
Most important changes per scenario and time frame
In the country reported priority scenario the following sector-gas combinations have the highest absolute impact on national total KyotoGHG (AR6GWP100) emissions in 2023 (top 5):
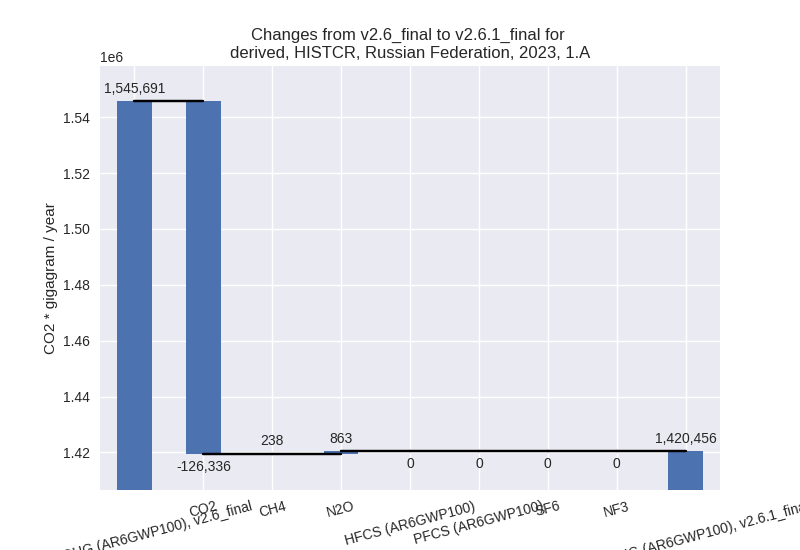
- 1: 1.A, CO2 with -126335.50 Gg CO2 / year (-8.2%)
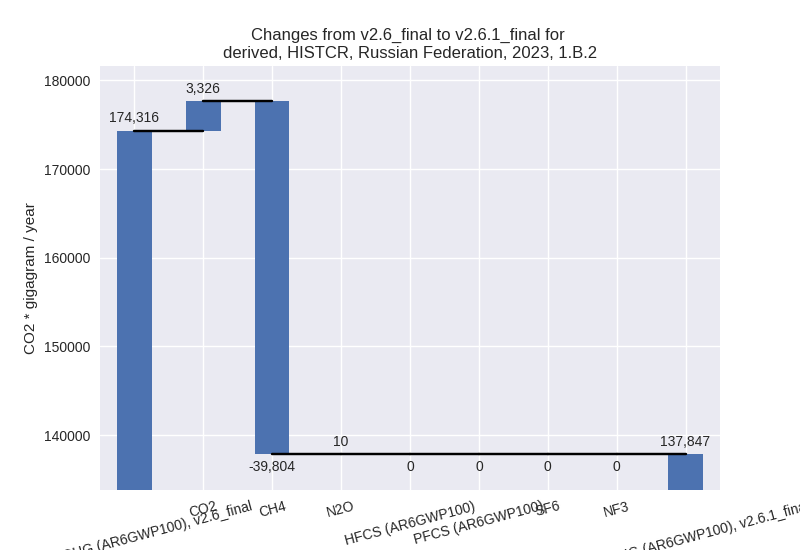
- 2: 1.B.2, CH4 with -39804.41 Gg CO2 / year (-37.2%)
- 3: 4, CH4 with -23056.44 Gg CO2 / year (-21.2%)
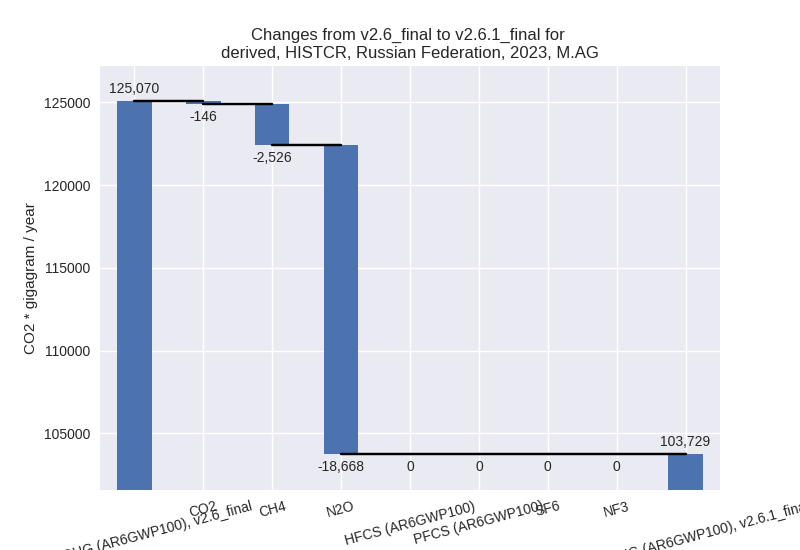
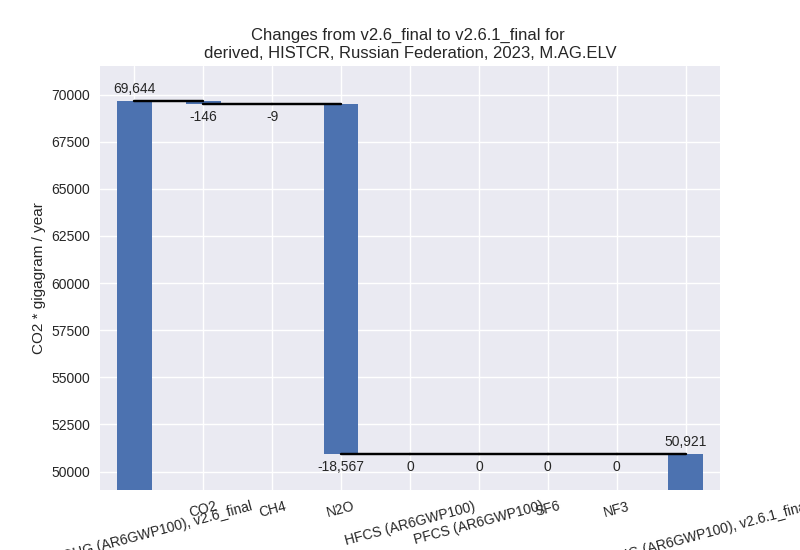
- 4: M.AG.ELV, N2O with -18566.96 Gg CO2 / year (-27.3%)
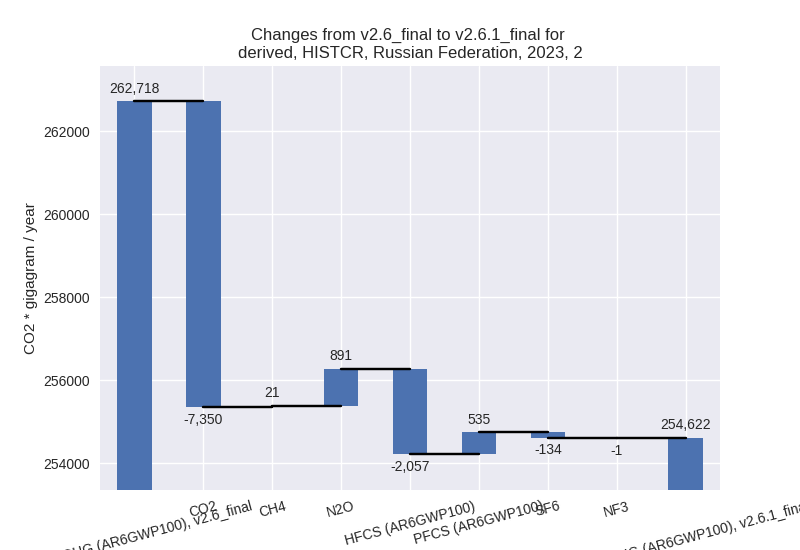
- 5: 2, CO2 with -7350.35 Gg CO2 / year (-3.5%)
In the country reported priority scenario the following sector-gas combinations have the highest absolute impact on national total KyotoGHG (AR6GWP100) emissions in 1990-2023 (top 5):
- 1: 1.B.2, CH4 with -24187.88 Gg CO2 / year (-17.5%)
- 2: M.AG.ELV, N2O with -15379.75 Gg CO2 / year (-26.1%)
- 3: 4, CH4 with -8506.04 Gg CO2 / year (-11.6%)
- 4: 1.A, CO2 with -6682.91 Gg CO2 / year (-0.5%)
- 5: 5, N2O with 6225.93 Gg CO2 / year (inf%)
In the third party priority scenario the following sector-gas combinations have the highest absolute impact on national total KyotoGHG (AR6GWP100) emissions in 2023 (top 5):
- 1: 1.B.2, CH4 with -58916.05 Gg CO2 / year (-28.9%)
- 2: 2, HFCS (AR6GWP100) with 12622.66 Gg CO2 / year (34.2%)
- 3: 2, CO2 with -4476.41 Gg CO2 / year (-4.4%)
- 4: M.AG.ELV, CO2 with -1946.75 Gg CO2 / year (-25.1%)
- 5: 1.B.1, CO2 with 1807.32 Gg CO2 / year (3.5%)
In the third party priority scenario the following sector-gas combinations have the highest absolute impact on national total KyotoGHG (AR6GWP100) emissions in 1990-2023 (top 5):
- 1: 1.B.2, CH4 with -52197.95 Gg CO2 / year (-30.8%)
- 2: 2, HFCS (AR6GWP100) with -3506.82 Gg CO2 / year (-12.3%)
- 3: 1.A, CH4 with -3388.08 Gg CO2 / year (-38.7%)
- 4: 4, CH4 with -2614.20 Gg CO2 / year (-2.9%)
- 5: 5, N2O with -1318.27 Gg CO2 / year (-17.5%)
Notes on data changes
Here we list notes explaining important emissions changes for the country.
- CRT data from BTR1 has been added. There was no new country reported
data for Russia in v2.6.
- The highest 2023 change comes from energy CO2 where EI data shows increasing emissions for 2022 while the CRT data shows an emissions decrease. A reason for this discrepancy might be the high fuel use for Russia’s war against Ukraine and the different accounting for military emissions.
- CH4 emissions in 1.B.2 and 4 have been reduced for all years which means that underlying activity data or emissions factors have been changed. This is also the case for N2O from M.AG.ELV which is now in line with FAO emissions and was substantially higher before.
- Changes in the TP scenario are smaller and due to updated EDGAR data.
Changes by sector and gas
For each scenario and time frame the changes are displayed for all individual sectors and all individual gases. In the sector plot we use aggregate Kyoto GHGs in AR6GWP100. In the gas plot we usenational total emissions without LULUCF.
country reported scenario
2023
1990-2023

third party scenario
2023
1990-2023
Detailed changes for the scenarios:
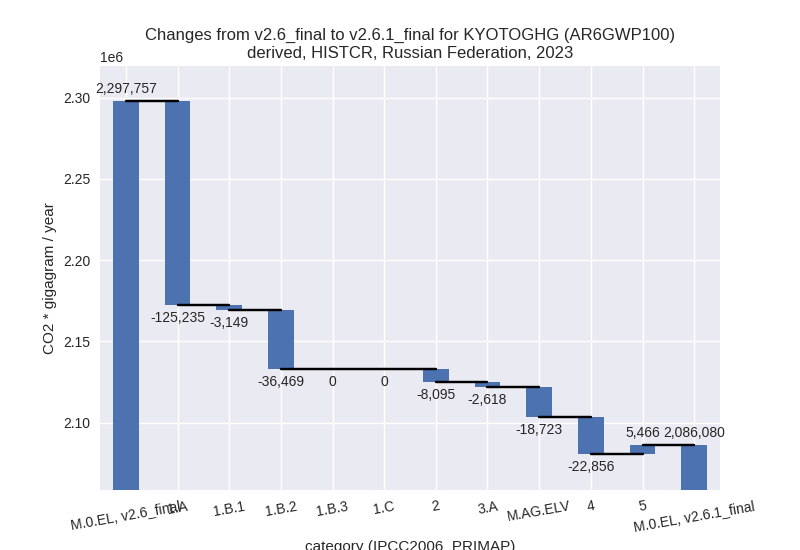
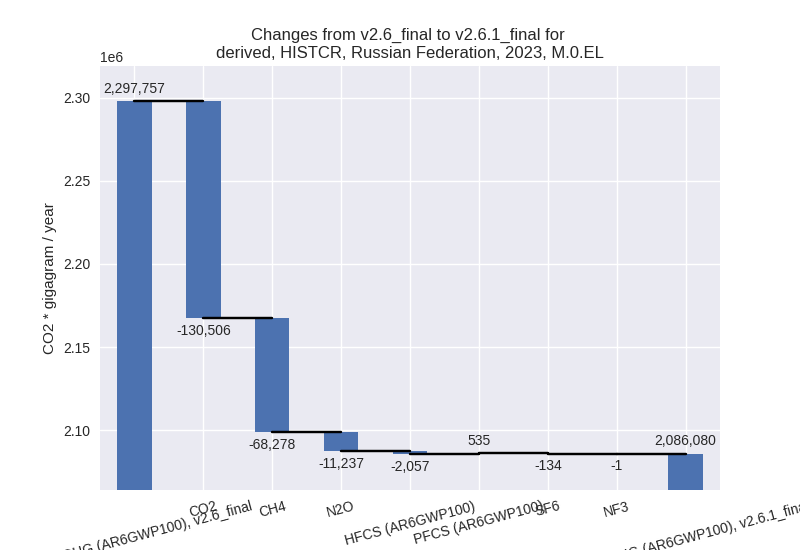
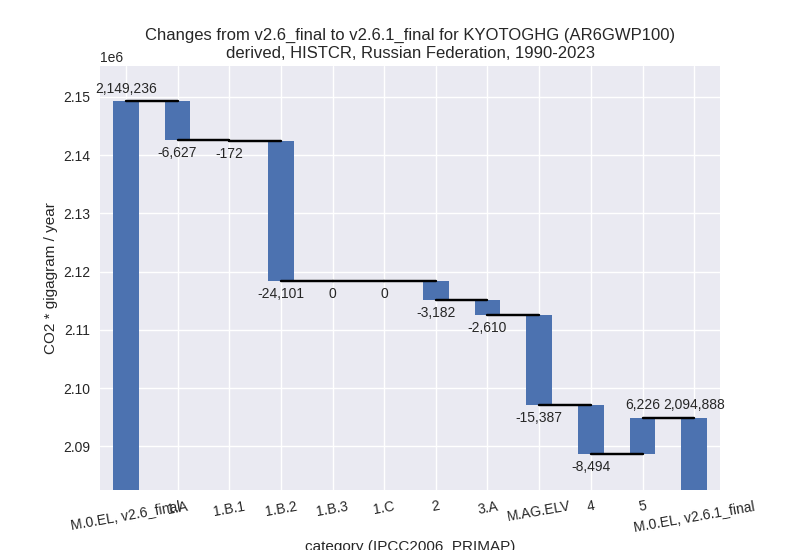
country reported scenario (HISTCR):
Most important changes per time frame
For 2023 the following sector-gas combinations have the highest absolute impact on national total KyotoGHG (AR6GWP100) emissions in 2023 (top 5):
- 1: 1.A, CO2 with -126335.50 Gg CO2 / year (-8.2%)
- 2: 1.B.2, CH4 with -39804.41 Gg CO2 / year (-37.2%)
- 3: 4, CH4 with -23056.44 Gg CO2 / year (-21.2%)
- 4: M.AG.ELV, N2O with -18566.96 Gg CO2 / year (-27.3%)
- 5: 2, CO2 with -7350.35 Gg CO2 / year (-3.5%)
For 1990-2023 the following sector-gas combinations have the highest absolute impact on national total KyotoGHG (AR6GWP100) emissions in 1990-2023 (top 5):
- 1: 1.B.2, CH4 with -24187.88 Gg CO2 / year (-17.5%)
- 2: M.AG.ELV, N2O with -15379.75 Gg CO2 / year (-26.1%)
- 3: 4, CH4 with -8506.04 Gg CO2 / year (-11.6%)
- 4: 1.A, CO2 with -6682.91 Gg CO2 / year (-0.5%)
- 5: 5, N2O with 6225.93 Gg CO2 / year (inf%)
Changes in the main sectors for aggregate KyotoGHG (AR6GWP100) are
- 1: Total sectoral emissions in 2022 are 1612722.50
Gg CO2 / year which is 78.5% of M.0.EL emissions. 2023 Emissions have
changed by -9.2% (-164852.10 Gg CO2
/ year). 1990-2023 Emissions have changed by -1.8% (-30900.53 Gg CO2 / year). For 2023
the changes per gas
are:
The changes come from the following subsectors:- 1.A: Total sectoral emissions in 2022 are
1406599.90 Gg CO2 / year which is 87.2% of category 1 emissions. 2023
Emissions have changed by -8.1%
(-125234.70 Gg CO2 / year). 1990-2023 Emissions have changed by -0.4% (-6627.22 Gg CO2 / year). For 2023
the changes per gas
are:
There is no subsector information available in PRIMAP-hist. - 1.B.1: Total sectoral emissions in 2022 are
76348.52 Gg CO2 / year which is 4.7% of category 1 emissions. 2023
Emissions have changed by -4.0%
(-3148.81 Gg CO2 / year). 1990-2023 Emissions have changed by -0.3% (-171.94 Gg CO2 / year). For 2023
the changes per gas
are:

There is no subsector information available in PRIMAP-hist. - 1.B.2: Total sectoral emissions in 2022 are
129774.04 Gg CO2 / year which is 8.0% of category 1 emissions. 2023
Emissions have changed by -20.9%
(-36468.63 Gg CO2 / year). 1990-2023 Emissions have changed by -13.6% (-24101.36 Gg CO2 / year). For 2023
the changes per gas
are:
For 1990-2023 the changes per gas are: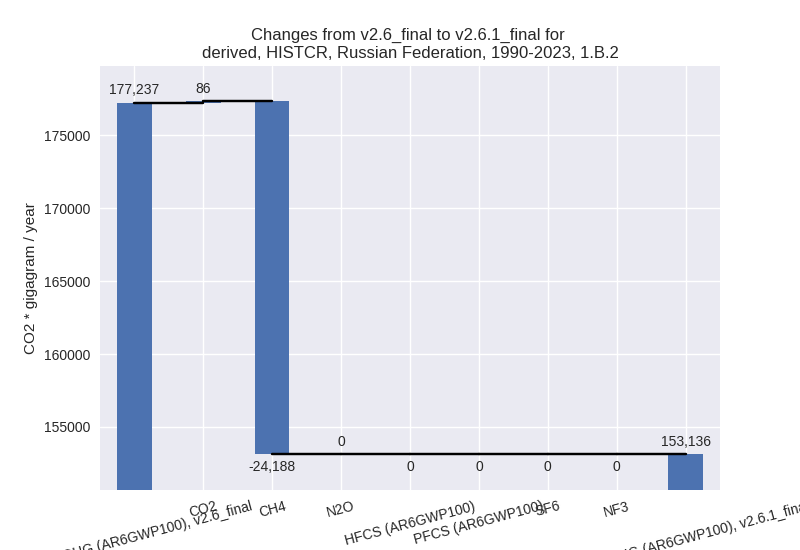
There is no subsector information available in PRIMAP-hist.
- 1.A: Total sectoral emissions in 2022 are
1406599.90 Gg CO2 / year which is 87.2% of category 1 emissions. 2023
Emissions have changed by -8.1%
(-125234.70 Gg CO2 / year). 1990-2023 Emissions have changed by -0.4% (-6627.22 Gg CO2 / year). For 2023
the changes per gas
are:
- 2: Total sectoral emissions in 2022 are 247032.40
Gg CO2 / year which is 12.0% of M.0.EL emissions. 2023 Emissions have
changed by -3.1% (-8095.37 Gg CO2 /
year). 1990-2023 Emissions have changed by -1.5% (-3182.19 Gg CO2 / year). For 2023
the changes per gas
are:
- M.AG: Total sectoral emissions in 2022 are
103694.23 Gg CO2 / year which is 5.0% of M.0.EL emissions. 2023
Emissions have changed by -17.1%
(-21340.32 Gg CO2 / year). 1990-2023 Emissions have changed by -13.3% (-17997.30 Gg CO2 / year). For 2023
the changes per gas
are:
For 1990-2023 the changes per gas are: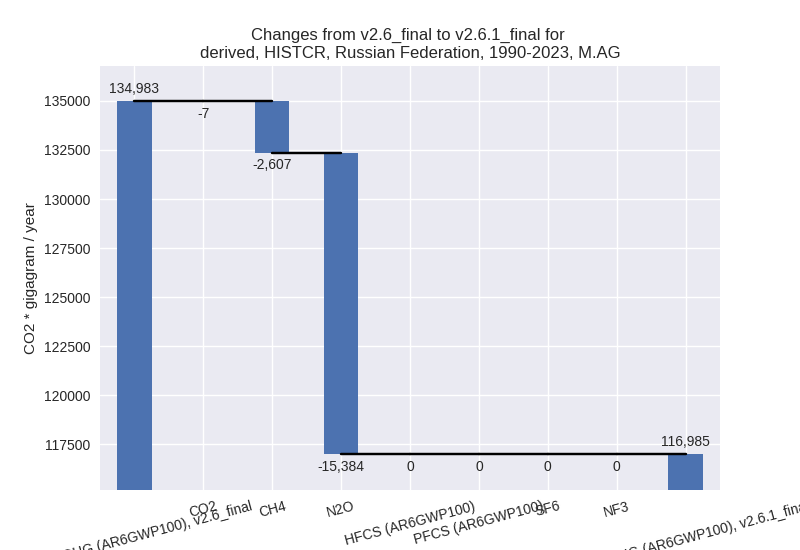
The changes come from the following subsectors:- 3.A: Total sectoral emissions in 2022 are 53422.49
Gg CO2 / year which is 51.5% of category M.AG emissions. 2023 Emissions
have changed by -4.7% (-2617.54 Gg
CO2 / year). 1990-2023 Emissions have changed by -3.6% (-2610.04 Gg CO2 / year). For 2023
the changes per gas
are:
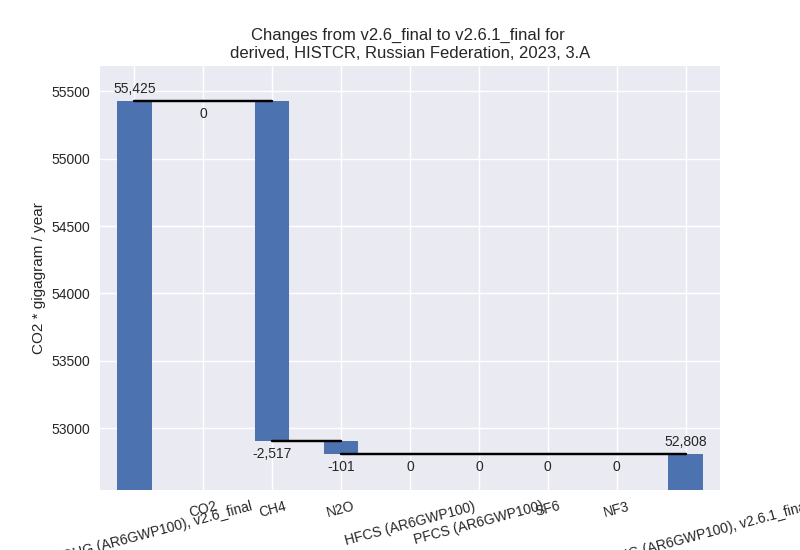
For 1990-2023 the changes per gas are:
There is no subsector information available in PRIMAP-hist. - M.AG.ELV: Total sectoral emissions in 2022 are
50271.74 Gg CO2 / year which is 48.5% of category M.AG emissions. 2023
Emissions have changed by -26.9%
(-18722.78 Gg CO2 / year). 1990-2023 Emissions have changed by -25.0% (-15387.26 Gg CO2 / year). For 2023
the changes per gas
are:
For 1990-2023 the changes per gas are: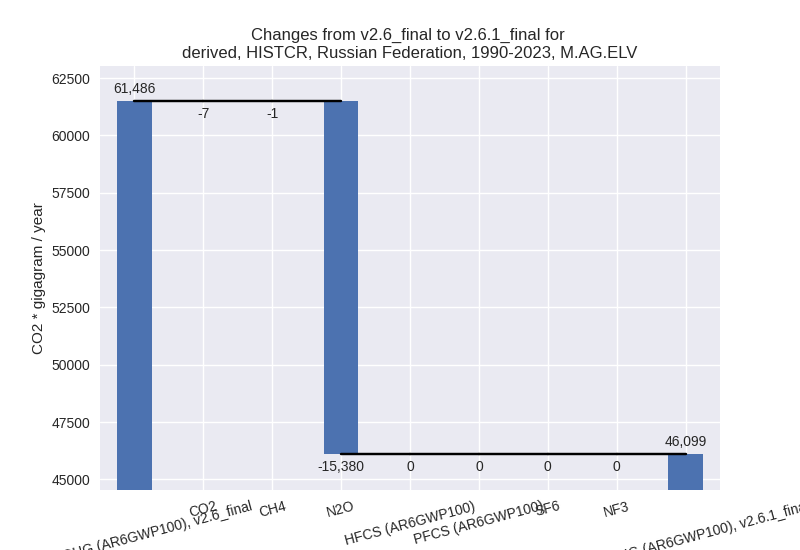
There is no subsector information available in PRIMAP-hist.
- 3.A: Total sectoral emissions in 2022 are 53422.49
Gg CO2 / year which is 51.5% of category M.AG emissions. 2023 Emissions
have changed by -4.7% (-2617.54 Gg
CO2 / year). 1990-2023 Emissions have changed by -3.6% (-2610.04 Gg CO2 / year). For 2023
the changes per gas
are:
- 4: Total sectoral emissions in 2022 are 85623.40 Gg
CO2 / year which is 4.2% of M.0.EL emissions. 2023 Emissions have
changed by -20.5% (-22855.51 Gg CO2
/ year). 1990-2023 Emissions have changed by -11.2% (-8493.79 Gg CO2 / year). For 2023
the changes per gas
are:

For 1990-2023 the changes per gas are:
- 5: Total sectoral emissions in 2022 are 5232.00 Gg
CO2 / year which is 0.3% of M.0.EL emissions. 2023 Emissions have
changed by inf% (5466.21 Gg CO2 /
year). 1990-2023 Emissions have changed by inf% (6225.93 Gg CO2 / year). For 2023 the
changes per gas
are:
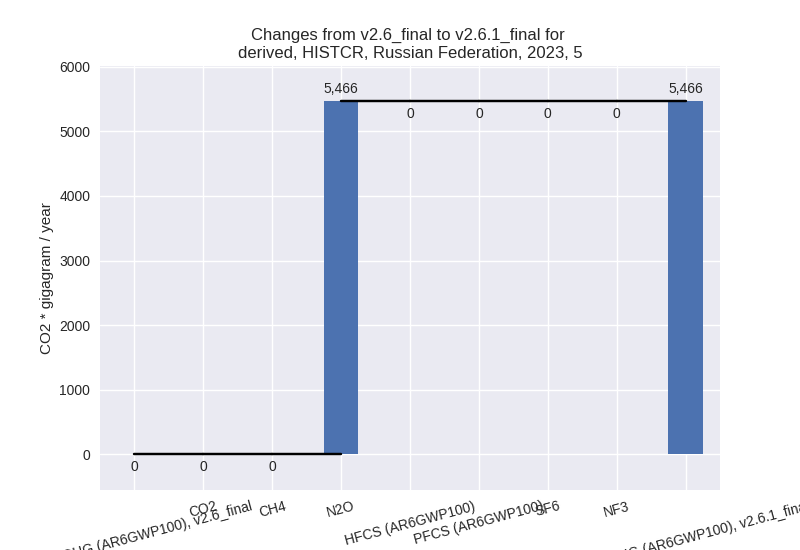
For 1990-2023 the changes per gas are: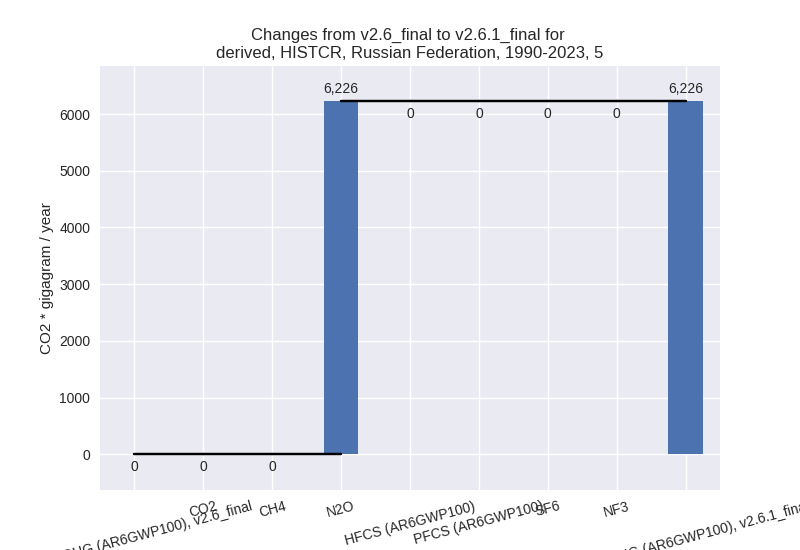
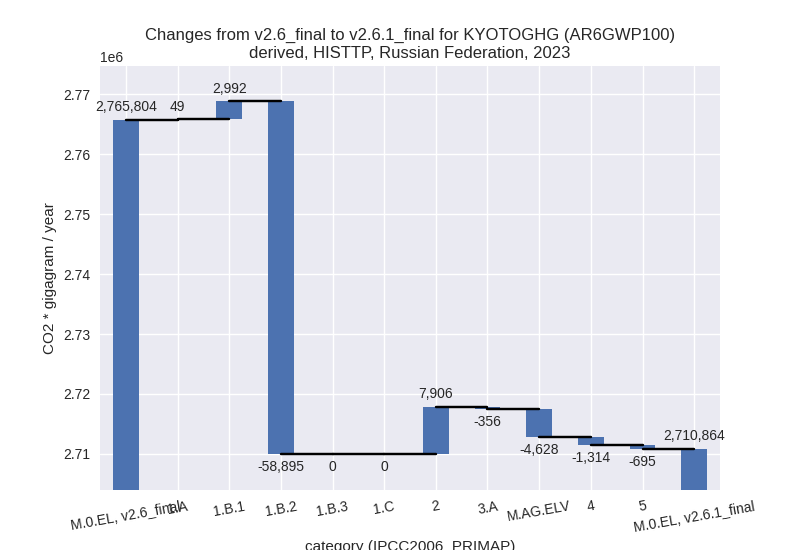
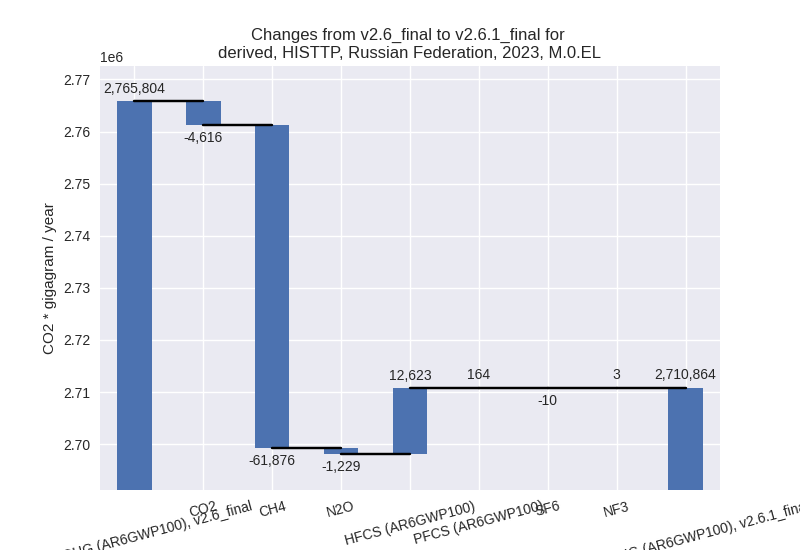
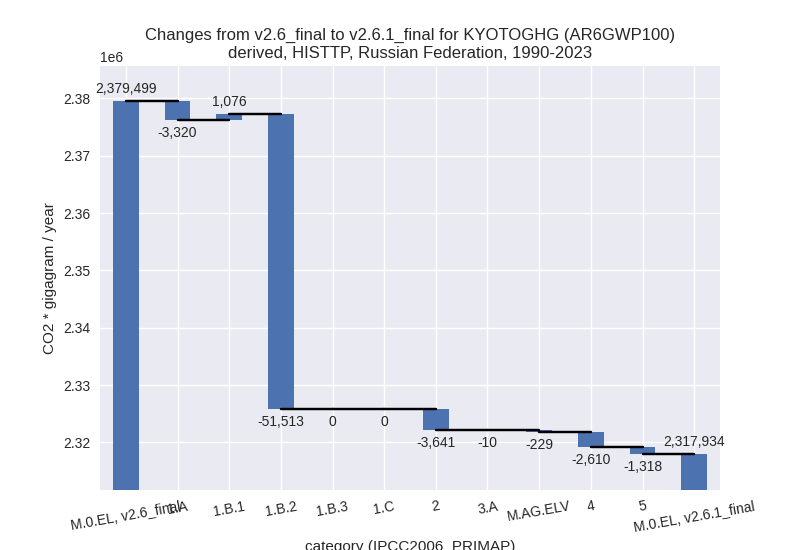
third party scenario (HISTTP):
Most important changes per time frame
For 2023 the following sector-gas combinations have the highest absolute impact on national total KyotoGHG (AR6GWP100) emissions in 2023 (top 5):
- 1: 1.B.2, CH4 with -58916.05 Gg CO2 / year (-28.9%)
- 2: 2, HFCS (AR6GWP100) with 12622.66 Gg CO2 / year (34.2%)
- 3: 2, CO2 with -4476.41 Gg CO2 / year (-4.4%)
- 4: M.AG.ELV, CO2 with -1946.75 Gg CO2 / year (-25.1%)
- 5: 1.B.1, CO2 with 1807.32 Gg CO2 / year (3.5%)
For 1990-2023 the following sector-gas combinations have the highest absolute impact on national total KyotoGHG (AR6GWP100) emissions in 1990-2023 (top 5):
- 1: 1.B.2, CH4 with -52197.95 Gg CO2 / year (-30.8%)
- 2: 2, HFCS (AR6GWP100) with -3506.82 Gg CO2 / year (-12.3%)
- 3: 1.A, CH4 with -3388.08 Gg CO2 / year (-38.7%)
- 4: 4, CH4 with -2614.20 Gg CO2 / year (-2.9%)
- 5: 5, N2O with -1318.27 Gg CO2 / year (-17.5%)
Changes in the main sectors for aggregate KyotoGHG (AR6GWP100) are
- 1: Total sectoral emissions in 2022 are 2250784.60
Gg CO2 / year which is 84.2% of M.0.EL emissions. 2023 Emissions have
changed by -2.4% (-55853.60 Gg CO2 /
year). 1990-2023 Emissions have changed by -2.7% (-53756.37 Gg CO2 / year). For 2023
the changes per gas
are:
For 1990-2023 the changes per gas are: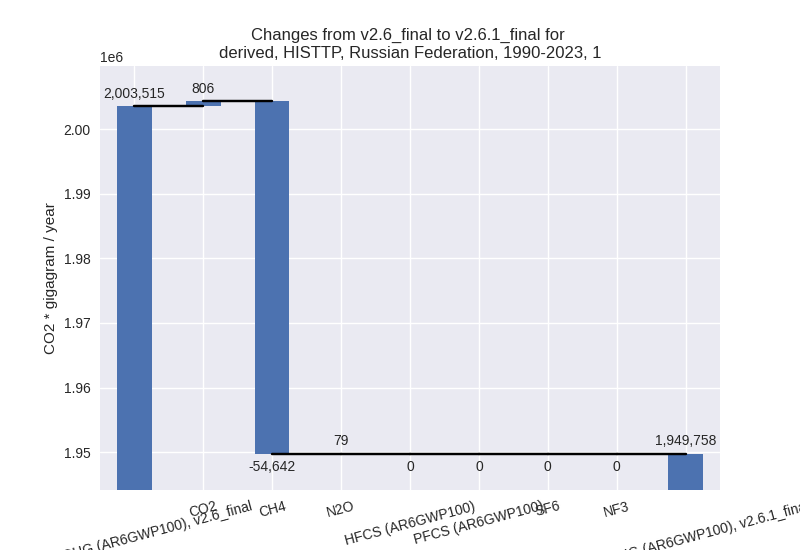
The changes come from the following subsectors:- 1.A: Total sectoral emissions in 2022 are 1895170.50 Gg CO2 / year which is 84.2% of category 1 emissions. 2023 Emissions have changed by 0.0% (48.70 Gg CO2 / year). 1990-2023 Emissions have changed by -0.2% (-3320.09 Gg CO2 / year).
- 1.B.1: Total sectoral emissions in 2022 are 157783.81 Gg CO2 / year which is 7.0% of category 1 emissions. 2023 Emissions have changed by 1.9% (2992.50 Gg CO2 / year). 1990-2023 Emissions have changed by 1.1% (1076.30 Gg CO2 / year).
- 1.B.2: Total sectoral emissions in 2022 are
197830.28 Gg CO2 / year which is 8.8% of category 1 emissions. 2023
Emissions have changed by -22.4%
(-58894.75 Gg CO2 / year). 1990-2023 Emissions have changed by -26.2% (-51512.58 Gg CO2 / year). For 2023
the changes per gas
are:

For 1990-2023 the changes per gas are:
There is no subsector information available in PRIMAP-hist.
- 2: Total sectoral emissions in 2022 are 177174.33
Gg CO2 / year which is 6.6% of M.0.EL emissions. 2023 Emissions have
changed by 4.5% (7905.85 Gg CO2 /
year). 1990-2023 Emissions have changed by -2.5% (-3641.25 Gg CO2 / year). For 2023
the changes per gas
are:
For 1990-2023 the changes per gas are: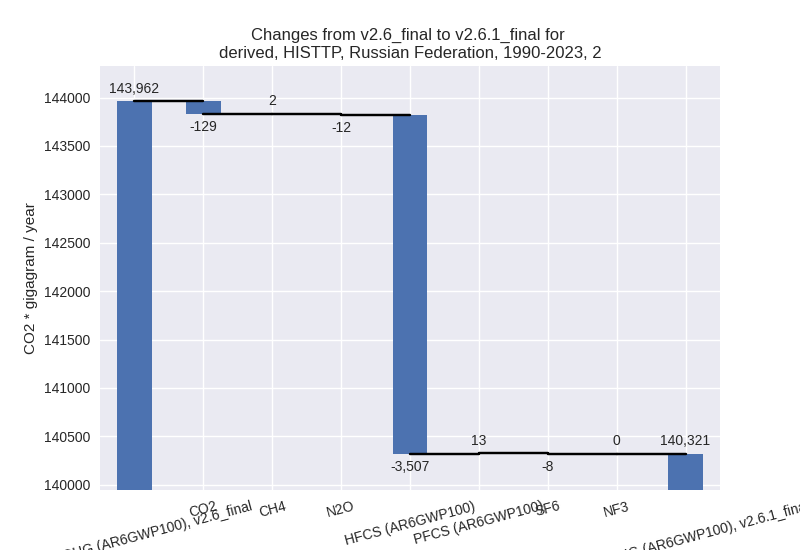
- M.AG: Total sectoral emissions in 2022 are
109759.87 Gg CO2 / year which is 4.1% of M.0.EL emissions. 2023
Emissions have changed by -4.3%
(-4983.91 Gg CO2 / year). 1990-2023 Emissions have changed by -0.2% (-239.06 Gg CO2 / year). For 2023
the changes per gas
are:
The changes come from the following subsectors:- 3.A: Total sectoral emissions in 2022 are 54340.05 Gg CO2 / year which is 49.5% of category M.AG emissions. 2023 Emissions have changed by -0.7% (-355.74 Gg CO2 / year). 1990-2023 Emissions have changed by -0.0% (-10.28 Gg CO2 / year).
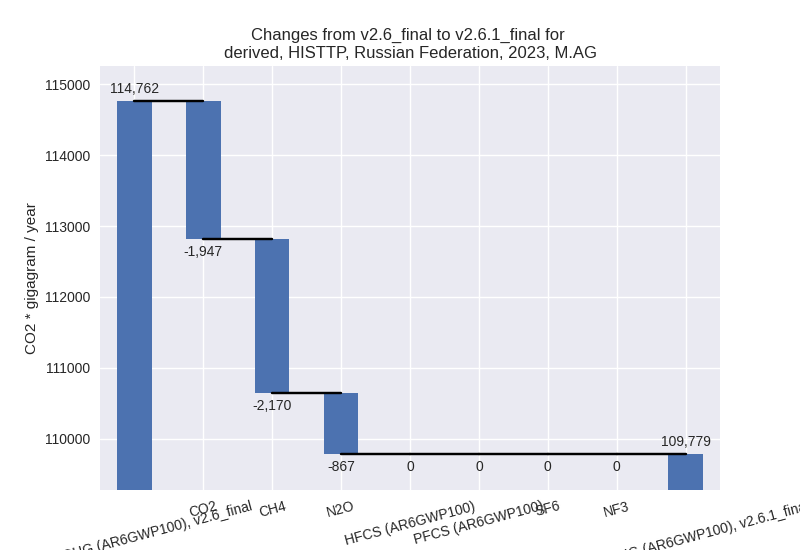
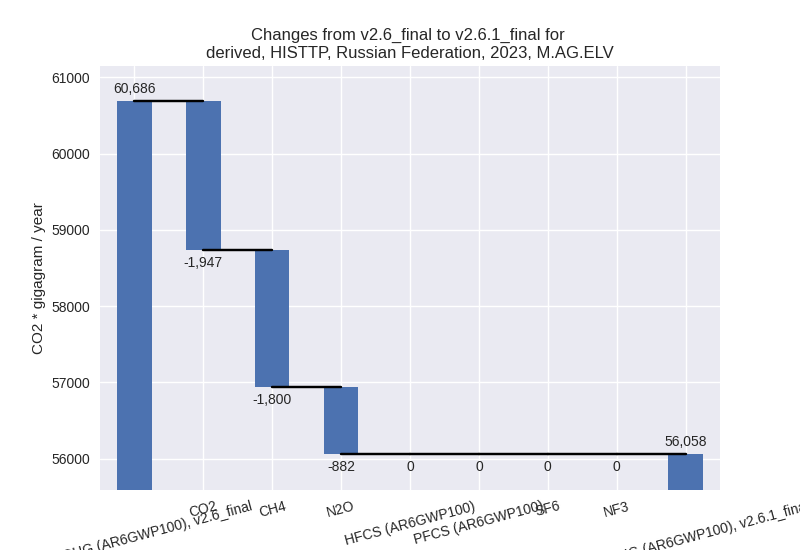
- M.AG.ELV: Total sectoral emissions in 2022 are
55419.82 Gg CO2 / year which is 50.5% of category M.AG emissions. 2023
Emissions have changed by -7.6%
(-4628.17 Gg CO2 / year). 1990-2023 Emissions have changed by -0.5% (-228.77 Gg CO2 / year). For 2023
the changes per gas
are:
There is no subsector information available in PRIMAP-hist.
- 4: Total sectoral emissions in 2022 are 130843.36
Gg CO2 / year which is 4.9% of M.0.EL emissions. 2023 Emissions have
changed by -1.0% (-1313.75 Gg CO2 /
year). 1990-2023 Emissions have changed by -2.8% (-2609.83 Gg CO2 / year). For
1990-2023 the changes per gas
are:

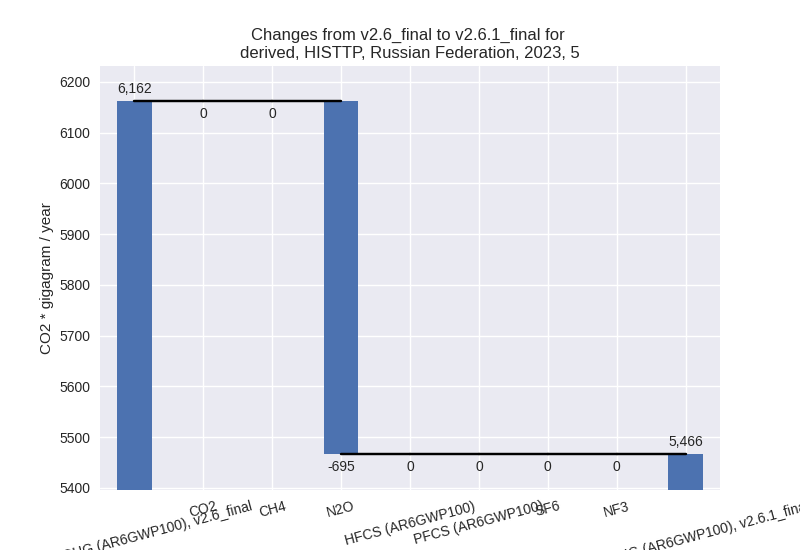
- 5: Total sectoral emissions in 2022 are 5232.00 Gg
CO2 / year which is 0.2% of M.0.EL emissions. 2023 Emissions have
changed by -11.3% (-695.45 Gg CO2 /
year). 1990-2023 Emissions have changed by -17.5% (-1318.27 Gg CO2 / year). For 2023
the changes per gas
are:
For 1990-2023 the changes per gas are: