Changes in PRIMAP-hist v2.6.1_final compared to v2.6_final for Senegal
2025-03-19
Johannes Gütschow
Change analysis for Senegal for PRIMAP-hist v2.6.1_final compared to v2.6_final
Overview over emissions by sector and gas
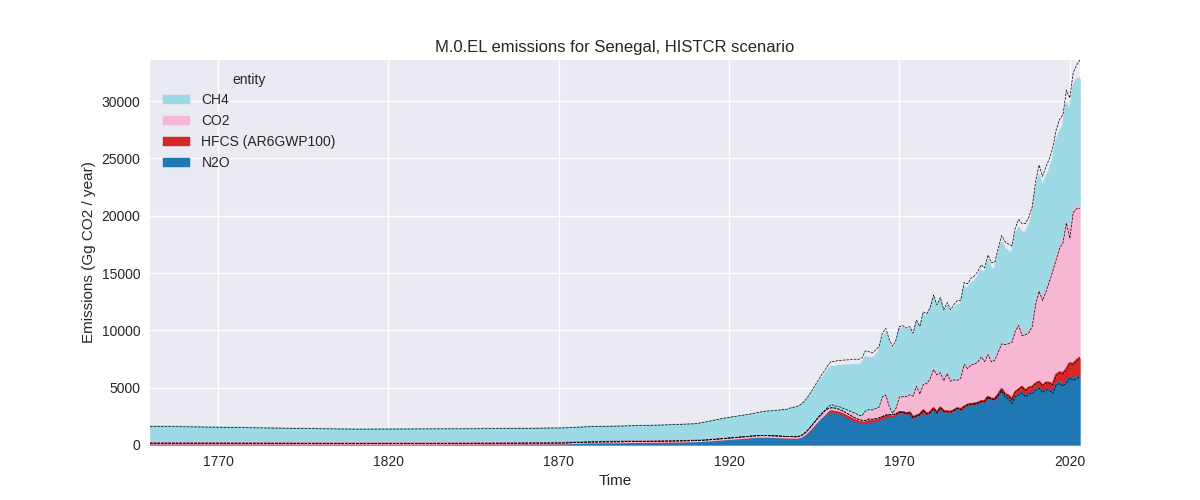
The following figures show the aggregate national total emissions excluding LULUCF AR6GWP100 for the country reported priority scenario. The dotted linesshow the v2.6_final data.
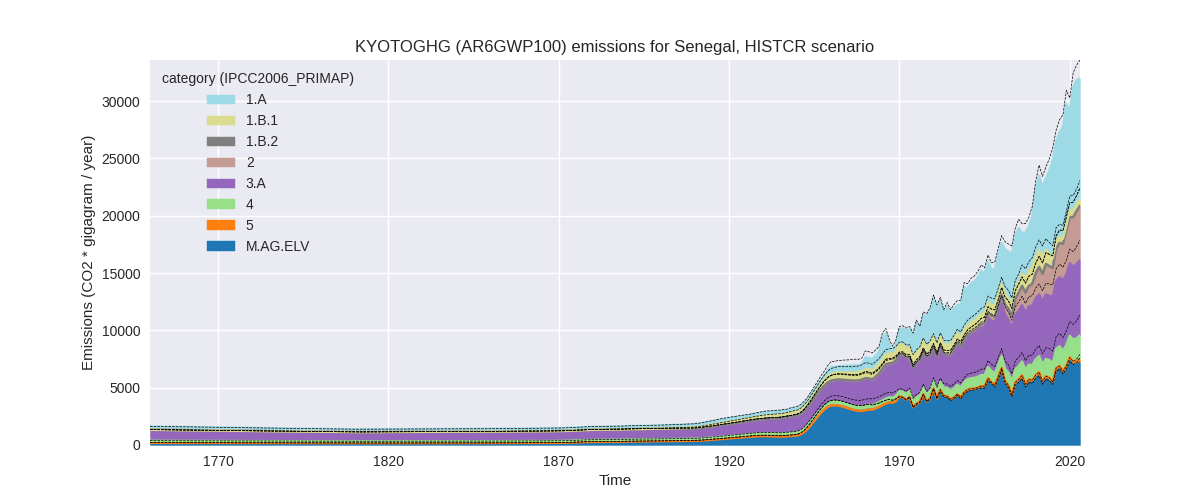
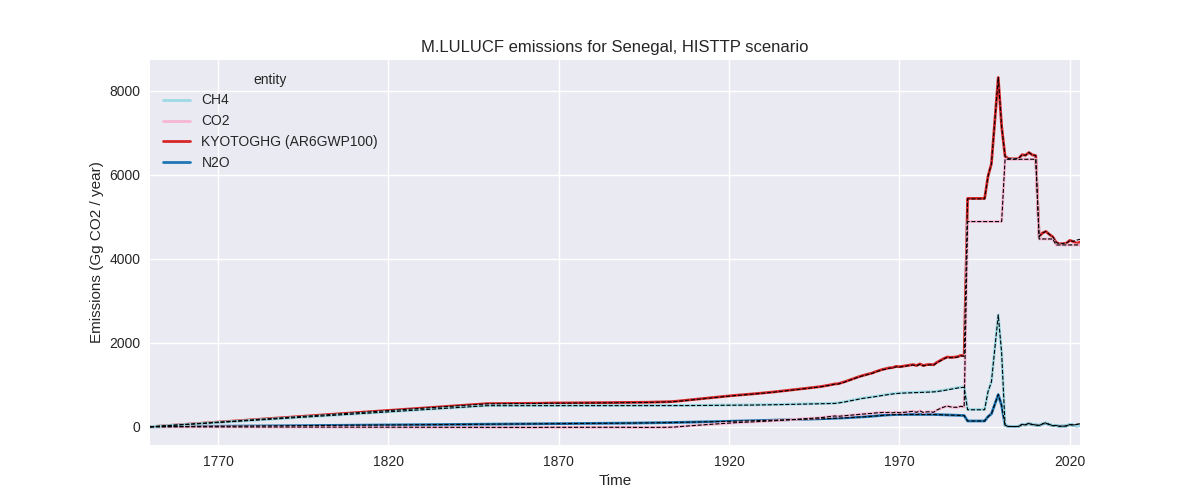
The following figures show the aggregate national total emissions excluding LULUCF AR6GWP100 for the third party priority scenario. The dotted linesshow the v2.6_final data.


Overview over changes
In the country reported priority scenario we have the following changes for aggregate Kyoto GHG and national total emissions excluding LULUCF (M.0.EL):
- Emissions in 2023 have changed by -4.8%% (-1611.16 Gg CO2 / year)
- Emissions in 1990-2023 have changed by -3.9%% (-841.82 Gg CO2 / year)
In the third party priority scenario we have the following changes for aggregate Kyoto GHG and national total emissions excluding LULUCF (M.0.EL):
- Emissions in 2023 have changed by -4.8%% (-1611.16 Gg CO2 / year)
- Emissions in 1990-2023 have changed by -3.9%% (-841.82 Gg CO2 / year)
Most important changes per scenario and time frame
In the country reported priority scenario the following sector-gas combinations have the highest absolute impact on national total KyotoGHG (AR6GWP100) emissions in 2023 (top 5):
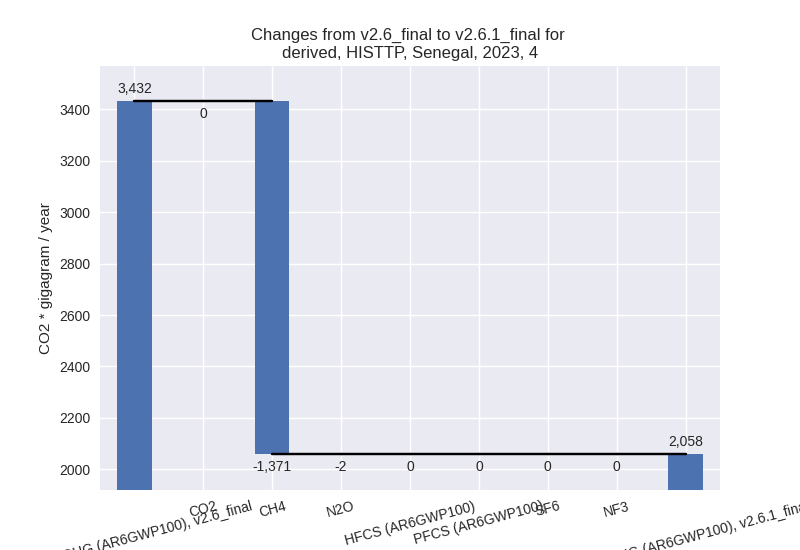
- 1: 4, CH4 with -1371.08 Gg CO2 / year (-43.9%)
- 2: M.AG.ELV, CH4 with -289.55 Gg CO2 / year (-12.3%)
- 3: 2, CO2 with 204.02 Gg CO2 / year (6.9%)
- 4: 1.B.1, CH4 with -59.37 Gg CO2 / year (-9.5%)
- 5: M.AG.ELV, CO2 with -56.27 Gg CO2 / year (-90.0%)
In the country reported priority scenario the following sector-gas combinations have the highest absolute impact on national total KyotoGHG (AR6GWP100) emissions in 1990-2023 (top 5):
- 1: 4, CH4 with -837.96 Gg CO2 / year (-42.2%)
- 2: M.AG.ELV, CH4 with -15.35 Gg CO2 / year (-0.9%)
- 3: 2, CO2 with 12.30 Gg CO2 / year (0.9%)
- 4: 1.A, N2O with 9.67 Gg CO2 / year (15.1%)
- 5: 1.B.2, CH4 with -6.11 Gg CO2 / year (-39.5%)
In the third party priority scenario the following sector-gas combinations have the highest absolute impact on national total KyotoGHG (AR6GWP100) emissions in 2023 (top 5):
- 1: 4, CH4 with -1371.08 Gg CO2 / year (-43.9%)
- 2: M.AG.ELV, CH4 with -289.55 Gg CO2 / year (-12.3%)
- 3: 2, CO2 with 204.02 Gg CO2 / year (6.9%)
- 4: 1.B.1, CH4 with -59.37 Gg CO2 / year (-9.5%)
- 5: M.AG.ELV, CO2 with -56.27 Gg CO2 / year (-90.0%)
In the third party priority scenario the following sector-gas combinations have the highest absolute impact on national total KyotoGHG (AR6GWP100) emissions in 1990-2023 (top 5):
- 1: 4, CH4 with -837.96 Gg CO2 / year (-42.2%)
- 2: M.AG.ELV, CH4 with -15.35 Gg CO2 / year (-0.9%)
- 3: 2, CO2 with 12.30 Gg CO2 / year (0.9%)
- 4: 1.A, N2O with 9.67 Gg CO2 / year (15.1%)
- 5: 1.B.2, CH4 with -6.11 Gg CO2 / year (-39.5%)
Notes on data changes
Here we list notes explaining important emissions changes for the country.
- There is no usable country reported data for Cameroon, thus the CR and TP time-series are identical.
- Changes come directly from FAO and EDGAR data and are limited to the latest years with the exception of the waste sector.
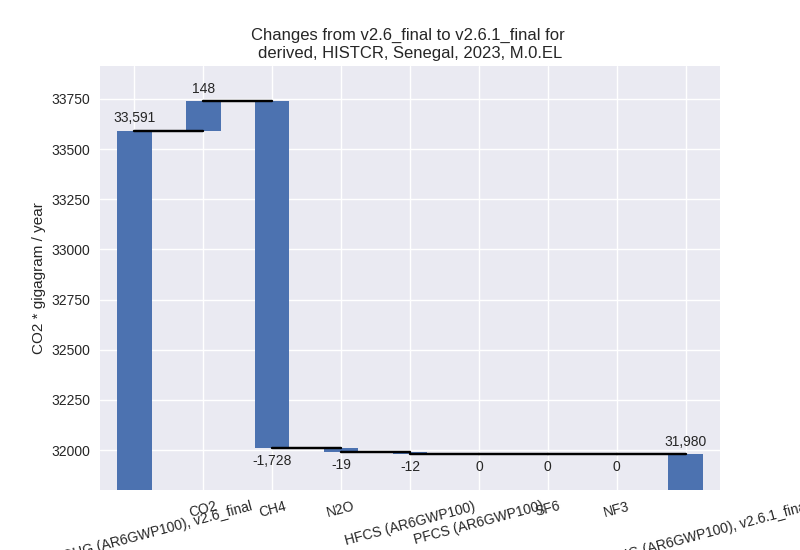
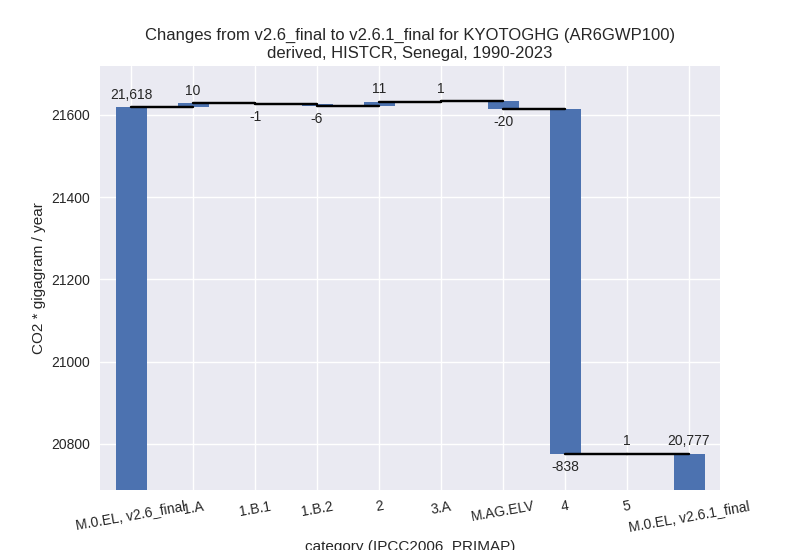
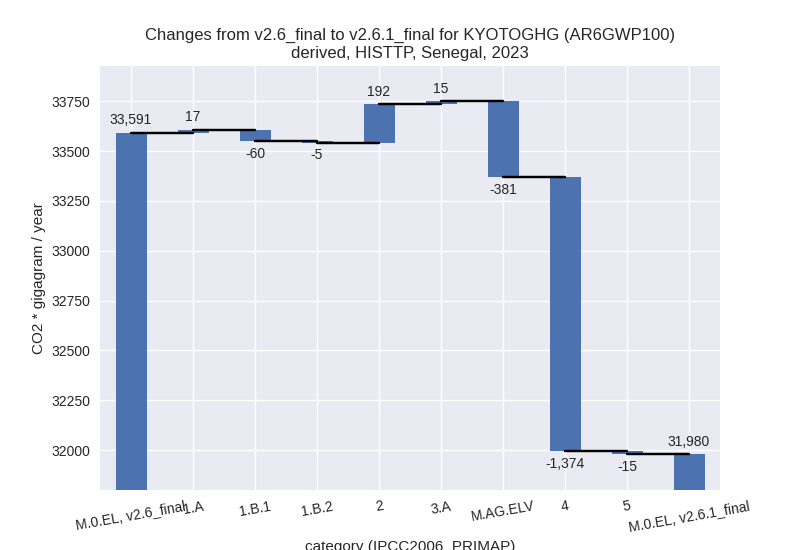
Changes by sector and gas
For each scenario and time frame the changes are displayed for all individual sectors and all individual gases. In the sector plot we use aggregate Kyoto GHGs in AR6GWP100. In the gas plot we usenational total emissions without LULUCF.
country reported scenario
2023

1990-2023

third party scenario
2023

1990-2023


Detailed changes for the scenarios:
country reported scenario (HISTCR):
Most important changes per time frame
For 2023 the following sector-gas combinations have the highest absolute impact on national total KyotoGHG (AR6GWP100) emissions in 2023 (top 5):
- 1: 4, CH4 with -1371.08 Gg CO2 / year (-43.9%)
- 2: M.AG.ELV, CH4 with -289.55 Gg CO2 / year (-12.3%)
- 3: 2, CO2 with 204.02 Gg CO2 / year (6.9%)
- 4: 1.B.1, CH4 with -59.37 Gg CO2 / year (-9.5%)
- 5: M.AG.ELV, CO2 with -56.27 Gg CO2 / year (-90.0%)
For 1990-2023 the following sector-gas combinations have the highest absolute impact on national total KyotoGHG (AR6GWP100) emissions in 1990-2023 (top 5):
- 1: 4, CH4 with -837.96 Gg CO2 / year (-42.2%)
- 2: M.AG.ELV, CH4 with -15.35 Gg CO2 / year (-0.9%)
- 3: 2, CO2 with 12.30 Gg CO2 / year (0.9%)
- 4: 1.A, N2O with 9.67 Gg CO2 / year (15.1%)
- 5: 1.B.2, CH4 with -6.11 Gg CO2 / year (-39.5%)
Changes in the main sectors for aggregate KyotoGHG (AR6GWP100) are
- 1: Total sectoral emissions in 2022 are 11431.57 Gg CO2 / year which is 35.9% of M.0.EL emissions. 2023 Emissions have changed by -0.4% (-48.23 Gg CO2 / year). 1990-2023 Emissions have changed by 0.0% (2.57 Gg CO2 / year).
- 2: Total sectoral emissions in 2022 are 4625.22 Gg
CO2 / year which is 14.5% of M.0.EL emissions. 2023 Emissions have
changed by 4.2% (192.28 Gg CO2 /
year). 1990-2023 Emissions have changed by 0.6% (11.47 Gg CO2 / year). For 2023 the
changes per gas
are:

- M.AG: Total sectoral emissions in 2022 are 13472.99
Gg CO2 / year which is 42.3% of M.0.EL emissions. 2023 Emissions have
changed by -2.6% (-366.59 Gg CO2 /
year). 1990-2023 Emissions have changed by -0.2% (-18.92 Gg CO2 / year). For 2023 the
changes per gas
are:
The changes come from the following subsectors:- 3.A: Total sectoral emissions in 2022 are 6472.44 Gg CO2 / year which is 48.0% of category M.AG emissions. 2023 Emissions have changed by 0.2% (14.51 Gg CO2 / year). 1990-2023 Emissions have changed by 0.0% (0.67 Gg CO2 / year).
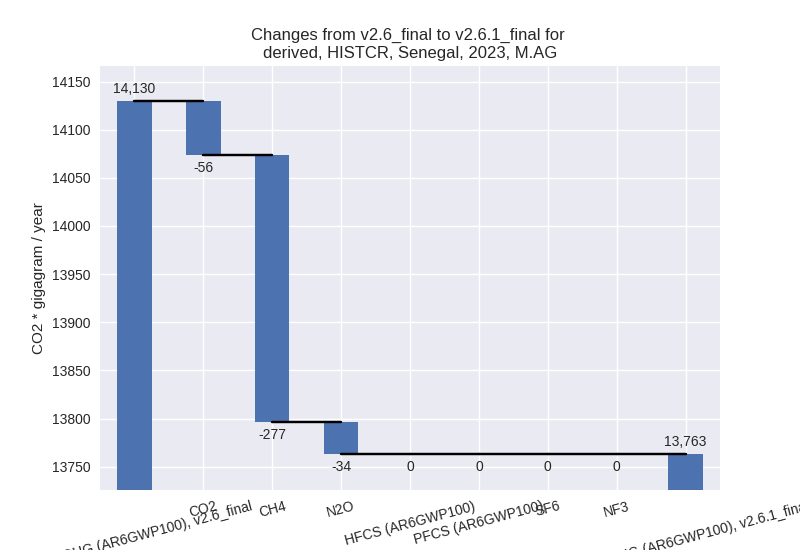
- M.AG.ELV: Total sectoral emissions in 2022 are
7000.55 Gg CO2 / year which is 52.0% of category M.AG emissions. 2023
Emissions have changed by -5.0%
(-381.11 Gg CO2 / year). 1990-2023 Emissions have changed by -0.3% (-19.59 Gg CO2 / year). For 2023 the
changes per gas
are:
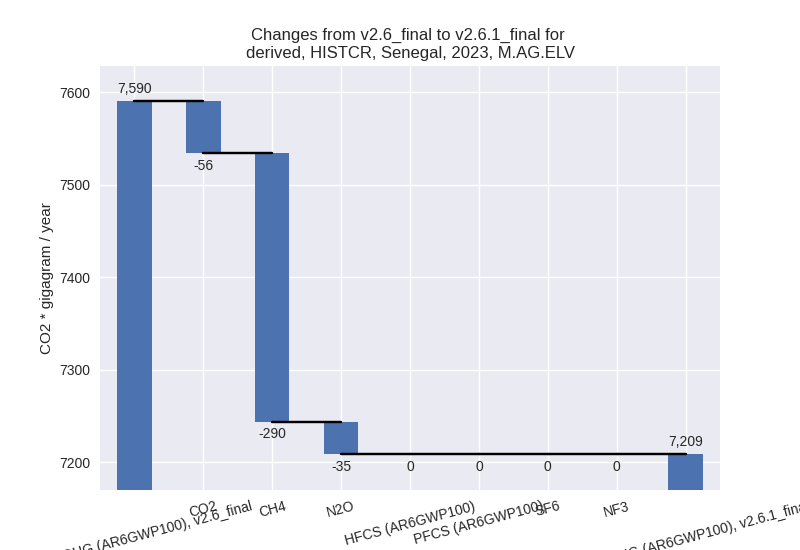
There is no subsector information available in PRIMAP-hist.
- 4: Total sectoral emissions in 2022 are 2000.38 Gg
CO2 / year which is 6.3% of M.0.EL emissions. 2023 Emissions have
changed by -40.0% (-1373.56 Gg CO2 /
year). 1990-2023 Emissions have changed by -38.8% (-838.41 Gg CO2 / year). For 2023
the changes per gas
are:

For 1990-2023 the changes per gas are:
- 5: Total sectoral emissions in 2022 are 296.28 Gg
CO2 / year which is 0.9% of M.0.EL emissions. 2023 Emissions have
changed by -4.7% (-15.06 Gg CO2 /
year). 1990-2023 Emissions have changed by 0.6% (1.47 Gg CO2 / year). For 2023 the
changes per gas
are:

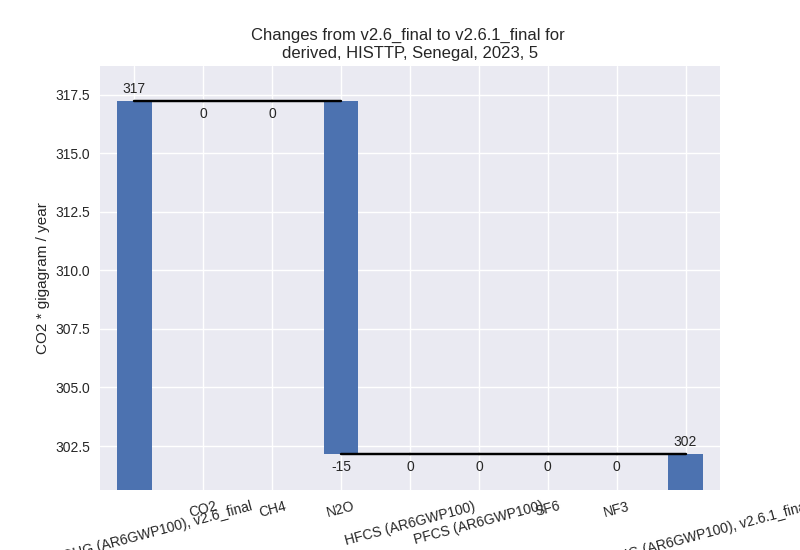
third party scenario (HISTTP):
Most important changes per time frame
For 2023 the following sector-gas combinations have the highest absolute impact on national total KyotoGHG (AR6GWP100) emissions in 2023 (top 5):
- 1: 4, CH4 with -1371.08 Gg CO2 / year (-43.9%)
- 2: M.AG.ELV, CH4 with -289.55 Gg CO2 / year (-12.3%)
- 3: 2, CO2 with 204.02 Gg CO2 / year (6.9%)
- 4: 1.B.1, CH4 with -59.37 Gg CO2 / year (-9.5%)
- 5: M.AG.ELV, CO2 with -56.27 Gg CO2 / year (-90.0%)
For 1990-2023 the following sector-gas combinations have the highest absolute impact on national total KyotoGHG (AR6GWP100) emissions in 1990-2023 (top 5):
- 1: 4, CH4 with -837.96 Gg CO2 / year (-42.2%)
- 2: M.AG.ELV, CH4 with -15.35 Gg CO2 / year (-0.9%)
- 3: 2, CO2 with 12.30 Gg CO2 / year (0.9%)
- 4: 1.A, N2O with 9.67 Gg CO2 / year (15.1%)
- 5: 1.B.2, CH4 with -6.11 Gg CO2 / year (-39.5%)
Changes in the main sectors for aggregate KyotoGHG (AR6GWP100) are
- 1: Total sectoral emissions in 2022 are 11431.57 Gg CO2 / year which is 35.9% of M.0.EL emissions. 2023 Emissions have changed by -0.4% (-48.23 Gg CO2 / year). 1990-2023 Emissions have changed by 0.0% (2.57 Gg CO2 / year).
- 2: Total sectoral emissions in 2022 are 4625.22 Gg
CO2 / year which is 14.5% of M.0.EL emissions. 2023 Emissions have
changed by 4.2% (192.28 Gg CO2 /
year). 1990-2023 Emissions have changed by 0.6% (11.47 Gg CO2 / year). For 2023 the
changes per gas
are:
- M.AG: Total sectoral emissions in 2022 are 13472.99
Gg CO2 / year which is 42.3% of M.0.EL emissions. 2023 Emissions have
changed by -2.6% (-366.59 Gg CO2 /
year). 1990-2023 Emissions have changed by -0.2% (-18.92 Gg CO2 / year). For 2023 the
changes per gas
are:

The changes come from the following subsectors:- 3.A: Total sectoral emissions in 2022 are 6472.44 Gg CO2 / year which is 48.0% of category M.AG emissions. 2023 Emissions have changed by 0.2% (14.51 Gg CO2 / year). 1990-2023 Emissions have changed by 0.0% (0.67 Gg CO2 / year).
- M.AG.ELV: Total sectoral emissions in 2022 are
7000.55 Gg CO2 / year which is 52.0% of category M.AG emissions. 2023
Emissions have changed by -5.0%
(-381.11 Gg CO2 / year). 1990-2023 Emissions have changed by -0.3% (-19.59 Gg CO2 / year). For 2023 the
changes per gas
are:

There is no subsector information available in PRIMAP-hist.
- 4: Total sectoral emissions in 2022 are 2000.38 Gg
CO2 / year which is 6.3% of M.0.EL emissions. 2023 Emissions have
changed by -40.0% (-1373.56 Gg CO2 /
year). 1990-2023 Emissions have changed by -38.8% (-838.41 Gg CO2 / year). For 2023
the changes per gas
are:
For 1990-2023 the changes per gas are:
- 5: Total sectoral emissions in 2022 are 296.28 Gg
CO2 / year which is 0.9% of M.0.EL emissions. 2023 Emissions have
changed by -4.7% (-15.06 Gg CO2 /
year). 1990-2023 Emissions have changed by 0.6% (1.47 Gg CO2 / year). For 2023 the
changes per gas
are: