Changes in PRIMAP-hist v2.6.1_final compared to v2.6_final for Singapore
2025-03-19
Johannes Gütschow
Change analysis for Singapore for PRIMAP-hist v2.6.1_final compared to v2.6_final
Overview over emissions by sector and gas
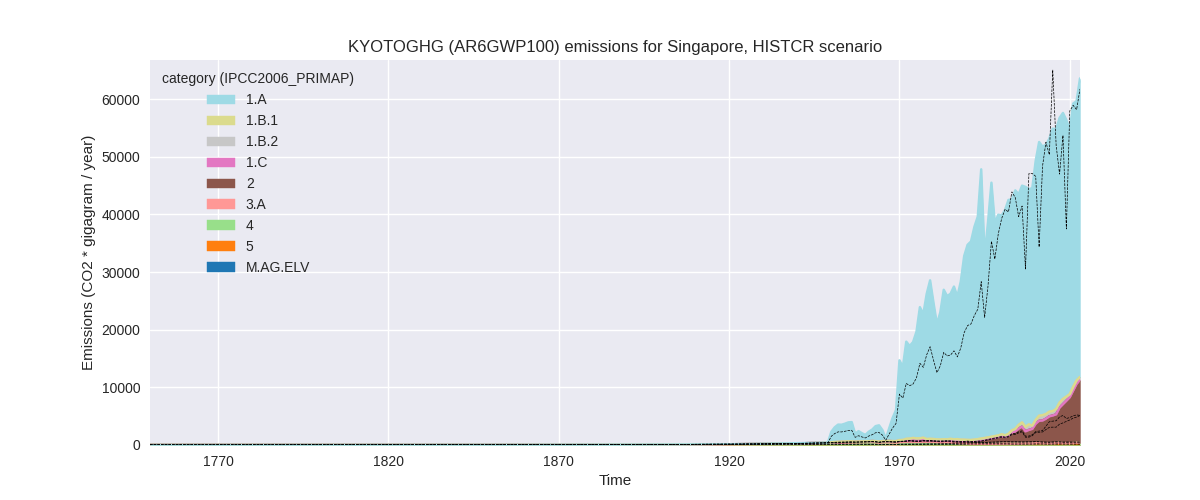
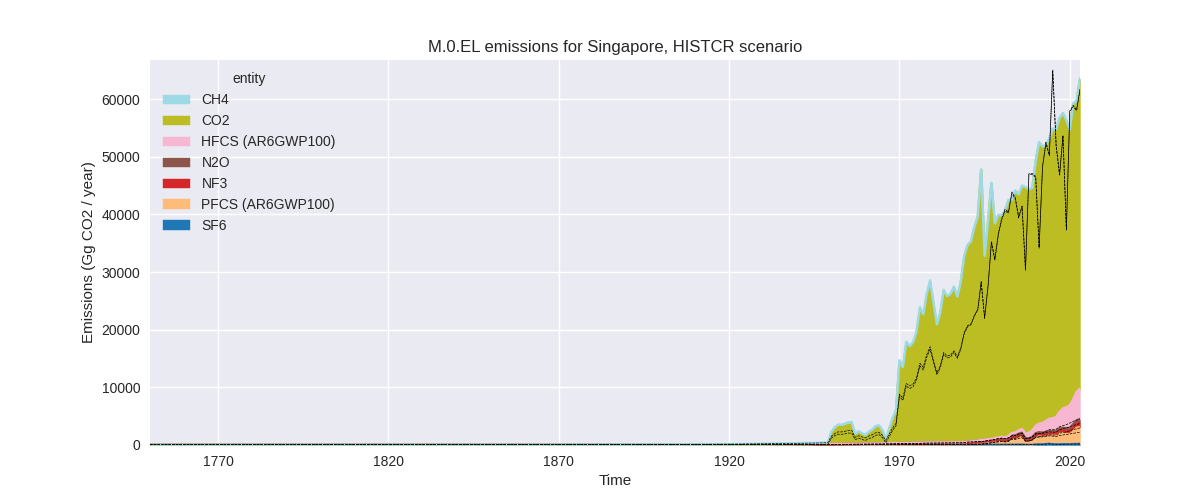
The following figures show the aggregate national total emissions excluding LULUCF AR6GWP100 for the country reported priority scenario. The dotted linesshow the v2.6_final data.
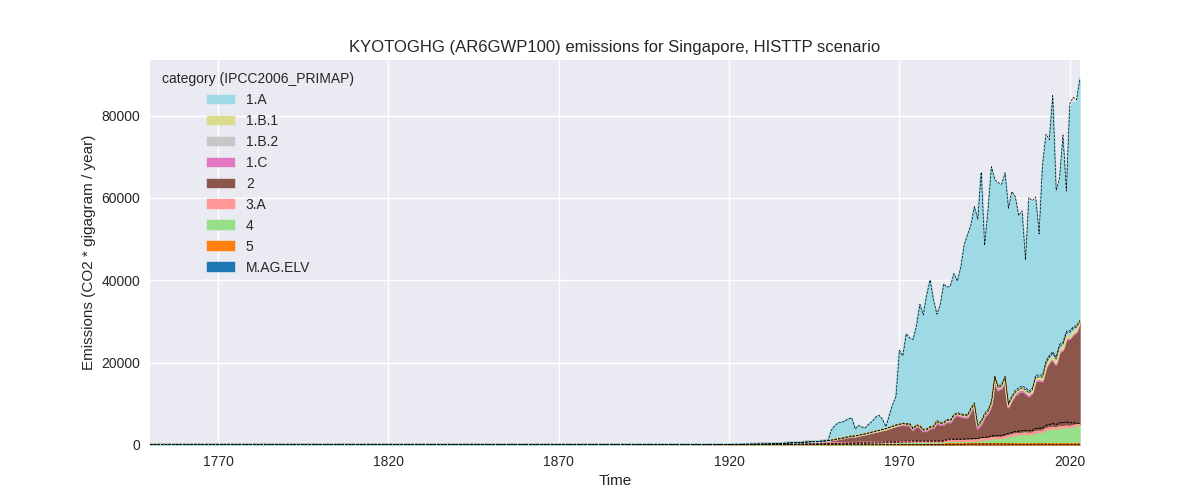
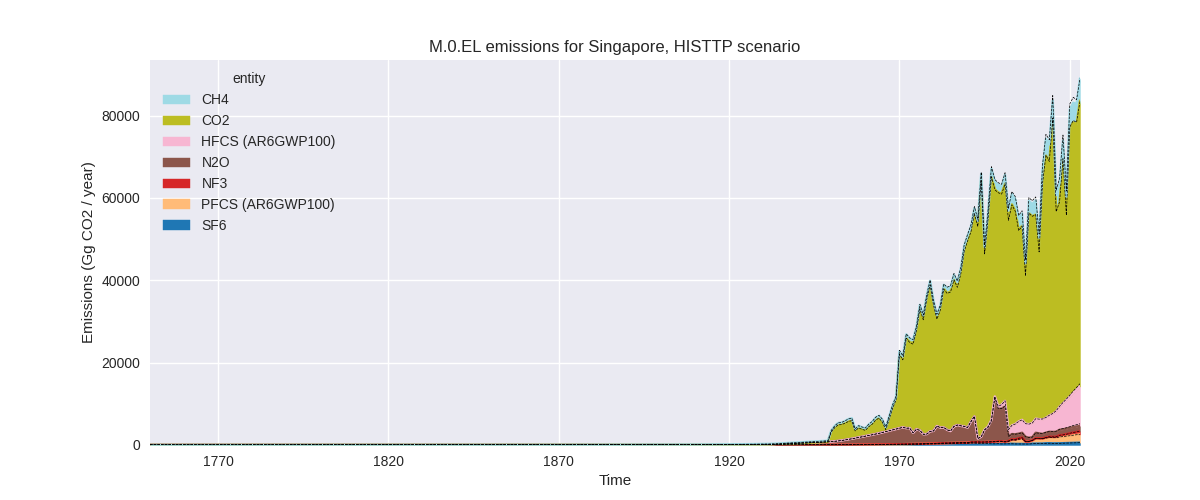
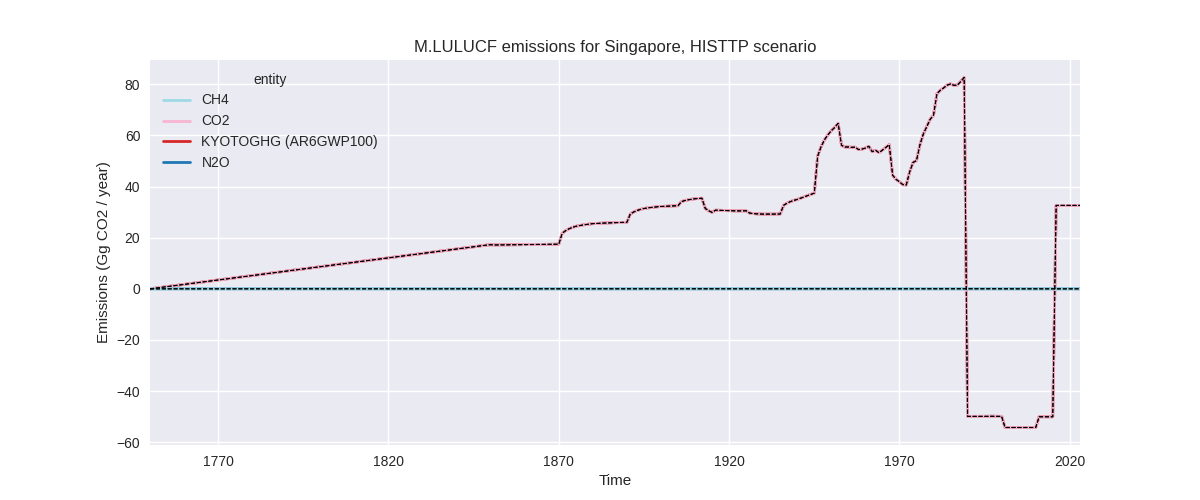
The following figures show the aggregate national total emissions excluding LULUCF AR6GWP100 for the third party priority scenario. The dotted linesshow the v2.6_final data.
Overview over changes
In the country reported priority scenario we have the following changes for aggregate Kyoto GHG and national total emissions excluding LULUCF (M.0.EL):
- Emissions in 2023 have changed by 3.0%% (1845.47 Gg CO2 / year)
- Emissions in 1990-2023 have changed by 13.6%% (5640.53 Gg CO2 / year)
In the third party priority scenario we have the following changes for aggregate Kyoto GHG and national total emissions excluding LULUCF (M.0.EL):
- Emissions in 2023 have changed by 0.1%% (69.21 Gg CO2 / year)
- Emissions in 1990-2023 have changed by -1.2%% (-756.44 Gg CO2 / year)
Most important changes per scenario and time frame
In the country reported priority scenario the following sector-gas combinations have the highest absolute impact on national total KyotoGHG (AR6GWP100) emissions in 2023 (top 5):
- 1: 1.A, CO2 with -4846.44 Gg CO2 / year (-8.6%)
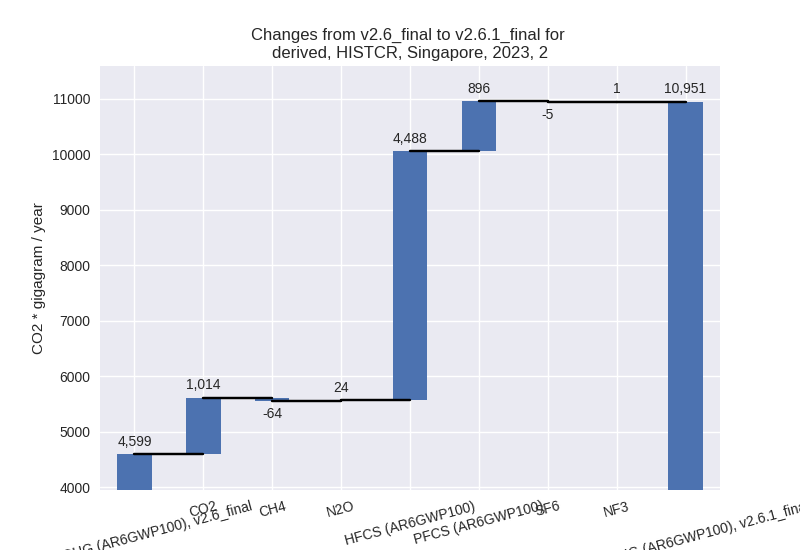
- 2: 2, HFCS (AR6GWP100) with 4487.51 Gg CO2 / year (557.7%)
- 3: 2, CO2 with 1014.30 Gg CO2 / year (226.8%)
- 4: 2, PFCS (AR6GWP100) with 895.77 Gg CO2 / year (44.2%)
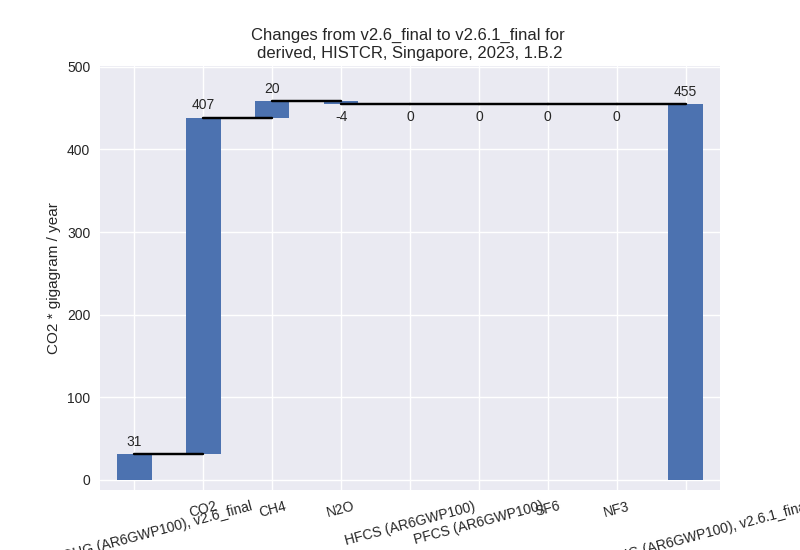
- 5: 1.B.2, CO2 with 407.48 Gg CO2 / year (inf%)
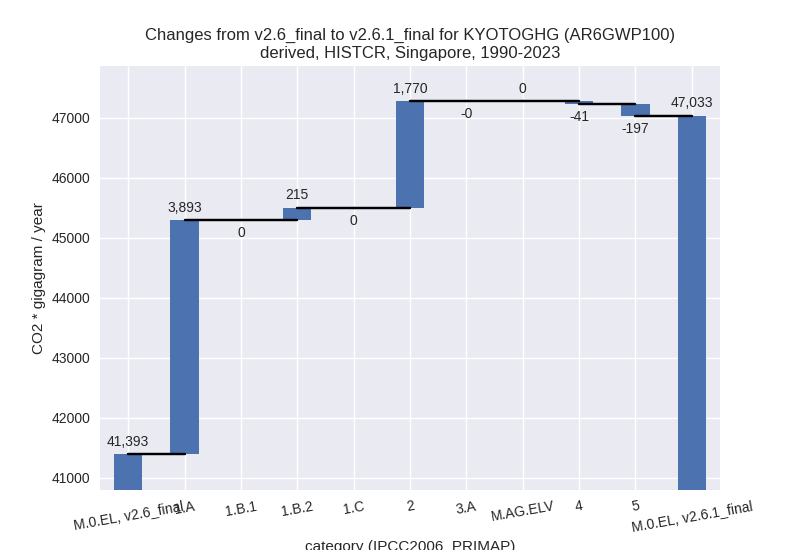
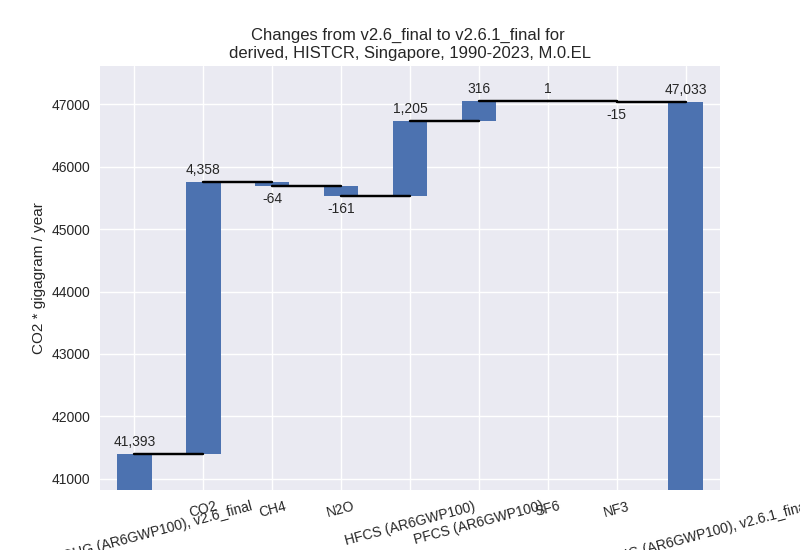
In the country reported priority scenario the following sector-gas combinations have the highest absolute impact on national total KyotoGHG (AR6GWP100) emissions in 1990-2023 (top 5):
- 1: 1.A, CO2 with 3874.61 Gg CO2 / year (10.0%)
- 2: 2, HFCS (AR6GWP100) with 1205.15 Gg CO2 / year (622.8%)
- 3: 2, PFCS (AR6GWP100) with 316.15 Gg CO2 / year (33.8%)
- 4: 2, CO2 with 278.38 Gg CO2 / year (171.7%)
- 5: 1.B.2, CO2 with 203.87 Gg CO2 / year (65.7%)
In the third party priority scenario the following sector-gas combinations have the highest absolute impact on national total KyotoGHG (AR6GWP100) emissions in 2023 (top 5):
- 1: 2, CO2 with 690.96 Gg CO2 / year (6.8%)
- 2: 2, N2O with -618.73 Gg CO2 / year (-43.7%)
- 3: 1.A, N2O with 156.41 Gg CO2 / year (132.3%)
- 4: 4, CH4 with -126.42 Gg CO2 / year (-2.5%)
- 5: 2, HFCS (AR6GWP100) with -70.09 Gg CO2 / year (-0.7%)
In the third party priority scenario the following sector-gas combinations have the highest absolute impact on national total KyotoGHG (AR6GWP100) emissions in 1990-2023 (top 5):
- 1: 4, CH4 with -734.65 Gg CO2 / year (-22.8%)
- 2: 2, N2O with -113.19 Gg CO2 / year (-4.9%)
- 3: 1.A, N2O with 53.54 Gg CO2 / year (41.6%)
- 4: 1.B.2, CO2 with 50.72 Gg CO2 / year (127841.4%)
- 5: 5, N2O with -24.45 Gg CO2 / year (-12.4%)
Notes on data changes
Here we list notes explaining important emissions changes for the country.
- CRT data from BTR1 covering 2000-2022 has been added. It replaces
and extends data from BUR5.
- Total emissions changes are smaller than individual sector changes because these partly cancel.
- The new data significantly differs from older submissions for many sectors and gases and over the full time-period.
- Changes in the TP time-series come directly from EDGAR
Changes by sector and gas
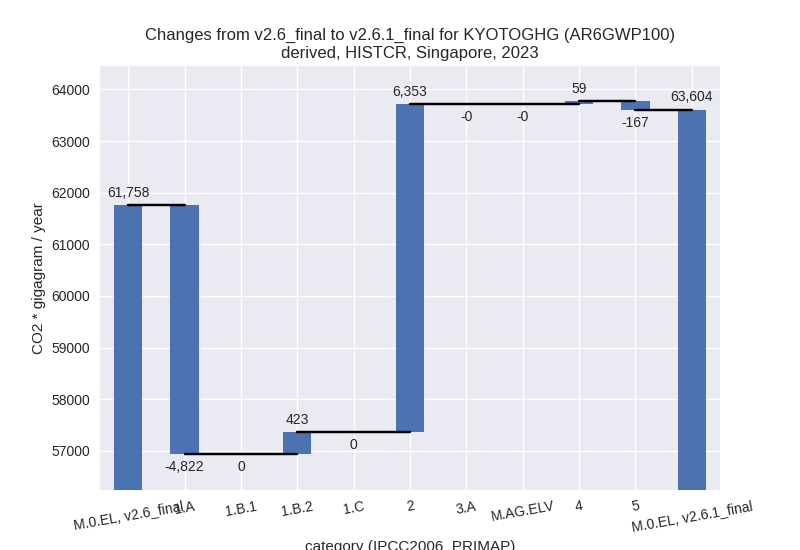
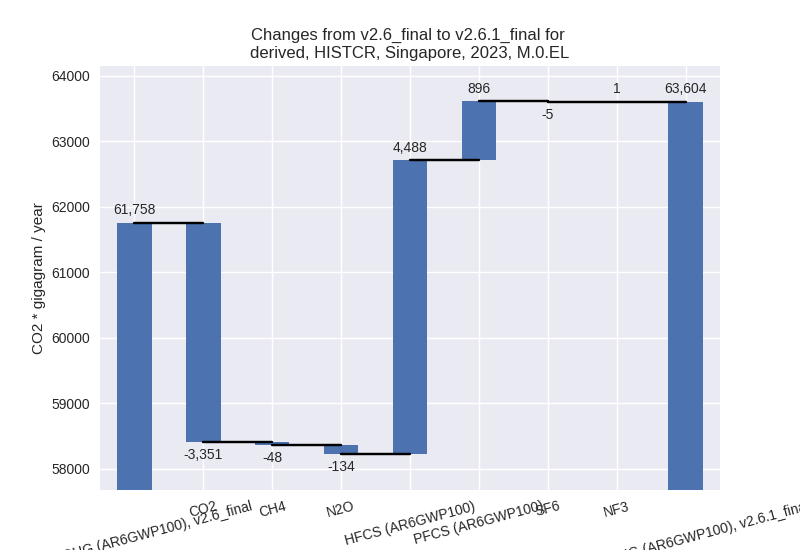
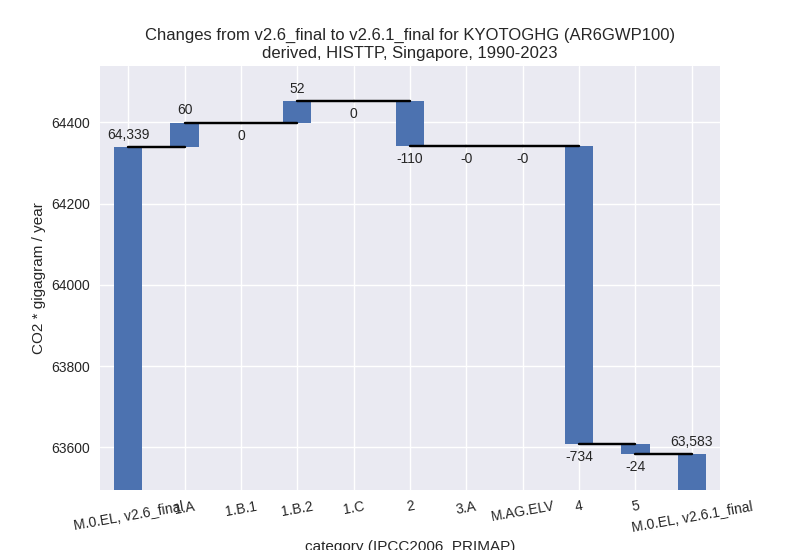
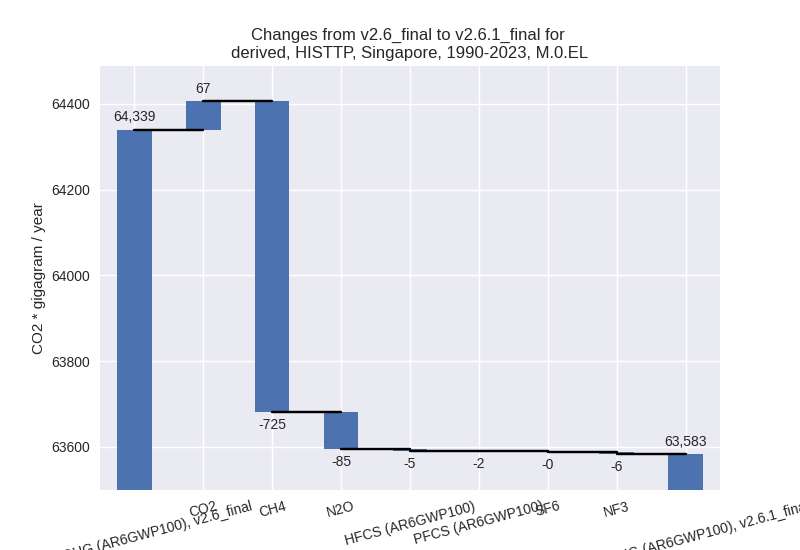
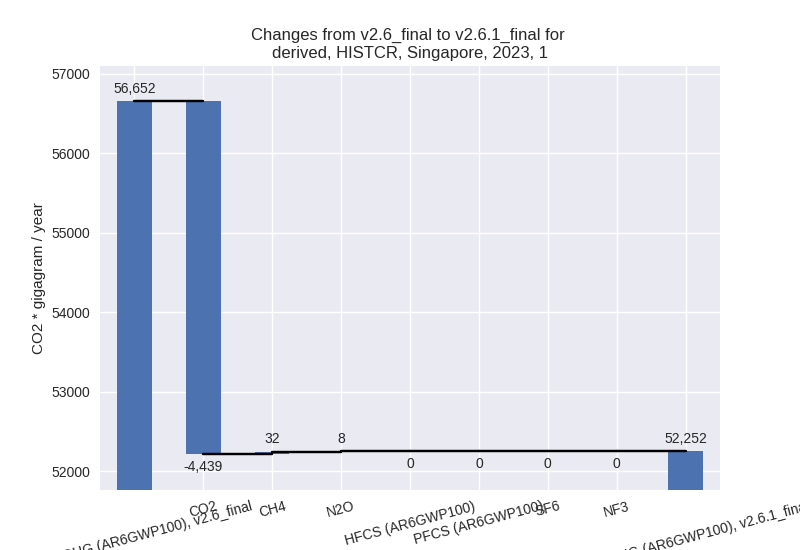
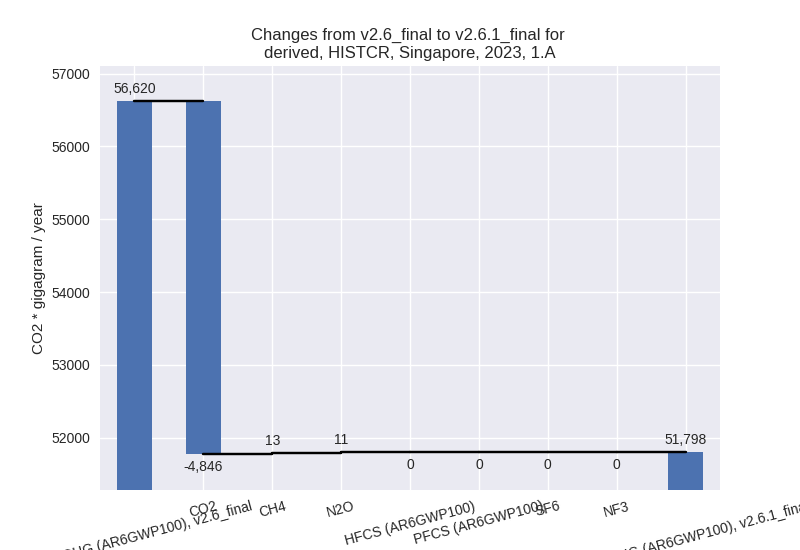
For each scenario and time frame the changes are displayed for all individual sectors and all individual gases. In the sector plot we use aggregate Kyoto GHGs in AR6GWP100. In the gas plot we usenational total emissions without LULUCF.
country reported scenario
2023
1990-2023
third party scenario
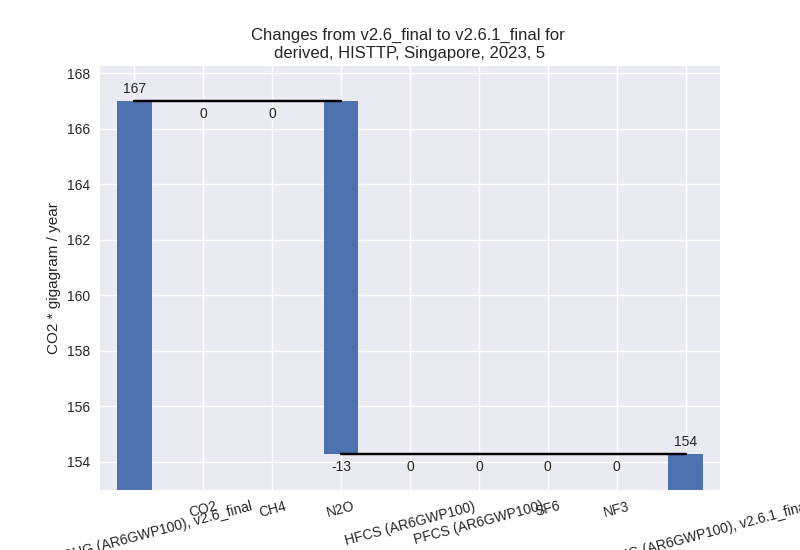
2023
1990-2023
Detailed changes for the scenarios:
country reported scenario (HISTCR):
Most important changes per time frame
For 2023 the following sector-gas combinations have the highest absolute impact on national total KyotoGHG (AR6GWP100) emissions in 2023 (top 5):
- 1: 1.A, CO2 with -4846.44 Gg CO2 / year (-8.6%)
- 2: 2, HFCS (AR6GWP100) with 4487.51 Gg CO2 / year (557.7%)
- 3: 2, CO2 with 1014.30 Gg CO2 / year (226.8%)
- 4: 2, PFCS (AR6GWP100) with 895.77 Gg CO2 / year (44.2%)
- 5: 1.B.2, CO2 with 407.48 Gg CO2 / year (inf%)
For 1990-2023 the following sector-gas combinations have the highest absolute impact on national total KyotoGHG (AR6GWP100) emissions in 1990-2023 (top 5):
- 1: 1.A, CO2 with 3874.61 Gg CO2 / year (10.0%)
- 2: 2, HFCS (AR6GWP100) with 1205.15 Gg CO2 / year (622.8%)
- 3: 2, PFCS (AR6GWP100) with 316.15 Gg CO2 / year (33.8%)
- 4: 2, CO2 with 278.38 Gg CO2 / year (171.7%)
- 5: 1.B.2, CO2 with 203.87 Gg CO2 / year (65.7%)
Changes in the main sectors for aggregate KyotoGHG (AR6GWP100) are
- 1: Total sectoral emissions in 2022 are 49074.89 Gg
CO2 / year which is 82.3% of M.0.EL emissions. 2023 Emissions have
changed by -7.8% (-4399.00 Gg CO2 /
year). 1990-2023 Emissions have changed by 10.5% (4108.06 Gg CO2 / year). For 2023
the changes per gas
are:
For 1990-2023 the changes per gas are:
The changes come from the following subsectors:- 1.A: Total sectoral emissions in 2022 are 48461.12
Gg CO2 / year which is 98.7% of category 1 emissions. 2023 Emissions
have changed by -8.5% (-4822.43 Gg
CO2 / year). 1990-2023 Emissions have changed by 10.0% (3893.26 Gg CO2 / year). For 2023
the changes per gas
are:
For 1990-2023 the changes per gas are: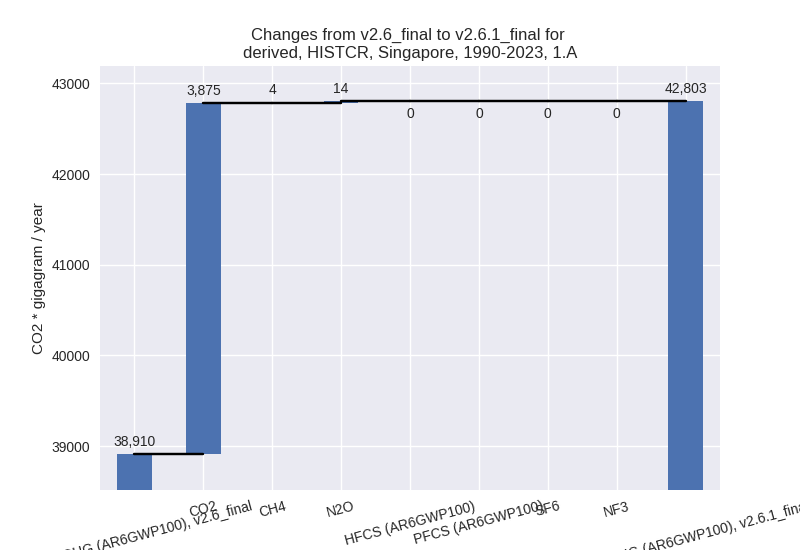
There is no subsector information available in PRIMAP-hist. - 1.B.2: Total sectoral emissions in 2022 are 613.77
Gg CO2 / year which is 1.3% of category 1 emissions. 2023 Emissions have
changed by 1358.1% (423.43 Gg CO2 /
year). 1990-2023 Emissions have changed by 66.4% (214.80 Gg CO2 / year). For 2023 the
changes per gas
are:
For 1990-2023 the changes per gas are: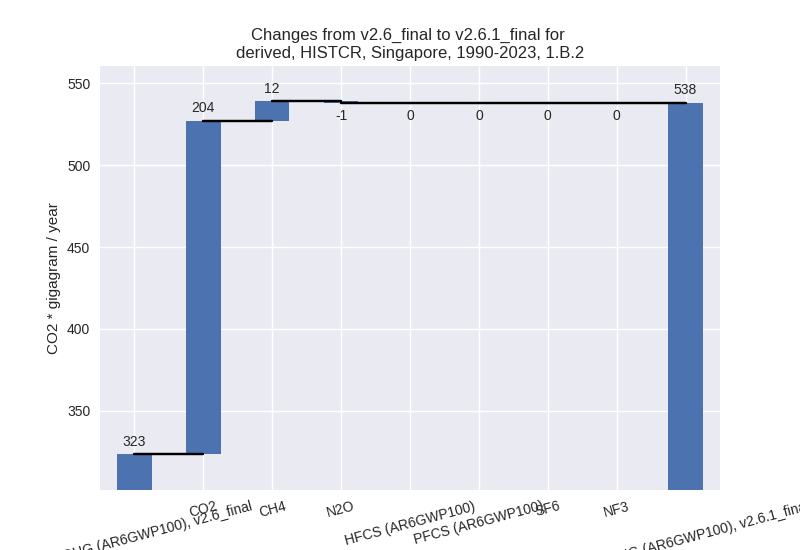
There is no subsector information available in PRIMAP-hist.
- 1.A: Total sectoral emissions in 2022 are 48461.12
Gg CO2 / year which is 98.7% of category 1 emissions. 2023 Emissions
have changed by -8.5% (-4822.43 Gg
CO2 / year). 1990-2023 Emissions have changed by 10.0% (3893.26 Gg CO2 / year). For 2023
the changes per gas
are:
- 2: Total sectoral emissions in 2022 are 10194.95 Gg
CO2 / year which is 17.1% of M.0.EL emissions. 2023 Emissions have
changed by 138.1% (6352.78 Gg CO2 /
year). 1990-2023 Emissions have changed by 107.0% (1770.35 Gg CO2 / year). For 2023
the changes per gas
are:
For 1990-2023 the changes per gas are: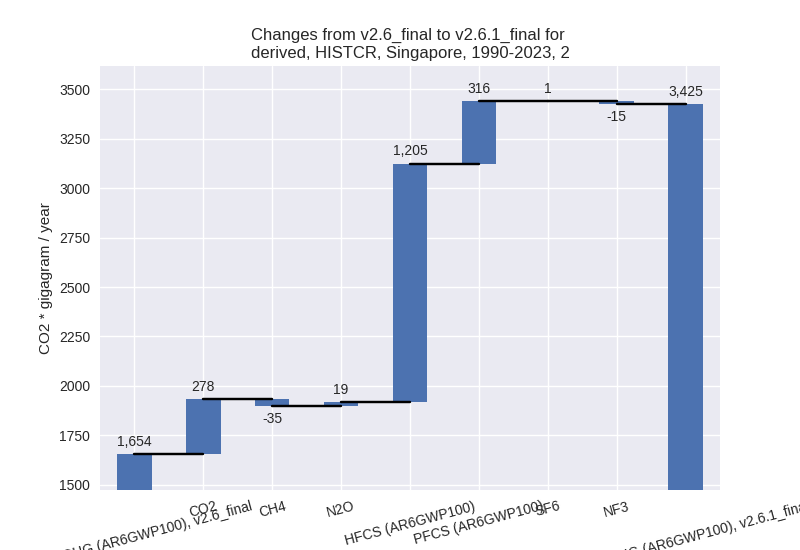
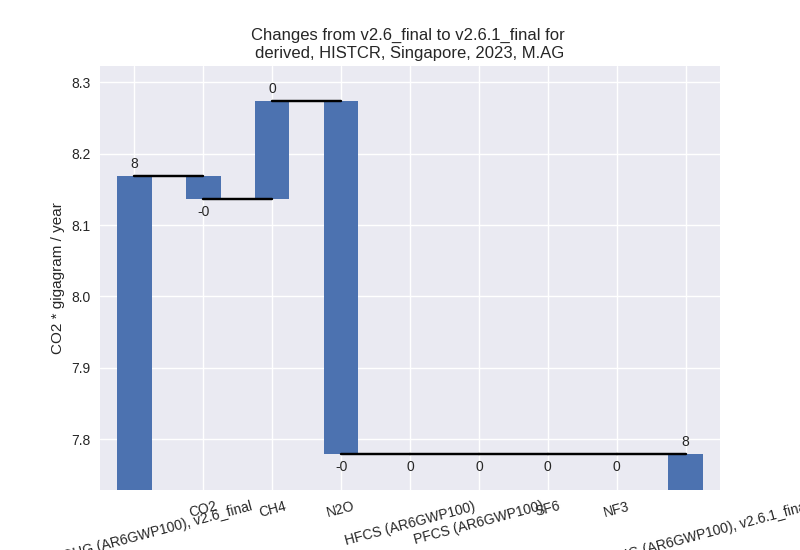
- M.AG: Total sectoral emissions in 2022 are 8.25 Gg
CO2 / year which is 0.0% of M.0.EL emissions. 2023 Emissions have
changed by -4.8% (-0.39 Gg CO2 /
year). 1990-2023 Emissions have changed by 1.0% (0.11 Gg CO2 / year). For 2023 the
changes per gas
are:
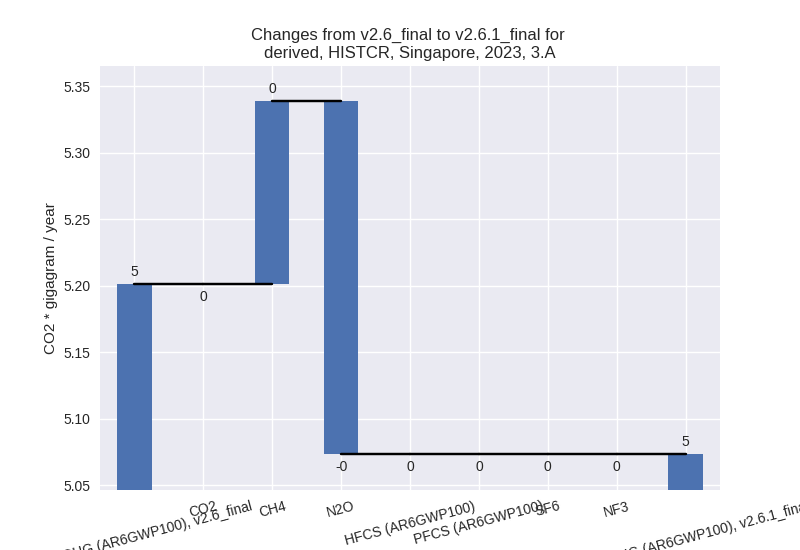
The changes come from the following subsectors:- 3.A: Total sectoral emissions in 2022 are 5.55 Gg
CO2 / year which is 67.2% of category M.AG emissions. 2023 Emissions
have changed by -2.5% (-0.13 Gg CO2
/ year). 1990-2023 Emissions have changed by -0.6% (-0.05 Gg CO2 / year). For 2023 the
changes per gas
are:
There is no subsector information available in PRIMAP-hist. - M.AG.ELV: Total sectoral emissions in 2022 are 2.71
Gg CO2 / year which is 32.8% of category M.AG emissions. 2023 Emissions
have changed by -8.8% (-0.26 Gg CO2
/ year). 1990-2023 Emissions have changed by 5.7% (0.16 Gg CO2 / year). For 2023 the
changes per gas
are:
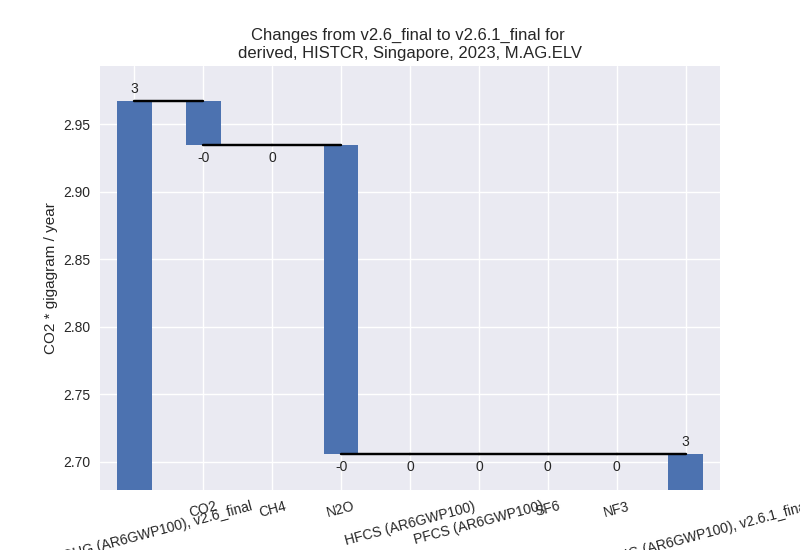
For 1990-2023 the changes per gas are: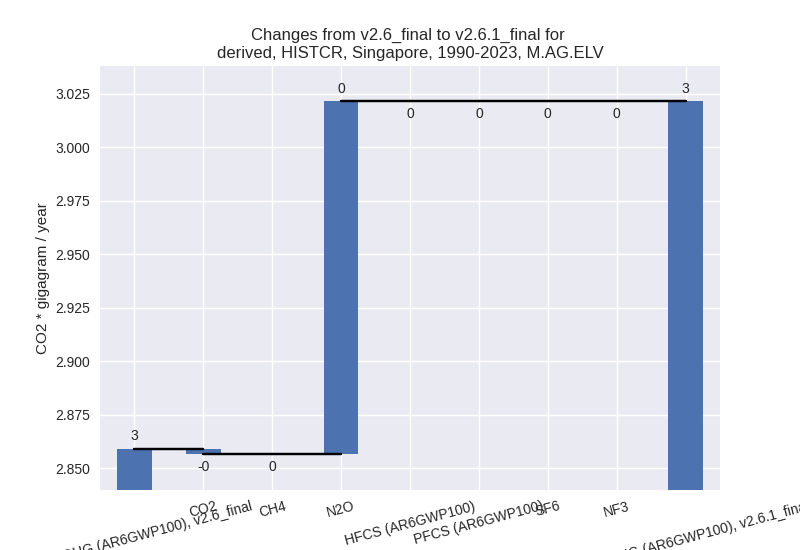
There is no subsector information available in PRIMAP-hist.
- 3.A: Total sectoral emissions in 2022 are 5.55 Gg
CO2 / year which is 67.2% of category M.AG emissions. 2023 Emissions
have changed by -2.5% (-0.13 Gg CO2
/ year). 1990-2023 Emissions have changed by -0.6% (-0.05 Gg CO2 / year). For 2023 the
changes per gas
are:
- 4: Total sectoral emissions in 2022 are 386.55 Gg
CO2 / year which is 0.6% of M.0.EL emissions. 2023 Emissions have
changed by 17.7% (59.09 Gg CO2 /
year). 1990-2023 Emissions have changed by -13.9% (-41.43 Gg CO2 / year). For 2023
the changes per gas
are:
For 1990-2023 the changes per gas are: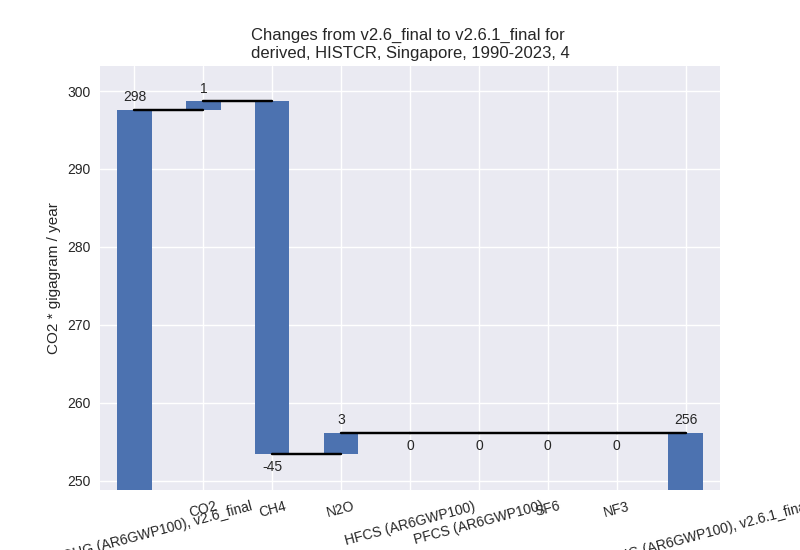
- 5: Total sectoral emissions in 2022 are 0.00 Gg CO2
/ year which is 0.0% of M.0.EL emissions. 2023 Emissions have changed by
-100.0% (-166.99 Gg CO2 / year).
1990-2023 Emissions have changed by -100.0% (-196.56 Gg CO2 / year). For 2023
the changes per gas
are:
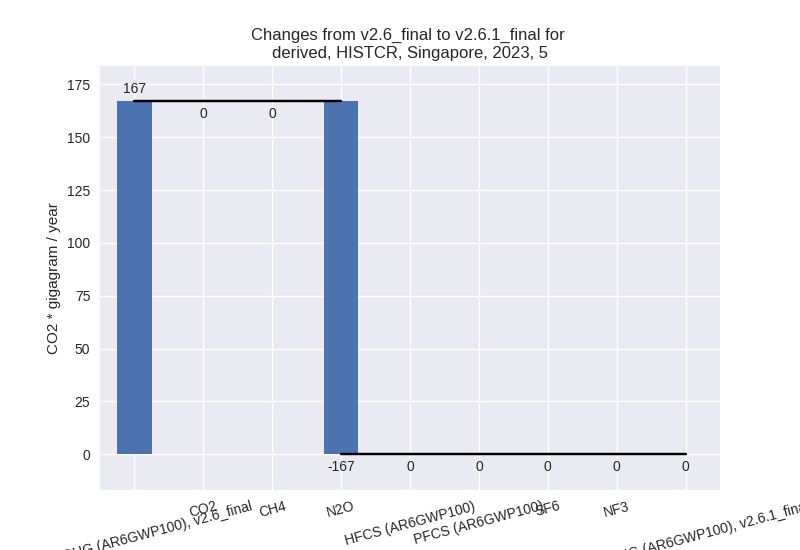
For 1990-2023 the changes per gas are: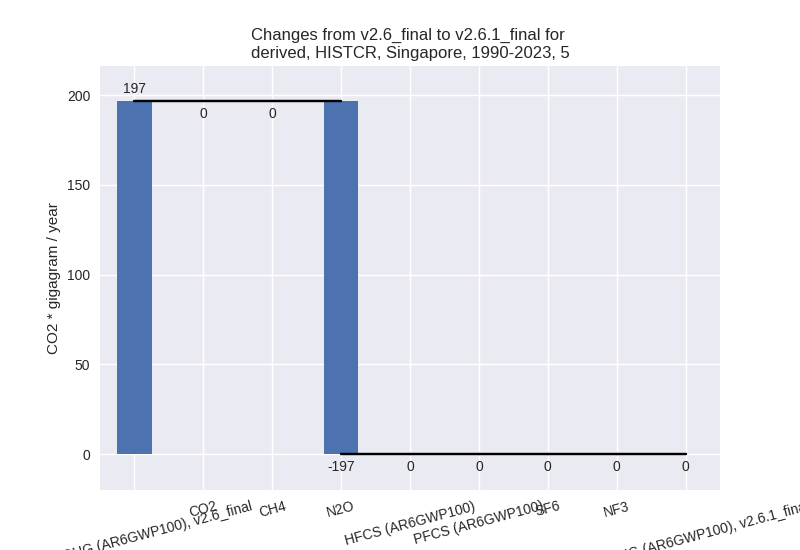
third party scenario (HISTTP):
Most important changes per time frame
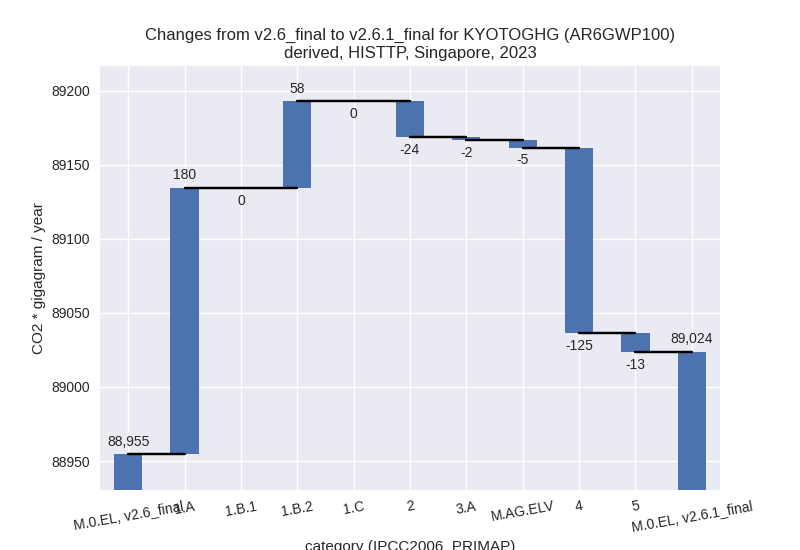
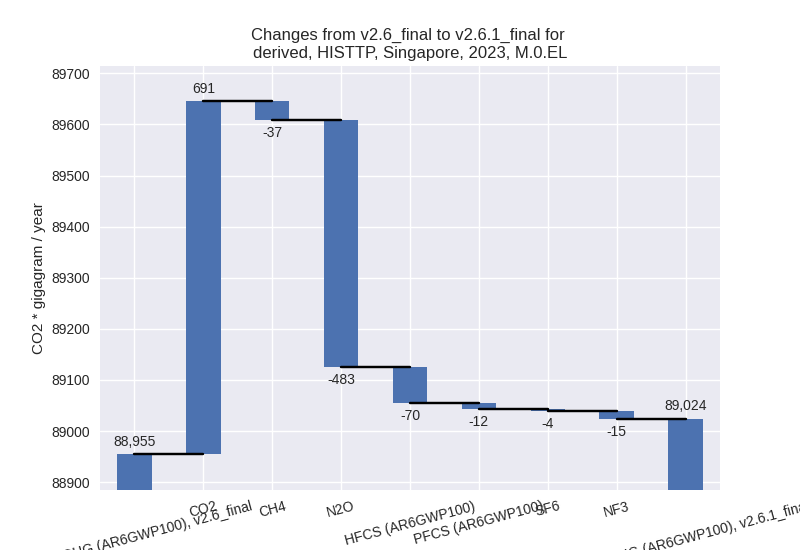
For 2023 the following sector-gas combinations have the highest absolute impact on national total KyotoGHG (AR6GWP100) emissions in 2023 (top 5):
- 1: 2, CO2 with 690.96 Gg CO2 / year (6.8%)
- 2: 2, N2O with -618.73 Gg CO2 / year (-43.7%)
- 3: 1.A, N2O with 156.41 Gg CO2 / year (132.3%)
- 4: 4, CH4 with -126.42 Gg CO2 / year (-2.5%)
- 5: 2, HFCS (AR6GWP100) with -70.09 Gg CO2 / year (-0.7%)
For 1990-2023 the following sector-gas combinations have the highest absolute impact on national total KyotoGHG (AR6GWP100) emissions in 1990-2023 (top 5):
- 1: 4, CH4 with -734.65 Gg CO2 / year (-22.8%)
- 2: 2, N2O with -113.19 Gg CO2 / year (-4.9%)
- 3: 1.A, N2O with 53.54 Gg CO2 / year (41.6%)
- 4: 1.B.2, CO2 with 50.72 Gg CO2 / year (127841.4%)
- 5: 5, N2O with -24.45 Gg CO2 / year (-12.4%)
Changes in the main sectors for aggregate KyotoGHG (AR6GWP100) are
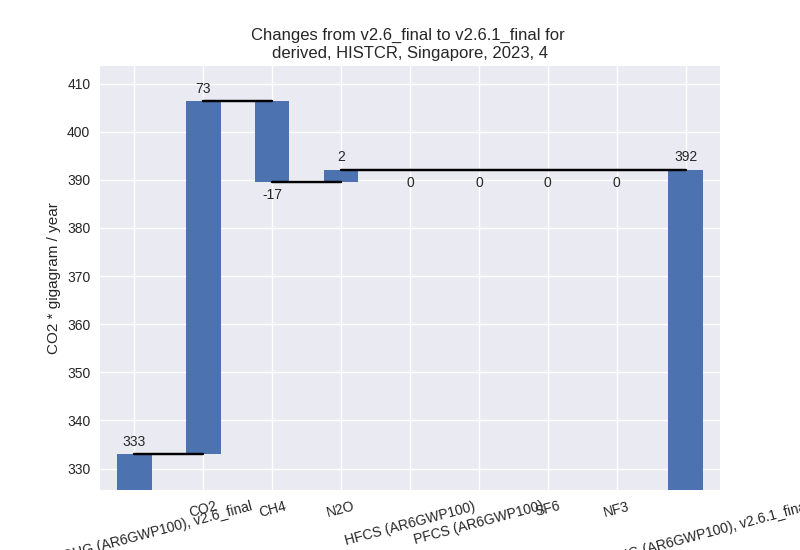
- 1: Total sectoral emissions in 2022 are 55428.89 Gg CO2 / year which is 66.9% of M.0.EL emissions. 2023 Emissions have changed by 0.4% (238.25 Gg CO2 / year). 1990-2023 Emissions have changed by 0.2% (112.60 Gg CO2 / year).
- 2: Total sectoral emissions in 2022 are 22675.49 Gg CO2 / year which is 27.4% of M.0.EL emissions. 2023 Emissions have changed by -0.1% (-24.43 Gg CO2 / year). 1990-2023 Emissions have changed by -0.9% (-109.87 Gg CO2 / year).
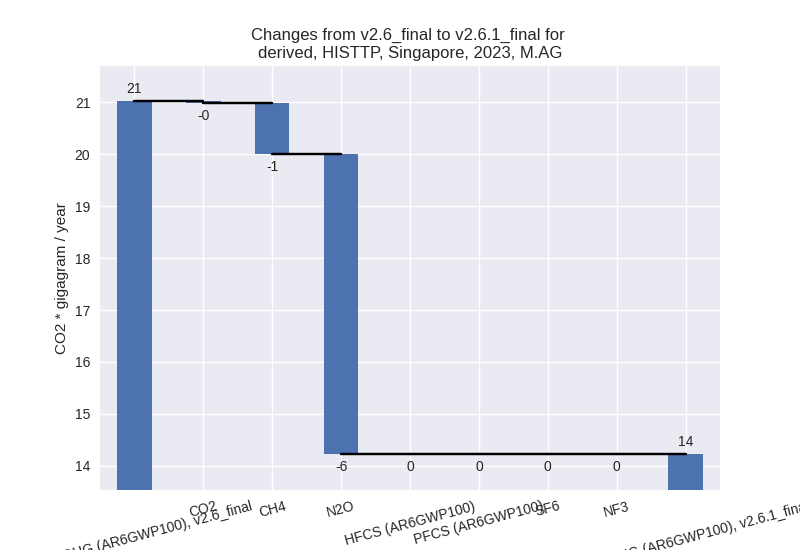
- M.AG: Total sectoral emissions in 2022 are 14.53 Gg
CO2 / year which is 0.0% of M.0.EL emissions. 2023 Emissions have
changed by -32.3% (-6.80 Gg CO2 /
year). 1990-2023 Emissions have changed by -1.5% (-0.34 Gg CO2 / year). For 2023 the
changes per gas
are:
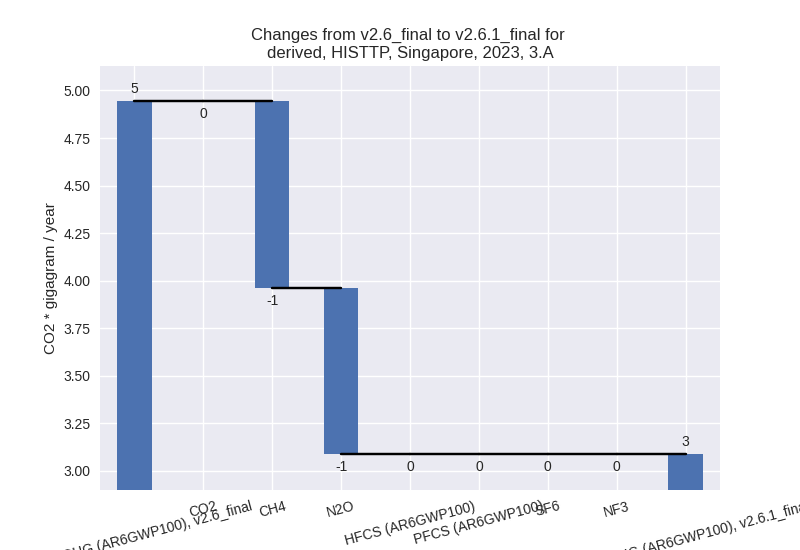
The changes come from the following subsectors:- 3.A: Total sectoral emissions in 2022 are 3.37 Gg
CO2 / year which is 23.2% of category M.AG emissions. 2023 Emissions
have changed by -37.6% (-1.86 Gg CO2
/ year). 1990-2023 Emissions have changed by -1.6% (-0.09 Gg CO2 / year). For 2023 the
changes per gas
are:
There is no subsector information available in PRIMAP-hist. - M.AG.ELV: Total sectoral emissions in 2022 are
11.15 Gg CO2 / year which is 76.8% of category M.AG emissions. 2023
Emissions have changed by -30.7%
(-4.94 Gg CO2 / year). 1990-2023 Emissions have changed by -1.4% (-0.24 Gg CO2 / year). For 2023 the
changes per gas
are:

There is no subsector information available in PRIMAP-hist.
- 3.A: Total sectoral emissions in 2022 are 3.37 Gg
CO2 / year which is 23.2% of category M.AG emissions. 2023 Emissions
have changed by -37.6% (-1.86 Gg CO2
/ year). 1990-2023 Emissions have changed by -1.6% (-0.09 Gg CO2 / year). For 2023 the
changes per gas
are:
- 4: Total sectoral emissions in 2022 are 4538.09 Gg
CO2 / year which is 5.5% of M.0.EL emissions. 2023 Emissions have
changed by -2.5% (-125.10 Gg CO2 /
year). 1990-2023 Emissions have changed by -22.2% (-734.38 Gg CO2 / year). For 2023
the changes per gas
are:

For 1990-2023 the changes per gas are: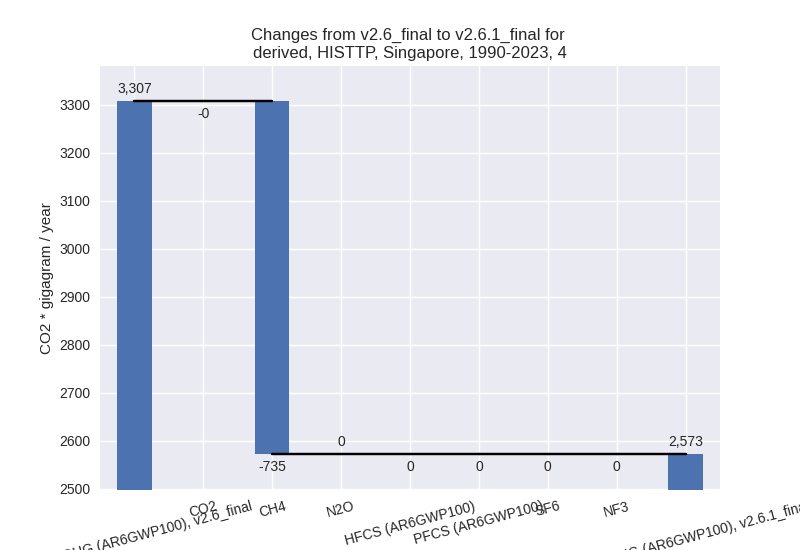
- 5: Total sectoral emissions in 2022 are 150.02 Gg
CO2 / year which is 0.2% of M.0.EL emissions. 2023 Emissions have
changed by -7.6% (-12.72 Gg CO2 /
year). 1990-2023 Emissions have changed by -12.4% (-24.45 Gg CO2 / year). For 2023
the changes per gas
are:
For 1990-2023 the changes per gas are: