Changes in PRIMAP-hist v2.6.1_final compared to v2.6_final for Sierra Leone
2025-03-19
Johannes Gütschow
Change analysis for Sierra Leone for PRIMAP-hist v2.6.1_final compared to v2.6_final
Overview over emissions by sector and gas
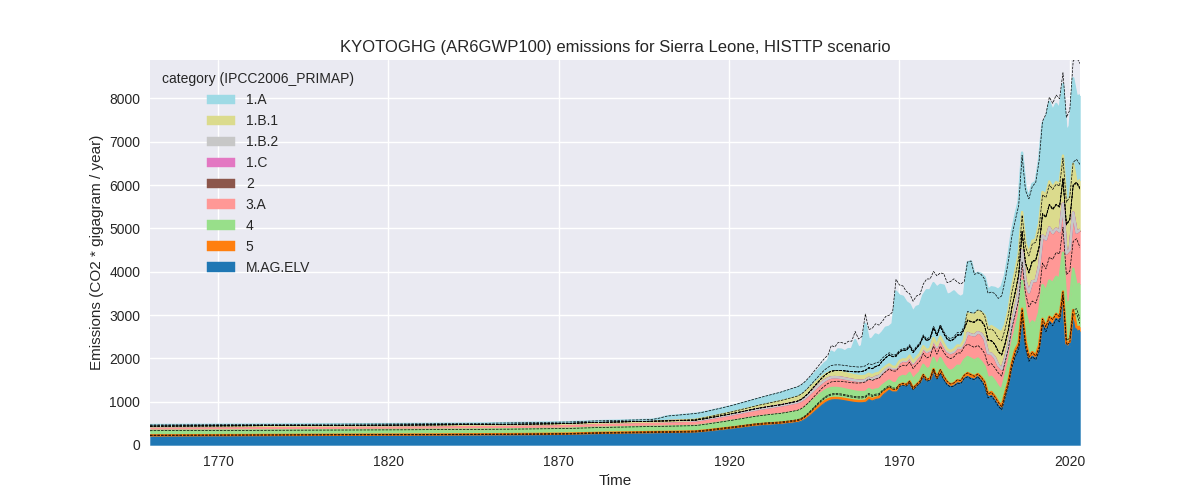
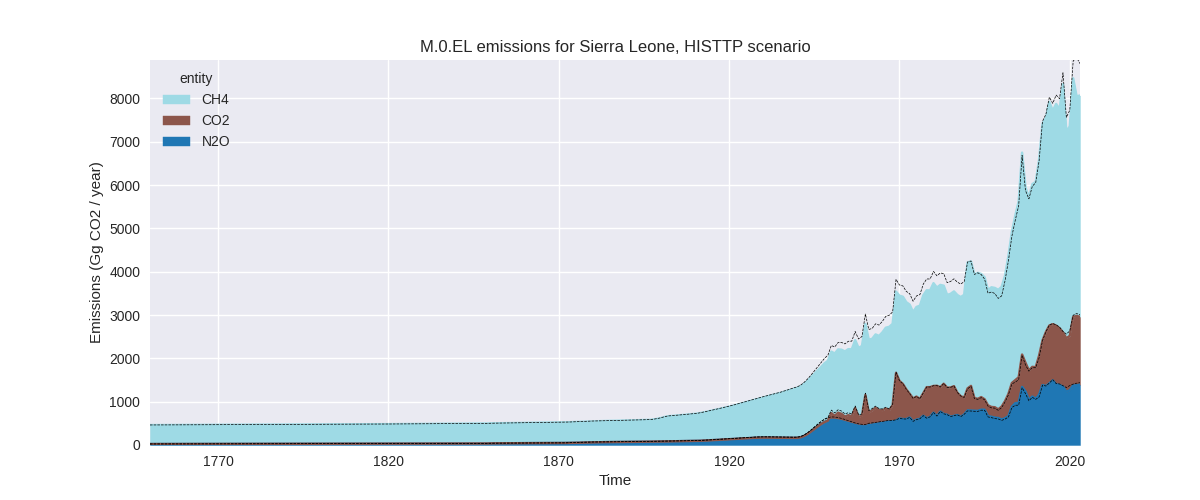
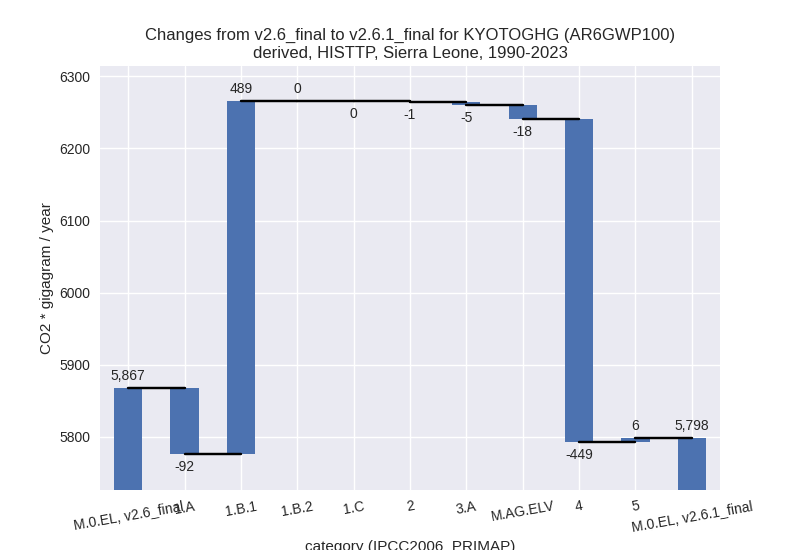
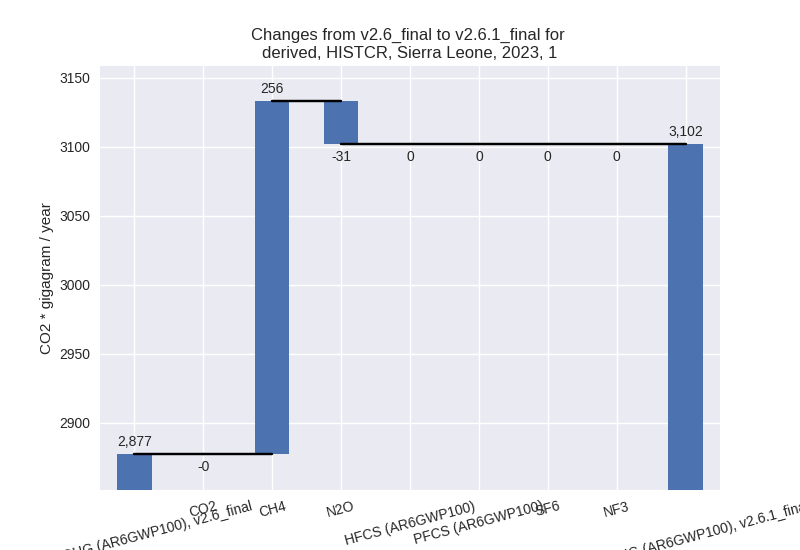
The following figures show the aggregate national total emissions excluding LULUCF AR6GWP100 for the country reported priority scenario. The dotted linesshow the v2.6_final data.
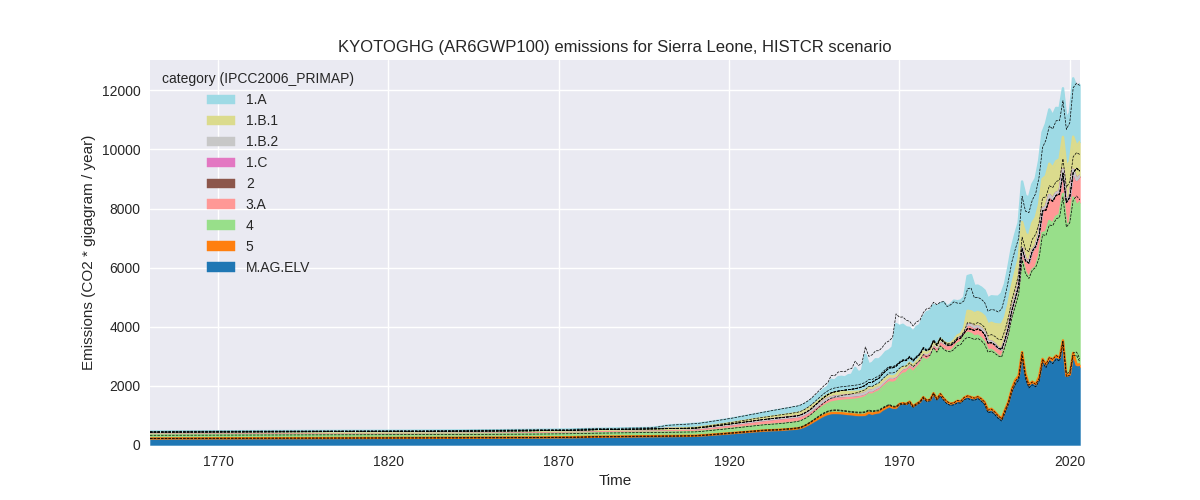
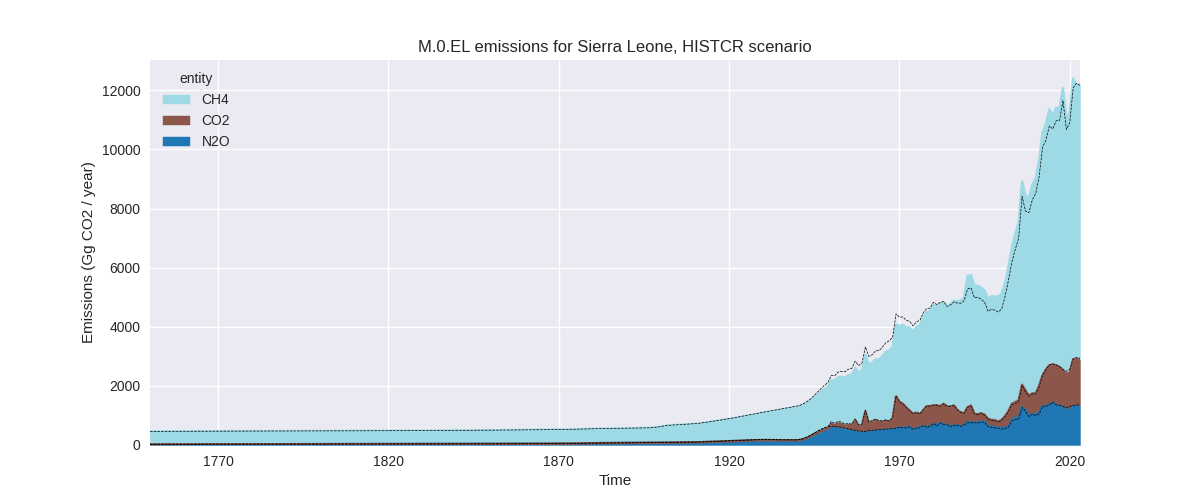
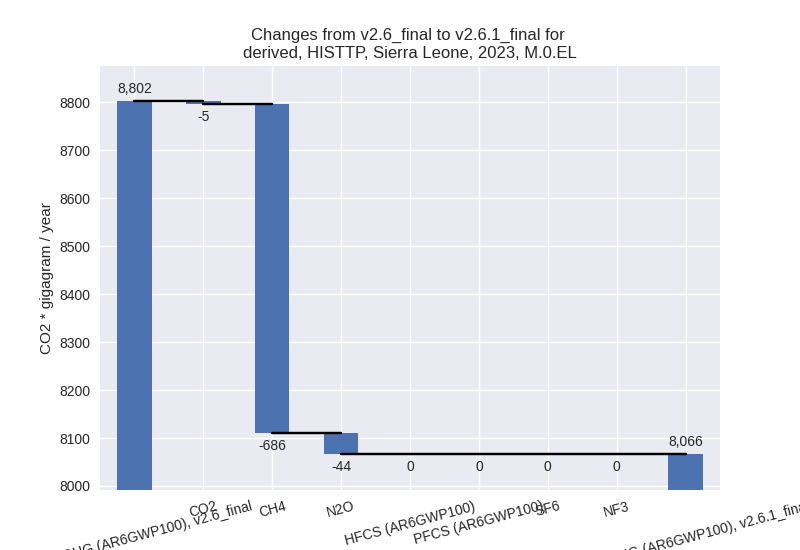
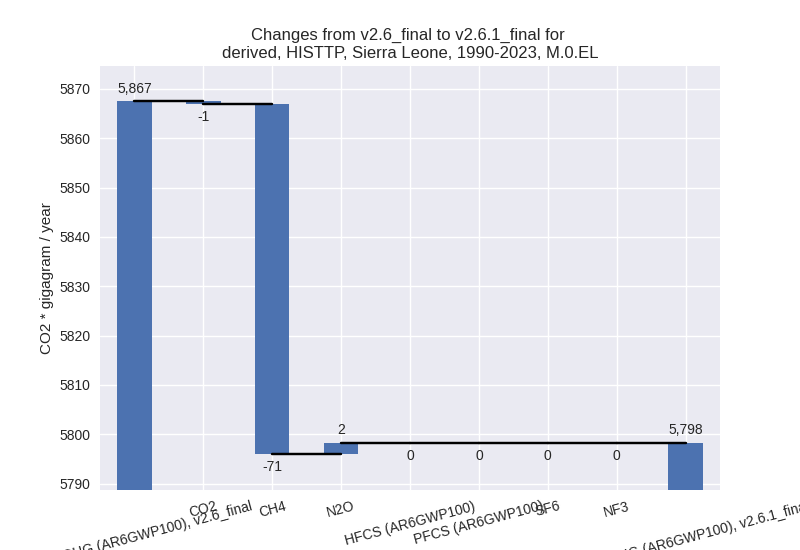
The following figures show the aggregate national total emissions excluding LULUCF AR6GWP100 for the third party priority scenario. The dotted linesshow the v2.6_final data.
Overview over changes
In the country reported priority scenario we have the following changes for aggregate Kyoto GHG and national total emissions excluding LULUCF (M.0.EL):
- Emissions in 2023 have changed by 0.5%% (55.68 Gg CO2 / year)
- Emissions in 1990-2023 have changed by 5.5%% (430.51 Gg CO2 / year)
In the third party priority scenario we have the following changes for aggregate Kyoto GHG and national total emissions excluding LULUCF (M.0.EL):
- Emissions in 2023 have changed by -8.4%% (-735.91 Gg CO2 / year)
- Emissions in 1990-2023 have changed by -1.2%% (-69.14 Gg CO2 / year)
Most important changes per scenario and time frame
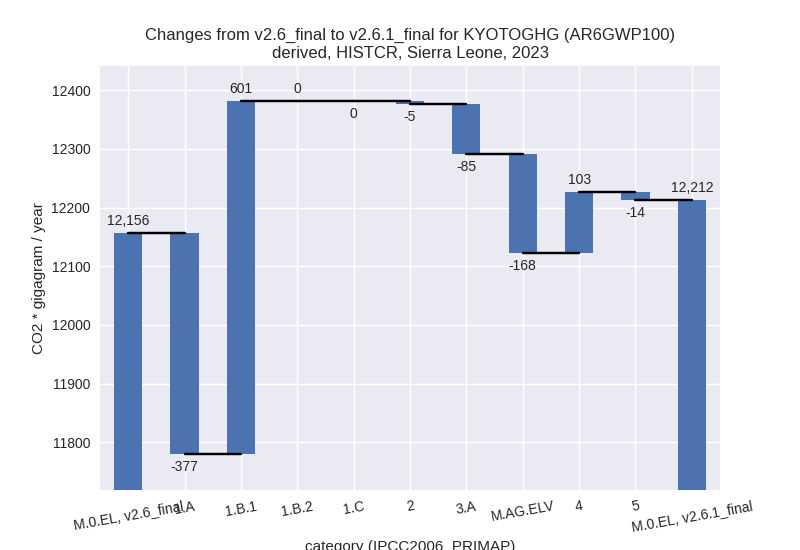
In the country reported priority scenario the following sector-gas combinations have the highest absolute impact on national total KyotoGHG (AR6GWP100) emissions in 2023 (top 5):
- 1: 1.B.1, CH4 with 593.14 Gg CO2 / year (109.8%)
- 2: 1.A, CH4 with -337.39 Gg CO2 / year (-38.1%)
- 3: M.AG.ELV, CH4 with -172.42 Gg CO2 / year (-10.0%)
- 4: 4, CH4 with 102.98 Gg CO2 / year (2.0%)
- 5: 3.A, CH4 with -81.99 Gg CO2 / year (-8.9%)
In the country reported priority scenario the following sector-gas combinations have the highest absolute impact on national total KyotoGHG (AR6GWP100) emissions in 1990-2023 (top 5):
- 1: 1.B.1, CH4 with 483.00 Gg CO2 / year (131.7%)
- 2: 1.A, CH4 with -82.68 Gg CO2 / year (-11.8%)
- 3: 4, CH4 with 49.64 Gg CO2 / year (1.5%)
- 4: M.AG.ELV, CH4 with -17.83 Gg CO2 / year (-1.4%)
- 5: 1.A, N2O with -8.89 Gg CO2 / year (-9.3%)
In the third party priority scenario the following sector-gas combinations have the highest absolute impact on national total KyotoGHG (AR6GWP100) emissions in 2023 (top 5):
- 1: 4, CH4 with -654.19 Gg CO2 / year (-48.6%)
- 2: 1.B.1, CH4 with 593.14 Gg CO2 / year (109.8%)
- 3: 1.A, CH4 with -337.39 Gg CO2 / year (-38.1%)
- 4: M.AG.ELV, CH4 with -172.42 Gg CO2 / year (-10.0%)
- 5: 3.A, CH4 with -115.75 Gg CO2 / year (-8.9%)
In the third party priority scenario the following sector-gas combinations have the highest absolute impact on national total KyotoGHG (AR6GWP100) emissions in 1990-2023 (top 5):
- 1: 1.B.1, CH4 with 483.00 Gg CO2 / year (131.7%)
- 2: 4, CH4 with -448.43 Gg CO2 / year (-49.1%)
- 3: 1.A, CH4 with -82.68 Gg CO2 / year (-11.8%)
- 4: M.AG.ELV, CH4 with -17.83 Gg CO2 / year (-1.4%)
- 5: 1.A, N2O with -8.89 Gg CO2 / year (-9.3%)
Notes on data changes
Here we list notes explaining important emissions changes for the country.
- No new country reported data has been included. Country reported data only covers very few sectors for a short period of time thus the third party time-series have a high influence on the CR scenario.
- Most of the high changes come directly from EDGAR and FAO data in both scenarios.
- Waste CH4 is an exception where changes in the TP time-series are much higher than in the CR time-series where unchanged country reported data anchors the time-series.
Changes by sector and gas
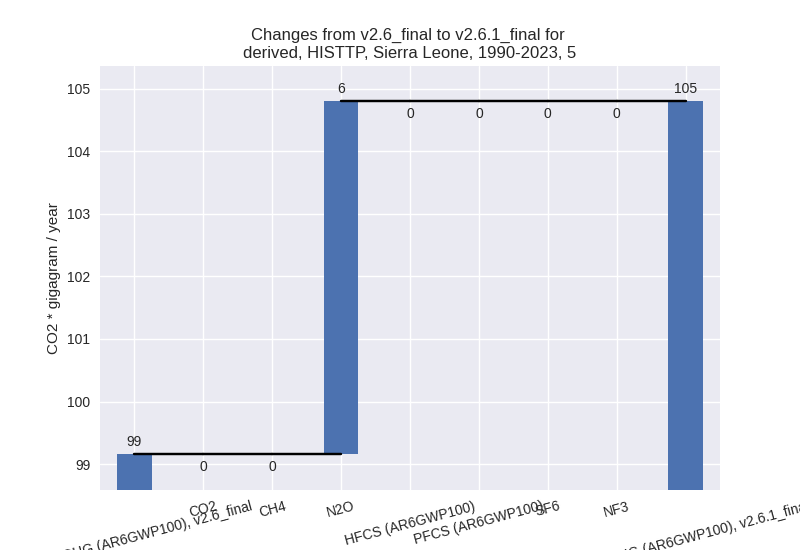
For each scenario and time frame the changes are displayed for all individual sectors and all individual gases. In the sector plot we use aggregate Kyoto GHGs in AR6GWP100. In the gas plot we usenational total emissions without LULUCF.
country reported scenario
2023
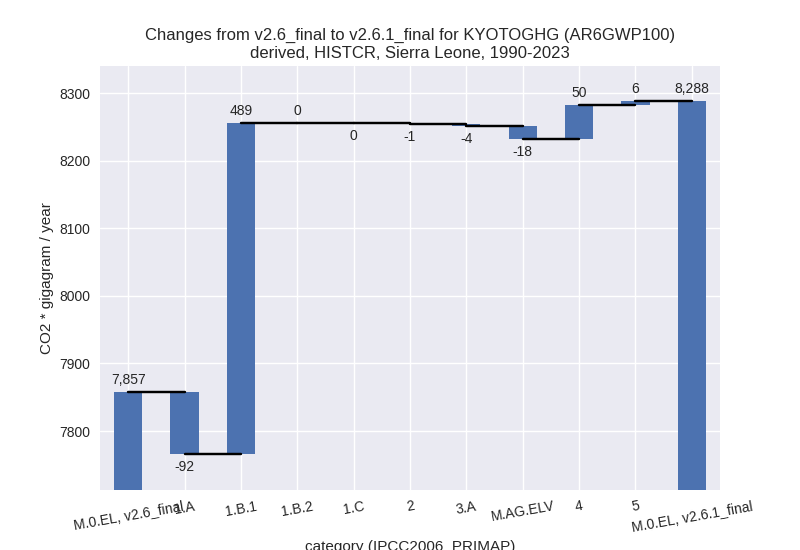
1990-2023
third party scenario
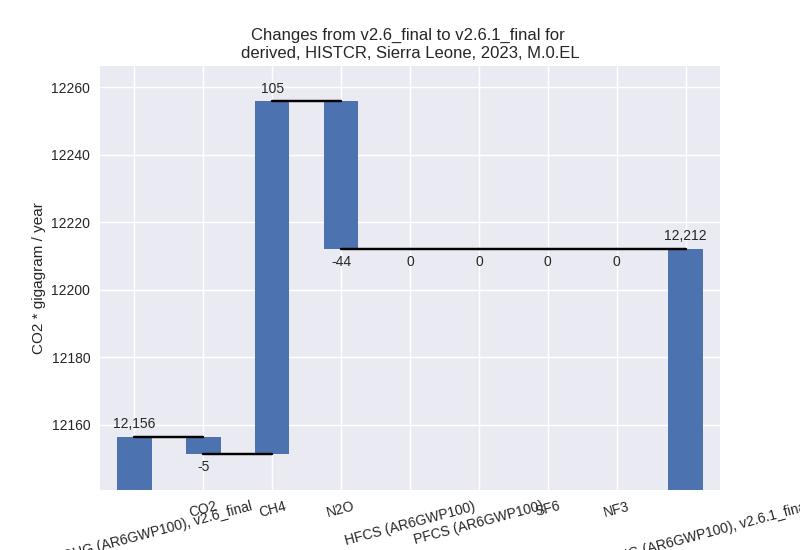
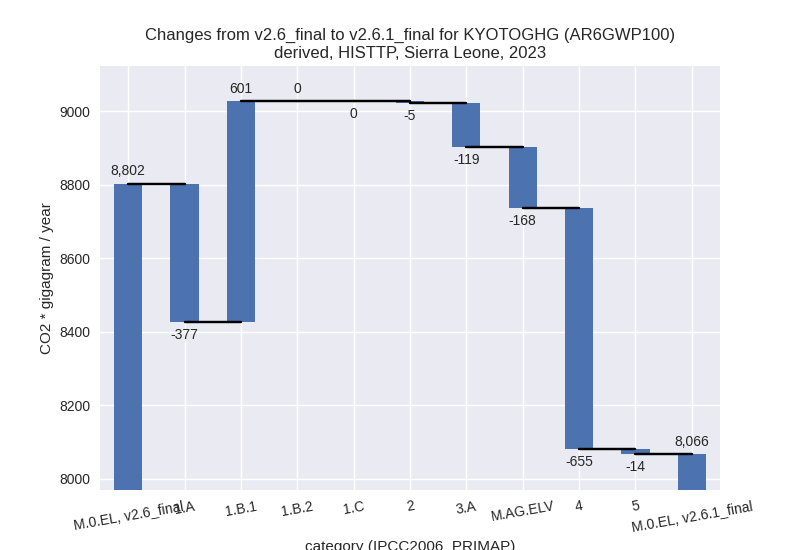
2023
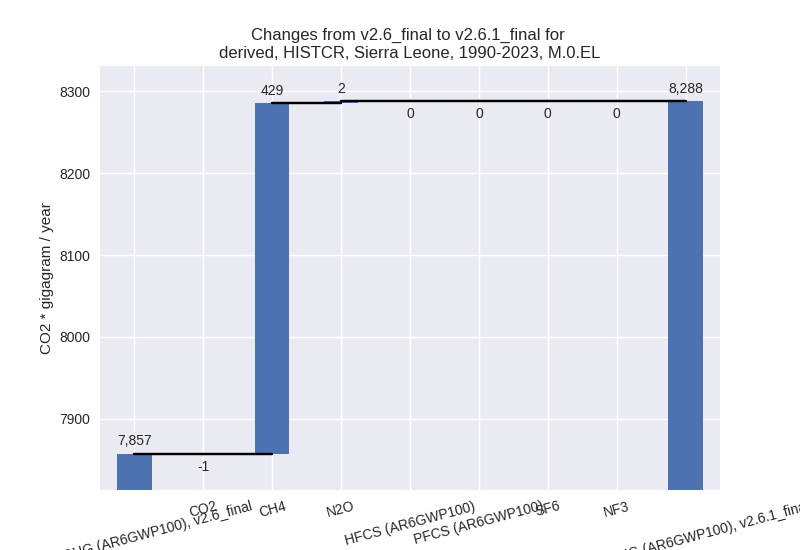
1990-2023
Detailed changes for the scenarios:
country reported scenario (HISTCR):
Most important changes per time frame
For 2023 the following sector-gas combinations have the highest absolute impact on national total KyotoGHG (AR6GWP100) emissions in 2023 (top 5):
- 1: 1.B.1, CH4 with 593.14 Gg CO2 / year (109.8%)
- 2: 1.A, CH4 with -337.39 Gg CO2 / year (-38.1%)
- 3: M.AG.ELV, CH4 with -172.42 Gg CO2 / year (-10.0%)
- 4: 4, CH4 with 102.98 Gg CO2 / year (2.0%)
- 5: 3.A, CH4 with -81.99 Gg CO2 / year (-8.9%)
For 1990-2023 the following sector-gas combinations have the highest absolute impact on national total KyotoGHG (AR6GWP100) emissions in 1990-2023 (top 5):
- 1: 1.B.1, CH4 with 483.00 Gg CO2 / year (131.7%)
- 2: 1.A, CH4 with -82.68 Gg CO2 / year (-11.8%)
- 3: 4, CH4 with 49.64 Gg CO2 / year (1.5%)
- 4: M.AG.ELV, CH4 with -17.83 Gg CO2 / year (-1.4%)
- 5: 1.A, N2O with -8.89 Gg CO2 / year (-9.3%)
Changes in the main sectors for aggregate KyotoGHG (AR6GWP100) are
- 1: Total sectoral emissions in 2022 are 3142.70 Gg
CO2 / year which is 25.9% of M.0.EL emissions. 2023 Emissions have
changed by 7.8% (224.60 Gg CO2 /
year). 1990-2023 Emissions have changed by 21.8% (397.95 Gg CO2 / year). For 2023 the
changes per gas
are:
For 1990-2023 the changes per gas are:
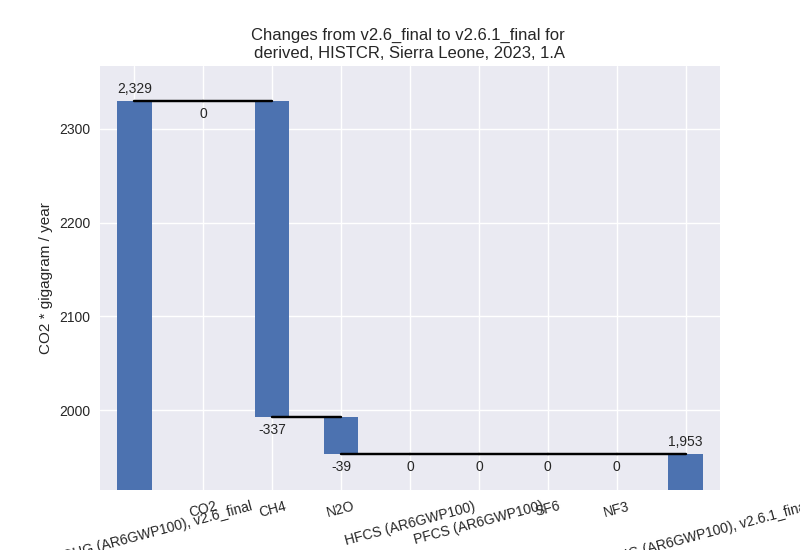
The changes come from the following subsectors:- 1.A: Total sectoral emissions in 2022 are 1993.90
Gg CO2 / year which is 63.4% of category 1 emissions. 2023 Emissions
have changed by -16.2% (-376.58 Gg
CO2 / year). 1990-2023 Emissions have changed by -6.3% (-91.57 Gg CO2 / year). For 2023 the
changes per gas
are:
For 1990-2023 the changes per gas are:
There is no subsector information available in PRIMAP-hist. - 1.B.1: Total sectoral emissions in 2022 are 1148.62
Gg CO2 / year which is 36.5% of category 1 emissions. 2023 Emissions
have changed by 109.8% (601.01 Gg
CO2 / year). 1990-2023 Emissions have changed by 131.7% (489.41 Gg CO2 / year). For 2023
the changes per gas
are:

For 1990-2023 the changes per gas are:
There is no subsector information available in PRIMAP-hist. - 1.B.2: Total sectoral emissions in 2022 are 0.19 Gg
CO2 / year which is 0.0% of category 1 emissions. 2023 Emissions have
changed by 782.2% (0.18 Gg CO2 /
year). 1990-2023 Emissions have changed by 30.8% (0.11 Gg CO2 / year). For 2023 the
changes per gas
are:
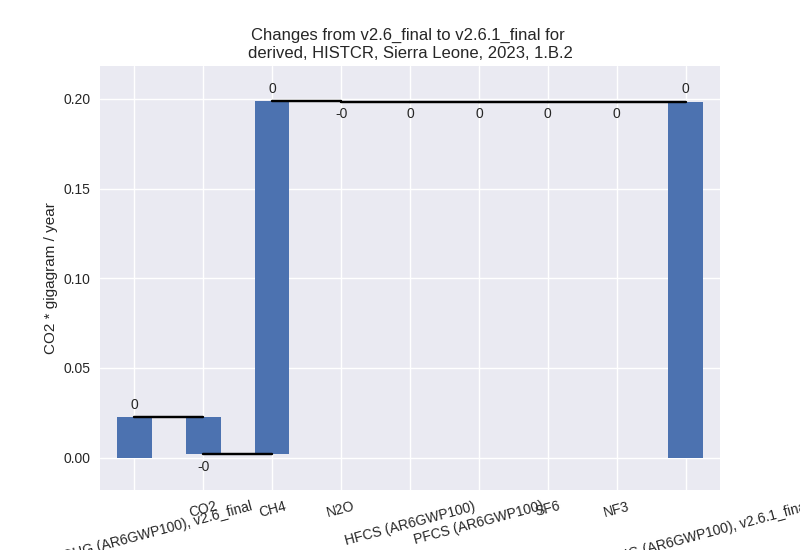
For 1990-2023 the changes per gas are: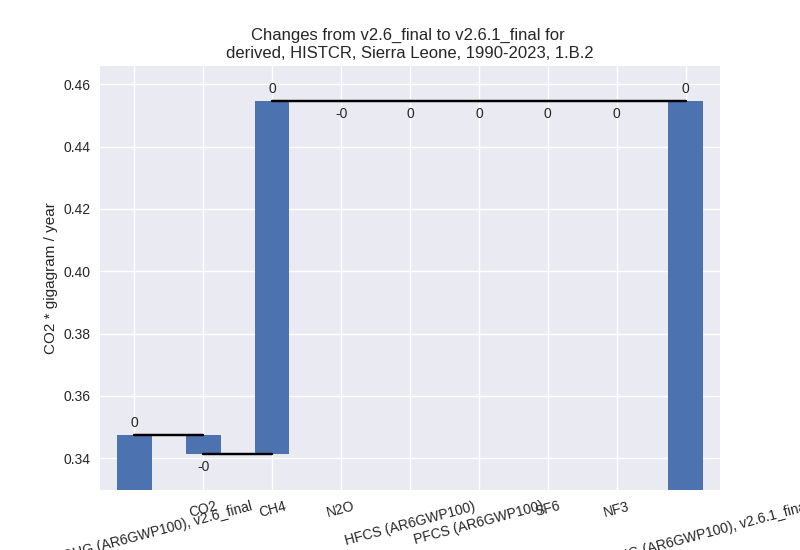
There is no subsector information available in PRIMAP-hist.
- 1.A: Total sectoral emissions in 2022 are 1993.90
Gg CO2 / year which is 63.4% of category 1 emissions. 2023 Emissions
have changed by -16.2% (-376.58 Gg
CO2 / year). 1990-2023 Emissions have changed by -6.3% (-91.57 Gg CO2 / year). For 2023 the
changes per gas
are:
- 2: Total sectoral emissions in 2022 are 15.18 Gg
CO2 / year which is 0.1% of M.0.EL emissions. 2023 Emissions have
changed by -24.8% (-5.11 Gg CO2 /
year). 1990-2023 Emissions have changed by -4.0% (-0.58 Gg CO2 / year). For 2023 the
changes per gas
are:

For 1990-2023 the changes per gas are: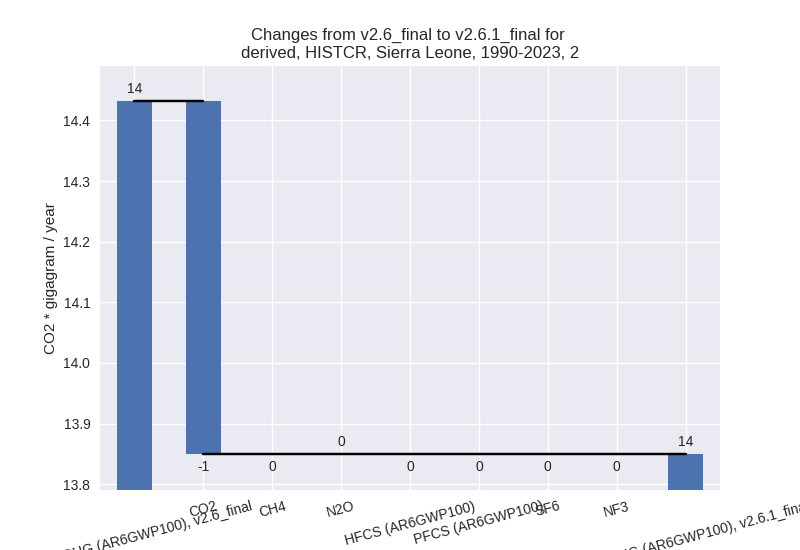
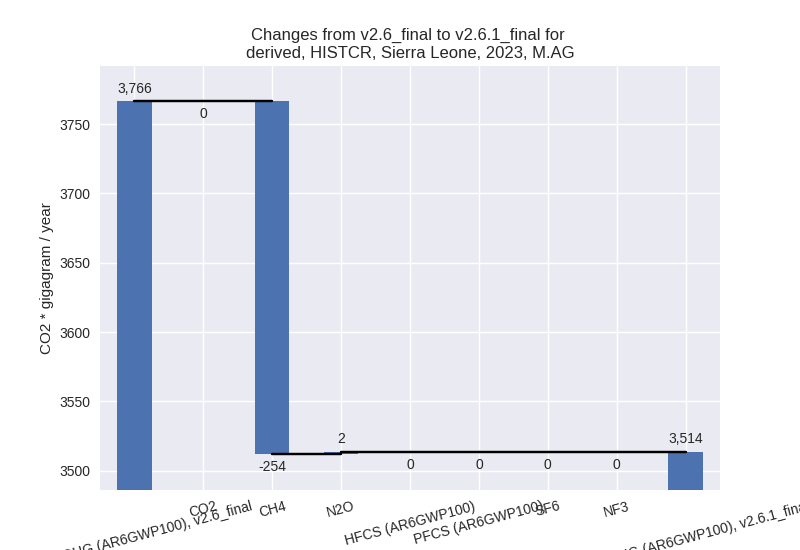
- M.AG: Total sectoral emissions in 2022 are 3469.63
Gg CO2 / year which is 28.6% of M.0.EL emissions. 2023 Emissions have
changed by -6.7% (-252.63 Gg CO2 /
year). 1990-2023 Emissions have changed by -0.9% (-22.14 Gg CO2 / year). For 2023 the
changes per gas
are:
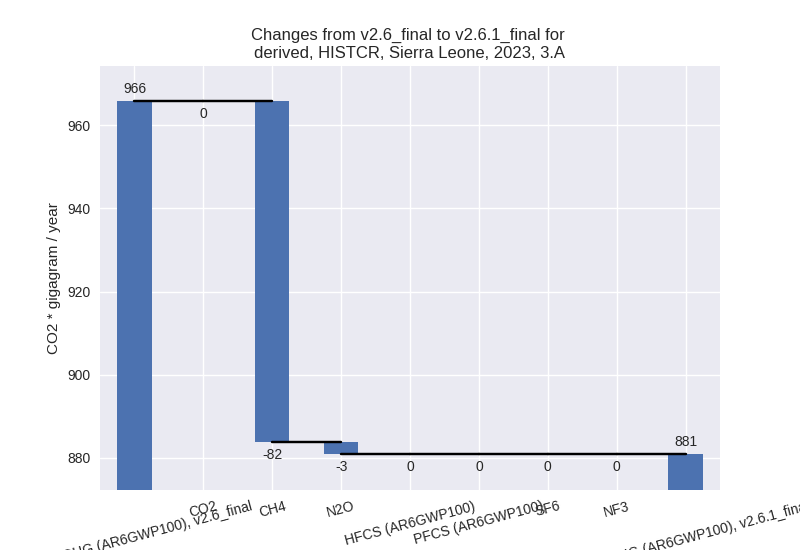
The changes come from the following subsectors:- 3.A: Total sectoral emissions in 2022 are 863.38 Gg
CO2 / year which is 24.9% of category M.AG emissions. 2023 Emissions
have changed by -8.8% (-84.87 Gg CO2
/ year). 1990-2023 Emissions have changed by -0.7% (-3.77 Gg CO2 / year). For 2023 the
changes per gas
are:
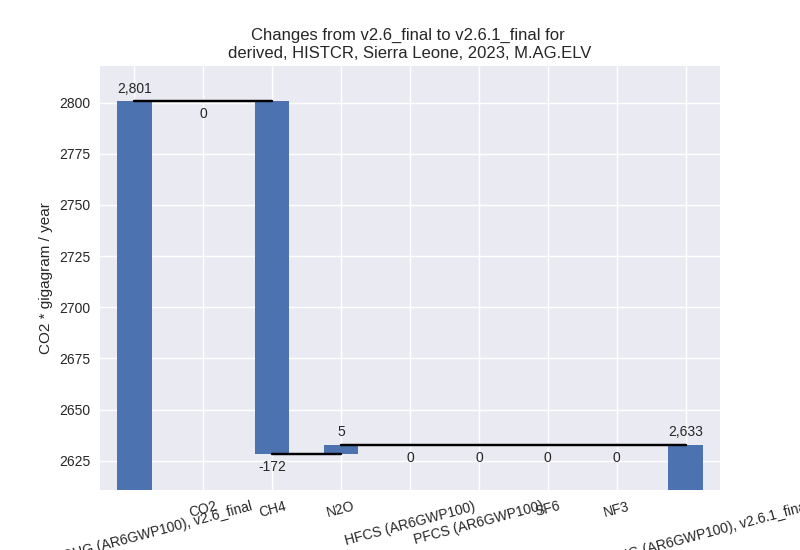
There is no subsector information available in PRIMAP-hist. - M.AG.ELV: Total sectoral emissions in 2022 are
2606.25 Gg CO2 / year which is 75.1% of category M.AG emissions. 2023
Emissions have changed by -6.0%
(-167.76 Gg CO2 / year). 1990-2023 Emissions have changed by -0.9% (-18.37 Gg CO2 / year). For 2023 the
changes per gas
are:
There is no subsector information available in PRIMAP-hist.
- 3.A: Total sectoral emissions in 2022 are 863.38 Gg
CO2 / year which is 24.9% of category M.AG emissions. 2023 Emissions
have changed by -8.8% (-84.87 Gg CO2
/ year). 1990-2023 Emissions have changed by -0.7% (-3.77 Gg CO2 / year). For 2023 the
changes per gas
are:
- 4: Total sectoral emissions in 2022 are 5376.23 Gg CO2 / year which is 44.4% of M.0.EL emissions. 2023 Emissions have changed by 1.9% (102.98 Gg CO2 / year). 1990-2023 Emissions have changed by 1.5% (49.64 Gg CO2 / year).
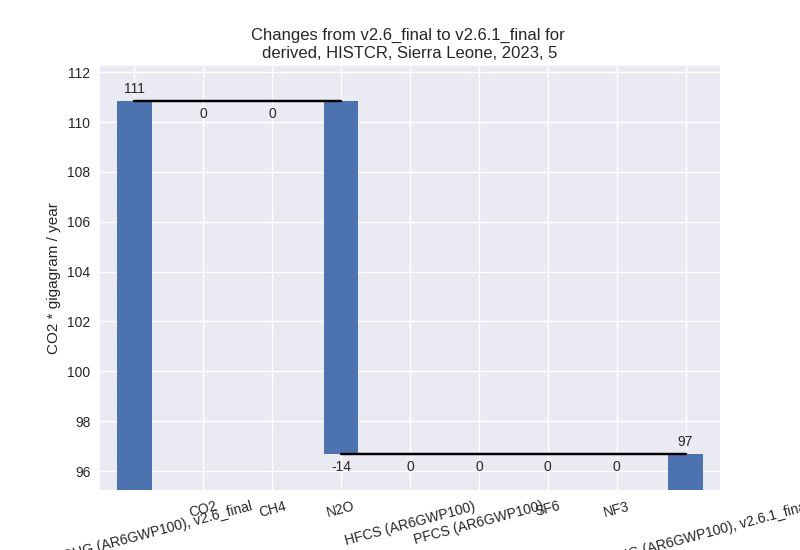
- 5: Total sectoral emissions in 2022 are 107.57 Gg
CO2 / year which is 0.9% of M.0.EL emissions. 2023 Emissions have
changed by -12.8% (-14.16 Gg CO2 /
year). 1990-2023 Emissions have changed by 5.7% (5.64 Gg CO2 / year). For 2023 the
changes per gas
are:
For 1990-2023 the changes per gas are: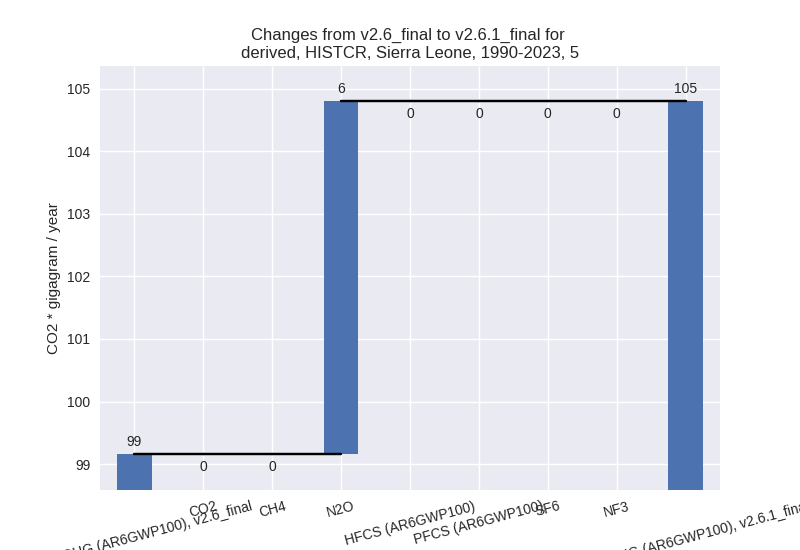
third party scenario (HISTTP):
Most important changes per time frame
For 2023 the following sector-gas combinations have the highest absolute impact on national total KyotoGHG (AR6GWP100) emissions in 2023 (top 5):
- 1: 4, CH4 with -654.19 Gg CO2 / year (-48.6%)
- 2: 1.B.1, CH4 with 593.14 Gg CO2 / year (109.8%)
- 3: 1.A, CH4 with -337.39 Gg CO2 / year (-38.1%)
- 4: M.AG.ELV, CH4 with -172.42 Gg CO2 / year (-10.0%)
- 5: 3.A, CH4 with -115.75 Gg CO2 / year (-8.9%)
For 1990-2023 the following sector-gas combinations have the highest absolute impact on national total KyotoGHG (AR6GWP100) emissions in 1990-2023 (top 5):
- 1: 1.B.1, CH4 with 483.00 Gg CO2 / year (131.7%)
- 2: 4, CH4 with -448.43 Gg CO2 / year (-49.1%)
- 3: 1.A, CH4 with -82.68 Gg CO2 / year (-11.8%)
- 4: M.AG.ELV, CH4 with -17.83 Gg CO2 / year (-1.4%)
- 5: 1.A, N2O with -8.89 Gg CO2 / year (-9.3%)
Changes in the main sectors for aggregate KyotoGHG (AR6GWP100) are
- 1: Total sectoral emissions in 2022 are 3142.70 Gg
CO2 / year which is 39.1% of M.0.EL emissions. 2023 Emissions have
changed by 7.8% (224.60 Gg CO2 /
year). 1990-2023 Emissions have changed by 21.8% (397.95 Gg CO2 / year). For 2023 the
changes per gas
are:

For 1990-2023 the changes per gas are: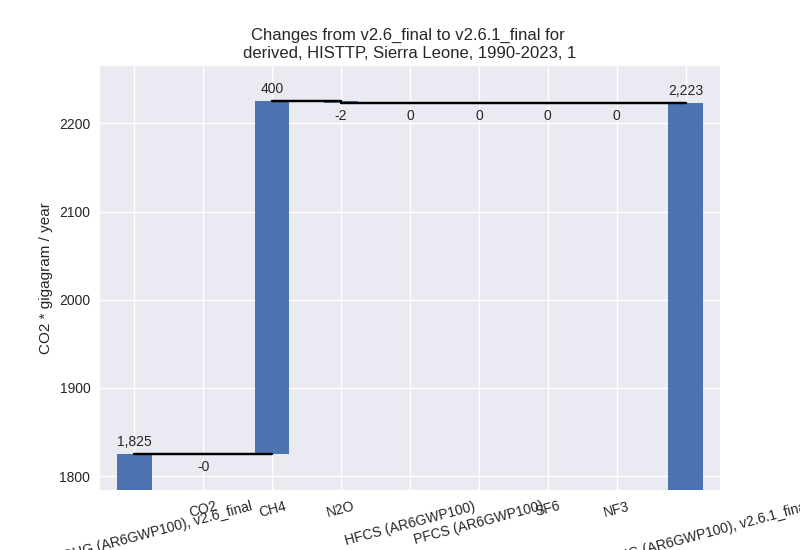
The changes come from the following subsectors:- 1.A: Total sectoral emissions in 2022 are 1993.90
Gg CO2 / year which is 63.4% of category 1 emissions. 2023 Emissions
have changed by -16.2% (-376.58 Gg
CO2 / year). 1990-2023 Emissions have changed by -6.3% (-91.57 Gg CO2 / year). For 2023 the
changes per gas
are:

For 1990-2023 the changes per gas are:
There is no subsector information available in PRIMAP-hist. - 1.B.1: Total sectoral emissions in 2022 are 1148.62
Gg CO2 / year which is 36.5% of category 1 emissions. 2023 Emissions
have changed by 109.8% (601.01 Gg
CO2 / year). 1990-2023 Emissions have changed by 131.7% (489.41 Gg CO2 / year). For 2023
the changes per gas
are:

For 1990-2023 the changes per gas are: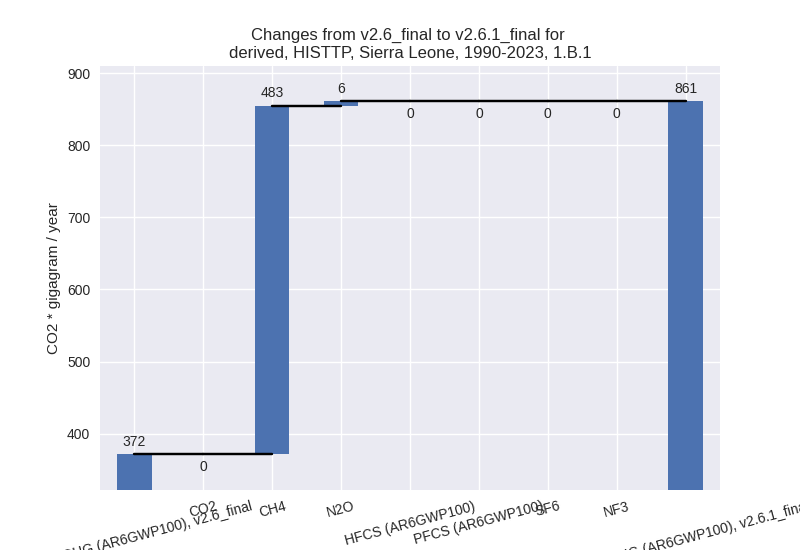
There is no subsector information available in PRIMAP-hist. - 1.B.2: Total sectoral emissions in 2022 are 0.19 Gg
CO2 / year which is 0.0% of category 1 emissions. 2023 Emissions have
changed by 782.2% (0.18 Gg CO2 /
year). 1990-2023 Emissions have changed by 30.8% (0.11 Gg CO2 / year). For 2023 the
changes per gas
are:

For 1990-2023 the changes per gas are:
There is no subsector information available in PRIMAP-hist.
- 1.A: Total sectoral emissions in 2022 are 1993.90
Gg CO2 / year which is 63.4% of category 1 emissions. 2023 Emissions
have changed by -16.2% (-376.58 Gg
CO2 / year). 1990-2023 Emissions have changed by -6.3% (-91.57 Gg CO2 / year). For 2023 the
changes per gas
are:
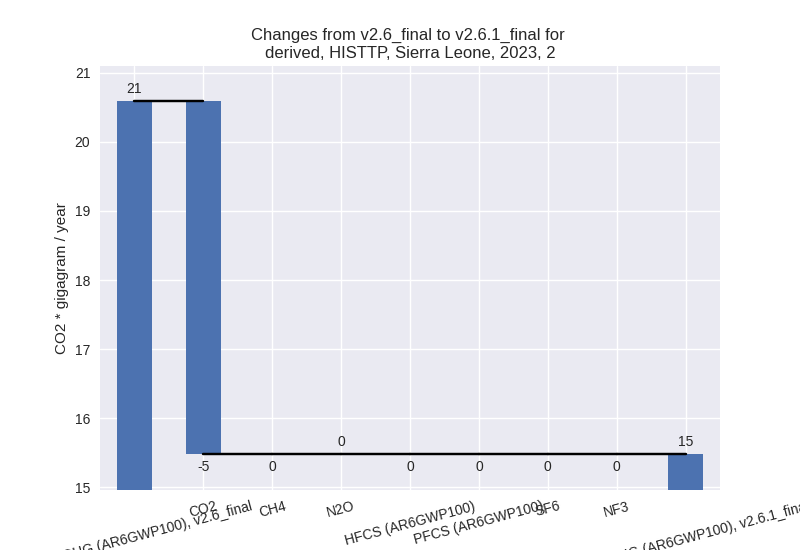
- 2: Total sectoral emissions in 2022 are 15.16 Gg
CO2 / year which is 0.2% of M.0.EL emissions. 2023 Emissions have
changed by -24.8% (-5.11 Gg CO2 /
year). 1990-2023 Emissions have changed by -4.0% (-0.58 Gg CO2 / year). For 2023 the
changes per gas
are:
For 1990-2023 the changes per gas are:
- M.AG: Total sectoral emissions in 2022 are 3809.27
Gg CO2 / year which is 47.3% of M.0.EL emissions. 2023 Emissions have
changed by -6.9% (-286.39 Gg CO2 /
year). 1990-2023 Emissions have changed by -0.8% (-23.62 Gg CO2 / year). For 2023 the
changes per gas
are:

The changes come from the following subsectors:- 3.A: Total sectoral emissions in 2022 are 1203.02
Gg CO2 / year which is 31.6% of category M.AG emissions. 2023 Emissions
have changed by -8.8% (-118.63 Gg
CO2 / year). 1990-2023 Emissions have changed by -0.6% (-5.25 Gg CO2 / year). For 2023 the
changes per gas
are:
There is no subsector information available in PRIMAP-hist. - M.AG.ELV: Total sectoral emissions in 2022 are
2606.25 Gg CO2 / year which is 68.4% of category M.AG emissions. 2023
Emissions have changed by -6.0%
(-167.76 Gg CO2 / year). 1990-2023 Emissions have changed by -0.9% (-18.37 Gg CO2 / year). For 2023 the
changes per gas
are:

There is no subsector information available in PRIMAP-hist.
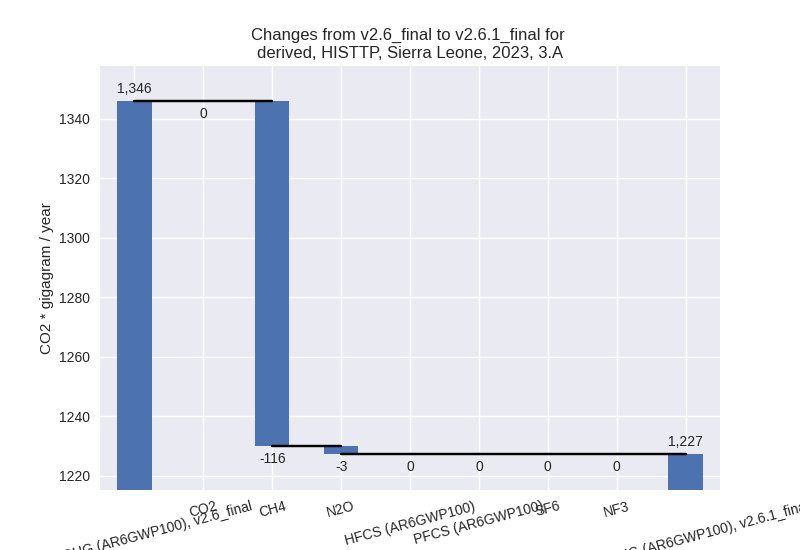
- 3.A: Total sectoral emissions in 2022 are 1203.02
Gg CO2 / year which is 31.6% of category M.AG emissions. 2023 Emissions
have changed by -8.8% (-118.63 Gg
CO2 / year). 1990-2023 Emissions have changed by -0.6% (-5.25 Gg CO2 / year). For 2023 the
changes per gas
are:
- 4: Total sectoral emissions in 2022 are 972.89 Gg
CO2 / year which is 12.1% of M.0.EL emissions. 2023 Emissions have
changed by -39.8% (-654.85 Gg CO2 /
year). 1990-2023 Emissions have changed by -42.0% (-448.53 Gg CO2 / year). For 2023
the changes per gas
are:

For 1990-2023 the changes per gas are:
- 5: Total sectoral emissions in 2022 are 107.57 Gg
CO2 / year which is 1.3% of M.0.EL emissions. 2023 Emissions have
changed by -12.8% (-14.16 Gg CO2 /
year). 1990-2023 Emissions have changed by 5.7% (5.64 Gg CO2 / year). For 2023 the
changes per gas
are:

For 1990-2023 the changes per gas are: