Changes in PRIMAP-hist v2.6.1_final compared to v2.6_final for El Salvador
2025-03-19
Johannes Gütschow
Change analysis for El Salvador for PRIMAP-hist v2.6.1_final compared to v2.6_final
Overview over emissions by sector and gas
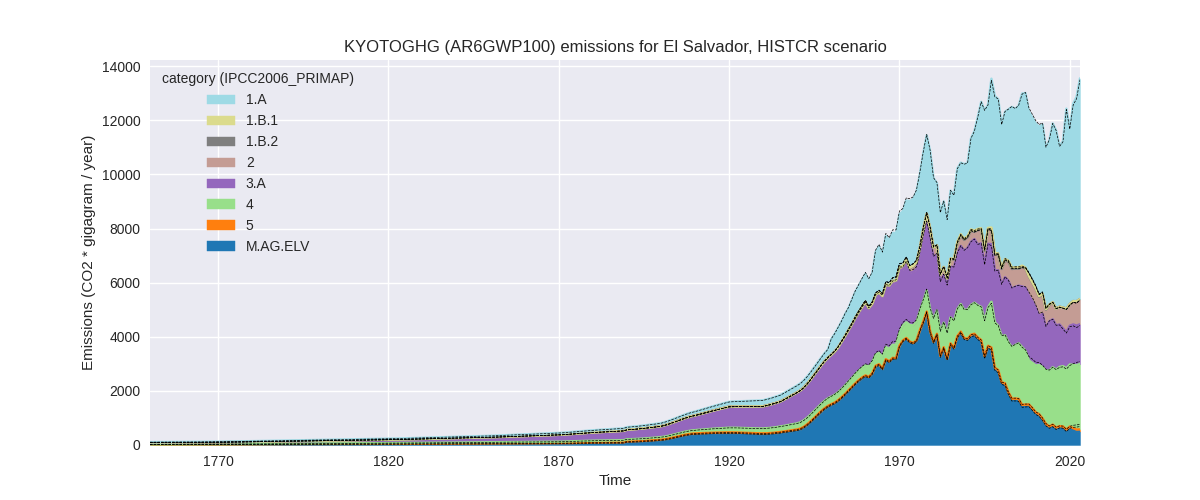
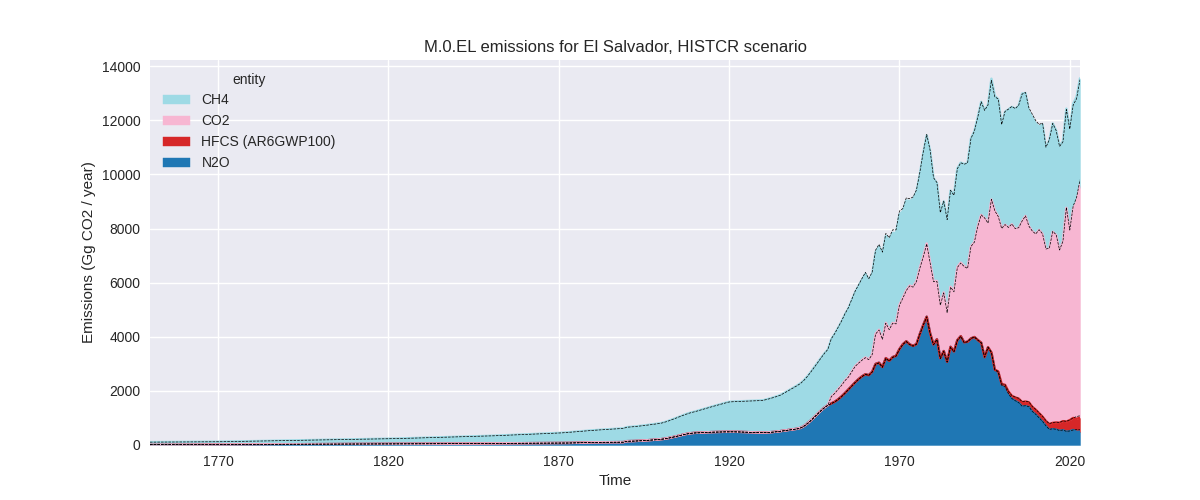
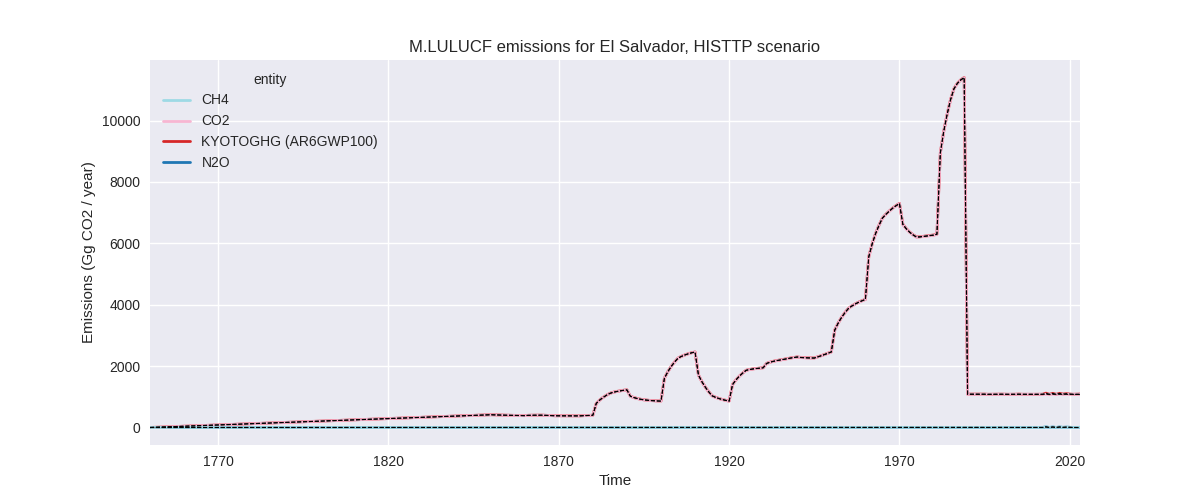
The following figures show the aggregate national total emissions excluding LULUCF AR6GWP100 for the country reported priority scenario. The dotted linesshow the v2.6_final data.
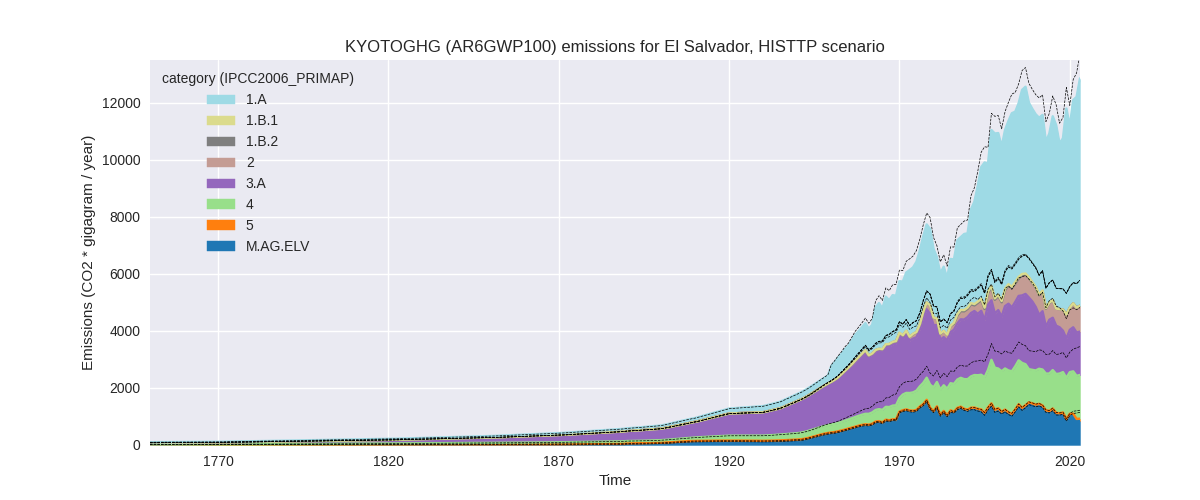
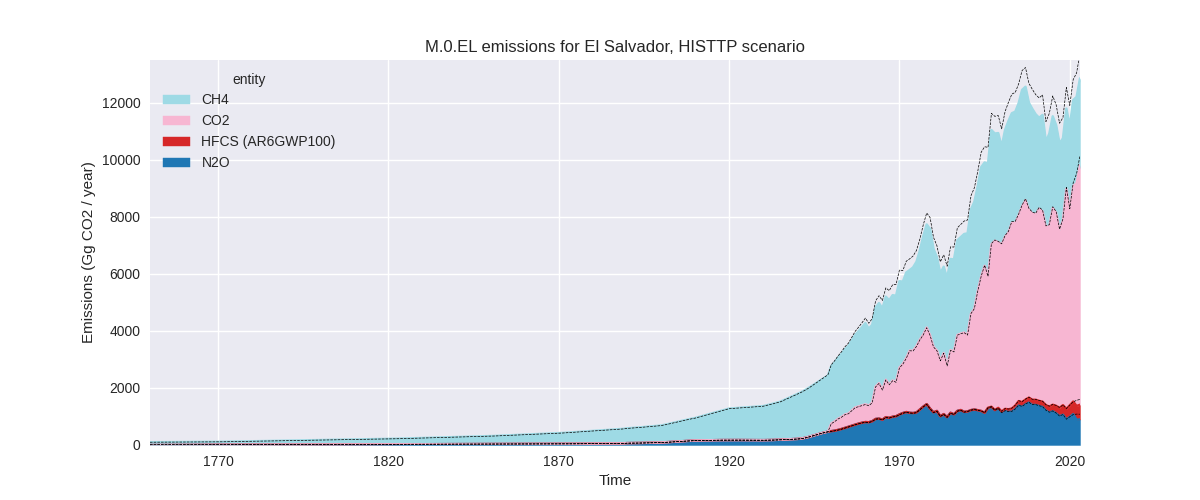
The following figures show the aggregate national total emissions excluding LULUCF AR6GWP100 for the third party priority scenario. The dotted linesshow the v2.6_final data.
Overview over changes
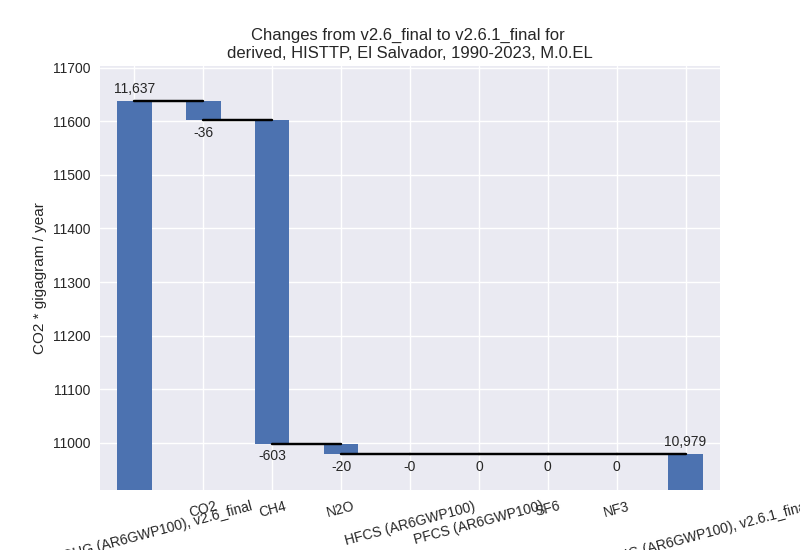
In the country reported priority scenario we have the following changes for aggregate Kyoto GHG and national total emissions excluding LULUCF (M.0.EL):
- Emissions in 2023 have changed by 0.4%% (50.09 Gg CO2 / year)
- Emissions in 1990-2023 have changed by -0.1%% (-9.76 Gg CO2 / year)
In the third party priority scenario we have the following changes for aggregate Kyoto GHG and national total emissions excluding LULUCF (M.0.EL):
- Emissions in 2023 have changed by -6.4%% (-878.40 Gg CO2 / year)
- Emissions in 1990-2023 have changed by -5.7%% (-658.44 Gg CO2 / year)
Most important changes per scenario and time frame
In the country reported priority scenario the following sector-gas combinations have the highest absolute impact on national total KyotoGHG (AR6GWP100) emissions in 2023 (top 5):
- 1: 3.A, CH4 with 149.13 Gg CO2 / year (11.6%)
- 2: M.AG.ELV, CO2 with -118.14 Gg CO2 / year (-38.3%)
- 3: 4, CH4 with 85.47 Gg CO2 / year (3.8%)
- 4: M.AG.ELV, N2O with -65.69 Gg CO2 / year (-22.3%)
- 5: 1.A, CH4 with 9.24 Gg CO2 / year (10.4%)
In the country reported priority scenario the following sector-gas combinations have the highest absolute impact on national total KyotoGHG (AR6GWP100) emissions in 1990-2023 (top 5):
- 1: 3.A, CH4 with 12.52 Gg CO2 / year (0.7%)
- 2: 5, N2O with -9.54 Gg CO2 / year (-10.7%)
- 3: M.AG.ELV, CO2 with -9.05 Gg CO2 / year (-4.4%)
- 4: M.AG.ELV, N2O with -3.64 Gg CO2 / year (-0.2%)
- 5: 2, CO2 with 2.80 Gg CO2 / year (0.6%)
In the third party priority scenario the following sector-gas combinations have the highest absolute impact on national total KyotoGHG (AR6GWP100) emissions in 2023 (top 5):
- 1: 4, CH4 with -697.05 Gg CO2 / year (-32.5%)
- 2: M.AG.ELV, N2O with -179.89 Gg CO2 / year (-22.3%)
- 3: 3.A, CH4 with 154.54 Gg CO2 / year (11.6%)
- 4: M.AG.ELV, CO2 with -118.14 Gg CO2 / year (-38.3%)
- 5: 2, CO2 with -40.09 Gg CO2 / year (-9.2%)
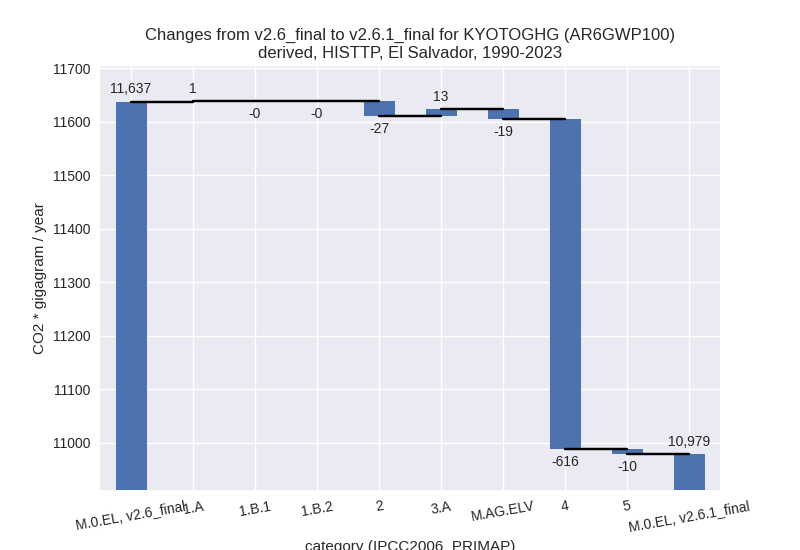
In the third party priority scenario the following sector-gas combinations have the highest absolute impact on national total KyotoGHG (AR6GWP100) emissions in 1990-2023 (top 5):
- 1: 4, CH4 with -616.02 Gg CO2 / year (-32.4%)
- 2: 2, CO2 with -26.59 Gg CO2 / year (-5.9%)
- 3: 3.A, CH4 with 12.97 Gg CO2 / year (0.7%)
- 4: M.AG.ELV, N2O with -10.00 Gg CO2 / year (-1.1%)
- 5: 5, N2O with -9.54 Gg CO2 / year (-10.7%)
Notes on data changes
Here we list notes explaining important emissions changes for the country.
- No new country reported data for El Salvador has been added. Changes in the CR time-series are small and come from updated third party data (EDGAR, FAO) which is used to extrapolate the country reported data.
- In the TP scenario the main change is for waste CH4 and due to updated EDGAR data.
Changes by sector and gas
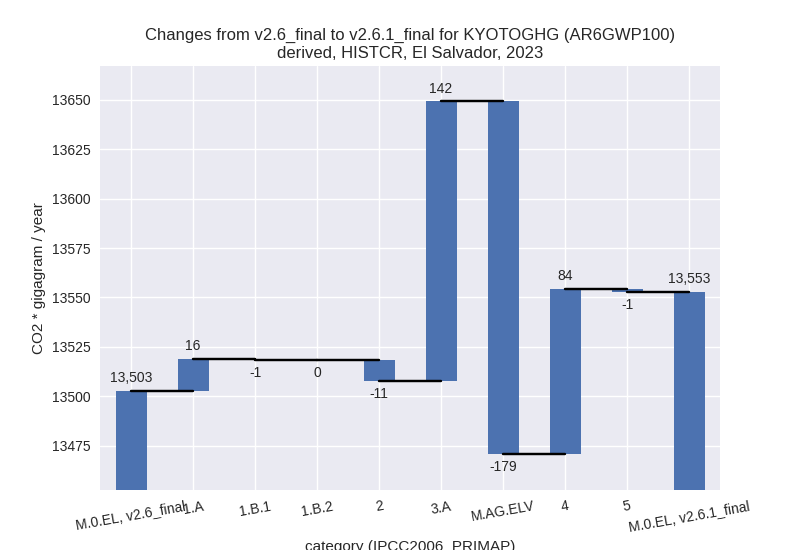
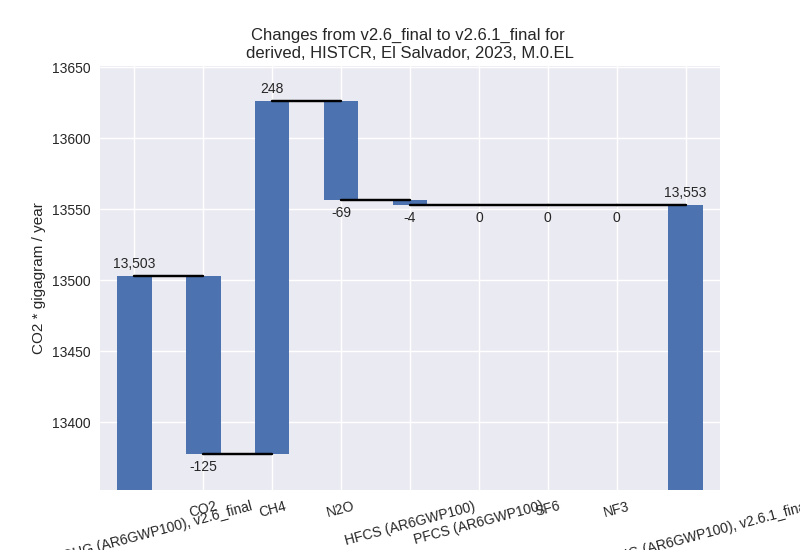
For each scenario and time frame the changes are displayed for all individual sectors and all individual gases. In the sector plot we use aggregate Kyoto GHGs in AR6GWP100. In the gas plot we usenational total emissions without LULUCF.
country reported scenario
2023
1990-2023
third party scenario
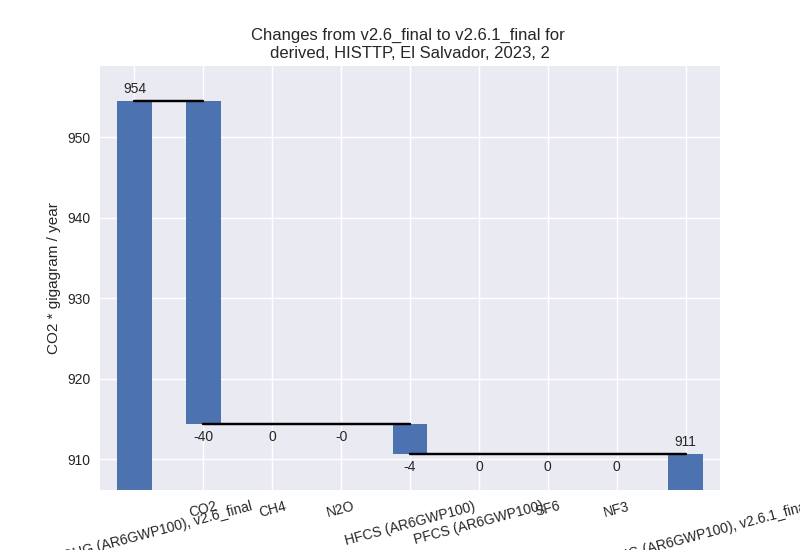
2023
1990-2023
Detailed changes for the scenarios:
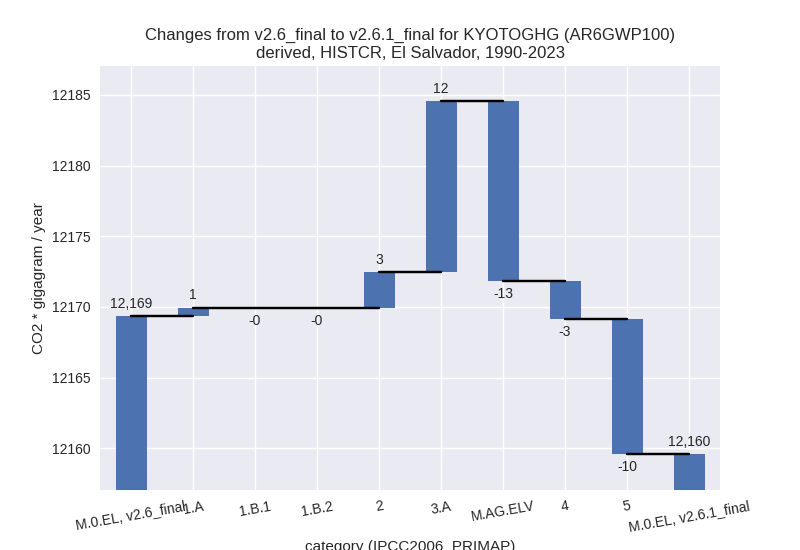
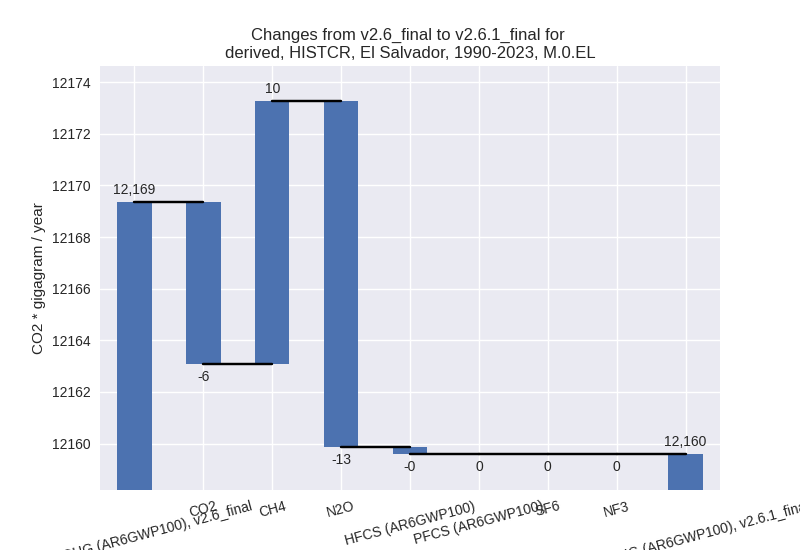
country reported scenario (HISTCR):
Most important changes per time frame
For 2023 the following sector-gas combinations have the highest absolute impact on national total KyotoGHG (AR6GWP100) emissions in 2023 (top 5):
- 1: 3.A, CH4 with 149.13 Gg CO2 / year (11.6%)
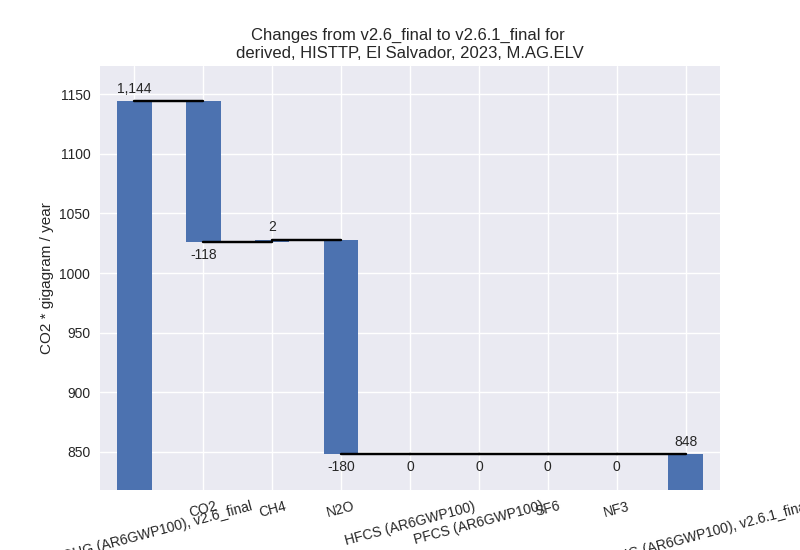
- 2: M.AG.ELV, CO2 with -118.14 Gg CO2 / year (-38.3%)
- 3: 4, CH4 with 85.47 Gg CO2 / year (3.8%)
- 4: M.AG.ELV, N2O with -65.69 Gg CO2 / year (-22.3%)
- 5: 1.A, CH4 with 9.24 Gg CO2 / year (10.4%)
For 1990-2023 the following sector-gas combinations have the highest absolute impact on national total KyotoGHG (AR6GWP100) emissions in 1990-2023 (top 5):
- 1: 3.A, CH4 with 12.52 Gg CO2 / year (0.7%)
- 2: 5, N2O with -9.54 Gg CO2 / year (-10.7%)
- 3: M.AG.ELV, CO2 with -9.05 Gg CO2 / year (-4.4%)
- 4: M.AG.ELV, N2O with -3.64 Gg CO2 / year (-0.2%)
- 5: 2, CO2 with 2.80 Gg CO2 / year (0.6%)
Changes in the main sectors for aggregate KyotoGHG (AR6GWP100) are
- 1: Total sectoral emissions in 2022 are 7560.55 Gg CO2 / year which is 58.7% of M.0.EL emissions. 2023 Emissions have changed by 0.2% (15.63 Gg CO2 / year). 1990-2023 Emissions have changed by 0.0% (0.58 Gg CO2 / year).
- 2: Total sectoral emissions in 2022 are 895.78 Gg CO2 / year which is 7.0% of M.0.EL emissions. 2023 Emissions have changed by -1.1% (-10.79 Gg CO2 / year). 1990-2023 Emissions have changed by 0.4% (2.53 Gg CO2 / year).
- M.AG: Total sectoral emissions in 2022 are 1967.18 Gg CO2 / year which is 15.3% of M.0.EL emissions. 2023 Emissions have changed by -1.8% (-36.96 Gg CO2 / year). 1990-2023 Emissions have changed by -0.0% (-0.66 Gg CO2 / year).
- 4: Total sectoral emissions in 2022 are 2377.64 Gg
CO2 / year which is 18.5% of M.0.EL emissions. 2023 Emissions have
changed by 3.6% (83.69 Gg CO2 /
year). 1990-2023 Emissions have changed by -0.1% (-2.67 Gg CO2 / year). For 2023 the
changes per gas
are:
- 5: Total sectoral emissions in 2022 are 70.62 Gg
CO2 / year which is 0.5% of M.0.EL emissions. 2023 Emissions have
changed by -2.0% (-1.48 Gg CO2 /
year). 1990-2023 Emissions have changed by -10.7% (-9.54 Gg CO2 / year). For
1990-2023 the changes per gas
are:
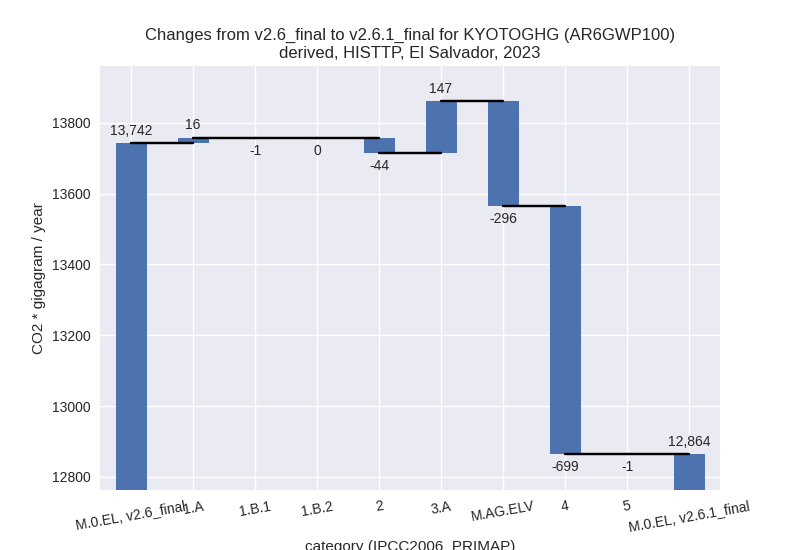
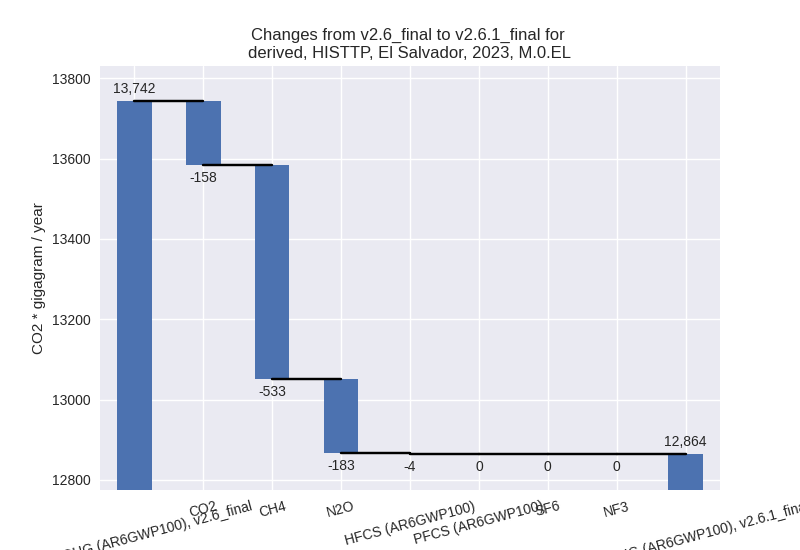
third party scenario (HISTTP):
Most important changes per time frame
For 2023 the following sector-gas combinations have the highest absolute impact on national total KyotoGHG (AR6GWP100) emissions in 2023 (top 5):
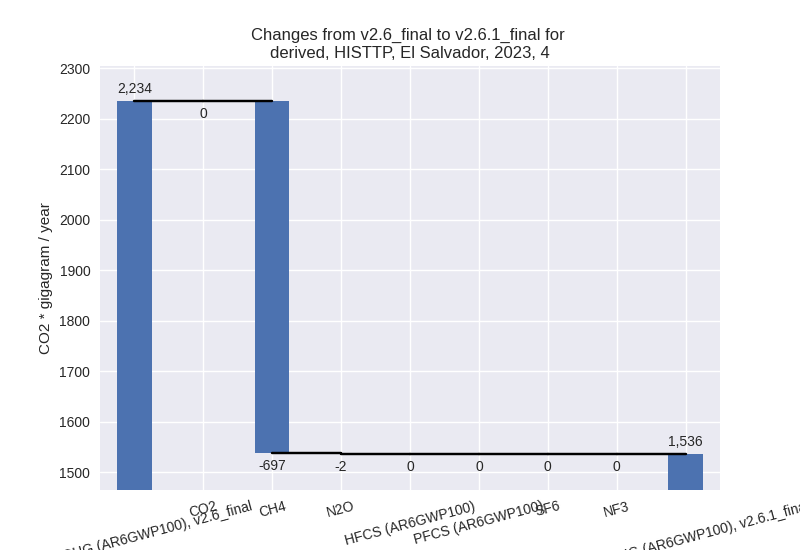
- 1: 4, CH4 with -697.05 Gg CO2 / year (-32.5%)
- 2: M.AG.ELV, N2O with -179.89 Gg CO2 / year (-22.3%)
- 3: 3.A, CH4 with 154.54 Gg CO2 / year (11.6%)
- 4: M.AG.ELV, CO2 with -118.14 Gg CO2 / year (-38.3%)
- 5: 2, CO2 with -40.09 Gg CO2 / year (-9.2%)
For 1990-2023 the following sector-gas combinations have the highest absolute impact on national total KyotoGHG (AR6GWP100) emissions in 1990-2023 (top 5):
- 1: 4, CH4 with -616.02 Gg CO2 / year (-32.4%)
- 2: 2, CO2 with -26.59 Gg CO2 / year (-5.9%)
- 3: 3.A, CH4 with 12.97 Gg CO2 / year (0.7%)
- 4: M.AG.ELV, N2O with -10.00 Gg CO2 / year (-1.1%)
- 5: 5, N2O with -9.54 Gg CO2 / year (-10.7%)
Changes in the main sectors for aggregate KyotoGHG (AR6GWP100) are
- 1: Total sectoral emissions in 2022 are 7391.82 Gg CO2 / year which is 60.5% of M.0.EL emissions. 2023 Emissions have changed by 0.2% (14.94 Gg CO2 / year). 1990-2023 Emissions have changed by 0.0% (0.65 Gg CO2 / year).
- 2: Total sectoral emissions in 2022 are 874.88 Gg
CO2 / year which is 7.2% of M.0.EL emissions. 2023 Emissions have
changed by -4.6% (-43.89 Gg CO2 /
year). 1990-2023 Emissions have changed by -4.3% (-26.86 Gg CO2 / year). For 2023 the
changes per gas
are:
For 1990-2023 the changes per gas are: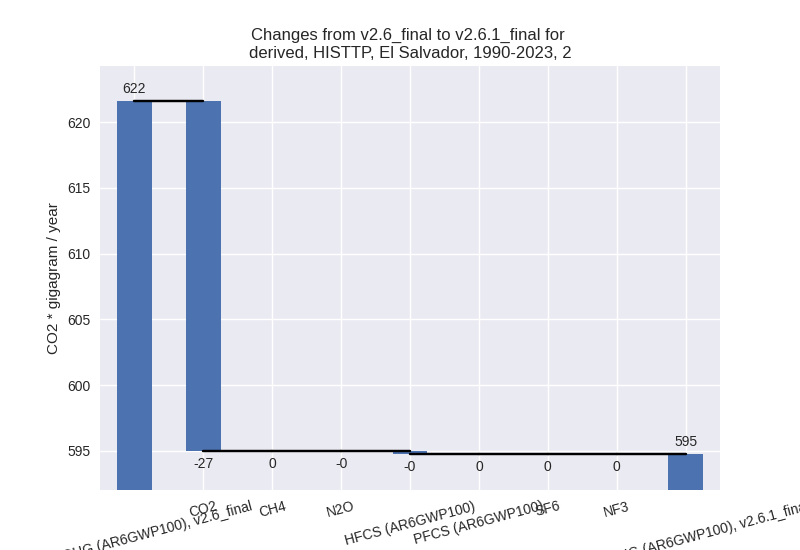
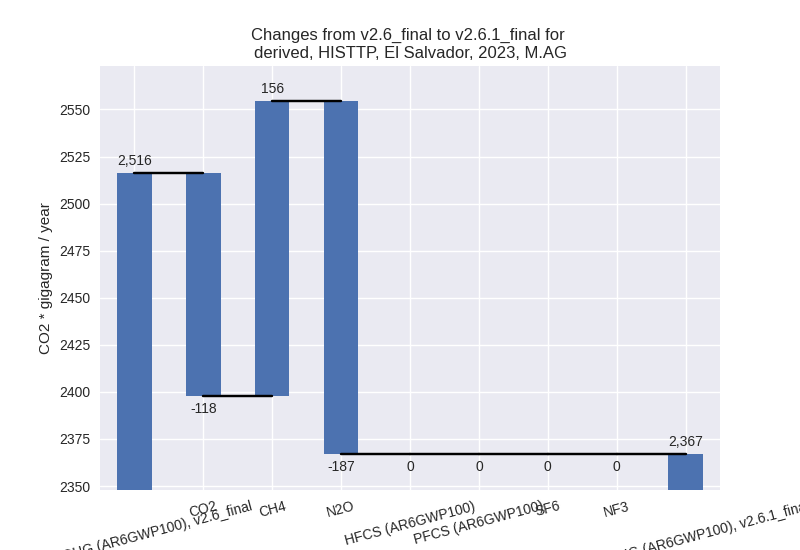
- M.AG: Total sectoral emissions in 2022 are 2363.35
Gg CO2 / year which is 19.4% of M.0.EL emissions. 2023 Emissions have
changed by -5.9% (-149.14 Gg CO2 /
year). 1990-2023 Emissions have changed by -0.2% (-6.54 Gg CO2 / year). For 2023 the
changes per gas
are:
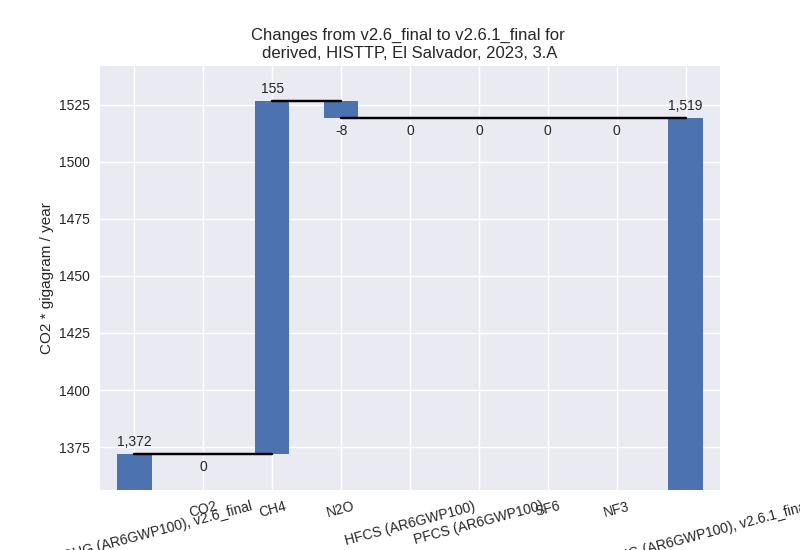
The changes come from the following subsectors:- 3.A: Total sectoral emissions in 2022 are 1518.67
Gg CO2 / year which is 64.3% of category M.AG emissions. 2023 Emissions
have changed by 10.7% (147.01 Gg CO2
/ year). 1990-2023 Emissions have changed by 0.6% (12.54 Gg CO2 / year). For 2023 the
changes per gas
are:
There is no subsector information available in PRIMAP-hist. - M.AG.ELV: Total sectoral emissions in 2022 are
844.68 Gg CO2 / year which is 35.7% of category M.AG emissions. 2023
Emissions have changed by -25.9%
(-296.15 Gg CO2 / year). 1990-2023 Emissions have changed by -1.6% (-19.08 Gg CO2 / year). For 2023 the
changes per gas
are:
There is no subsector information available in PRIMAP-hist.
- 3.A: Total sectoral emissions in 2022 are 1518.67
Gg CO2 / year which is 64.3% of category M.AG emissions. 2023 Emissions
have changed by 10.7% (147.01 Gg CO2
/ year). 1990-2023 Emissions have changed by 0.6% (12.54 Gg CO2 / year). For 2023 the
changes per gas
are:
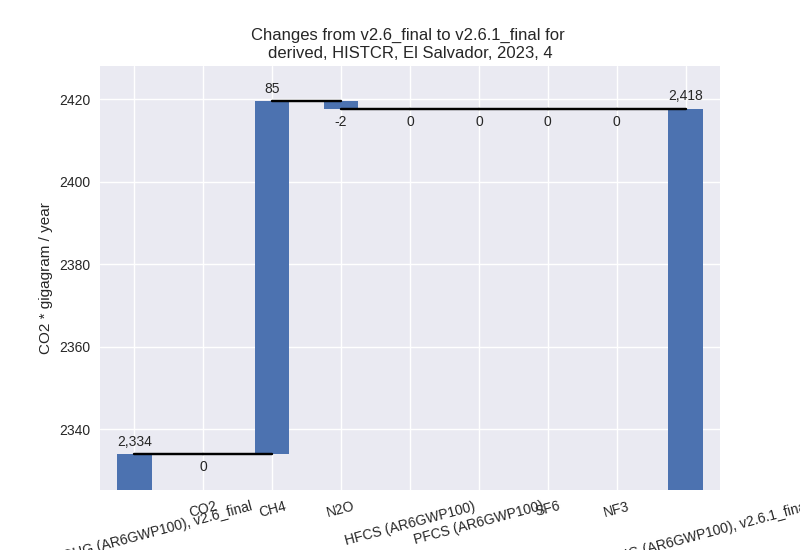
- 4: Total sectoral emissions in 2022 are 1510.48 Gg
CO2 / year which is 12.4% of M.0.EL emissions. 2023 Emissions have
changed by -31.3% (-698.82 Gg CO2 /
year). 1990-2023 Emissions have changed by -31.2% (-616.15 Gg CO2 / year). For 2023
the changes per gas
are:
For 1990-2023 the changes per gas are:
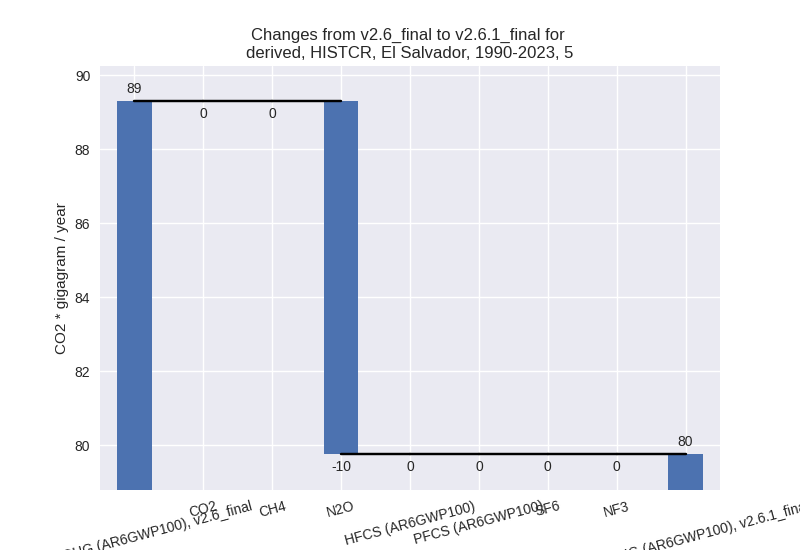
- 5: Total sectoral emissions in 2022 are 70.62 Gg
CO2 / year which is 0.6% of M.0.EL emissions. 2023 Emissions have
changed by -2.0% (-1.48 Gg CO2 /
year). 1990-2023 Emissions have changed by -10.7% (-9.54 Gg CO2 / year). For
1990-2023 the changes per gas
are:
