Changes in PRIMAP-hist v2.6.1_final compared to v2.6_final for San Marino
2025-03-19
Johannes Gütschow
Change analysis for San Marino for PRIMAP-hist v2.6.1_final compared to v2.6_final
Overview over emissions by sector and gas
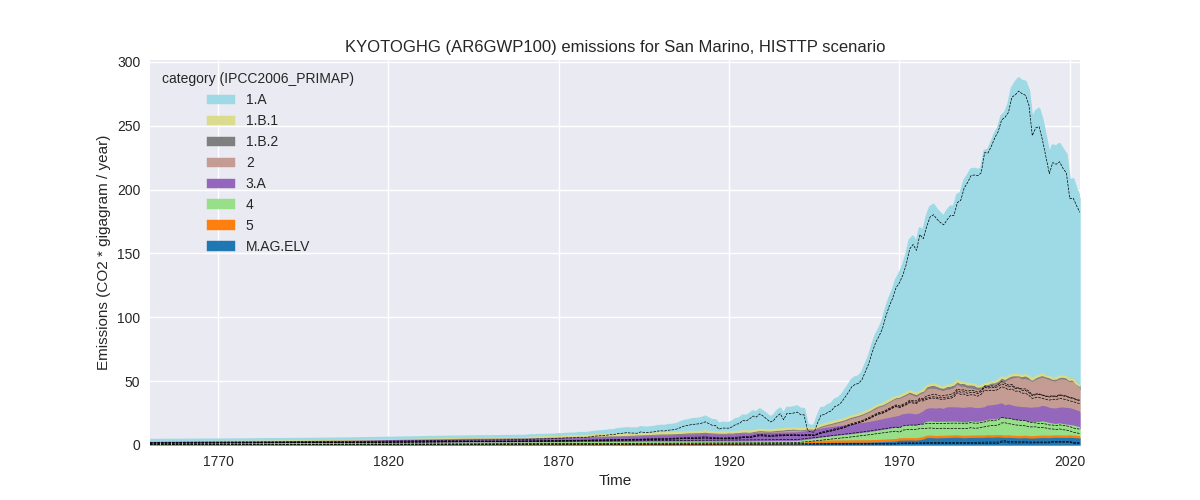
The following figures show the aggregate national total emissions excluding LULUCF AR6GWP100 for the country reported priority scenario. The dotted linesshow the v2.6_final data.

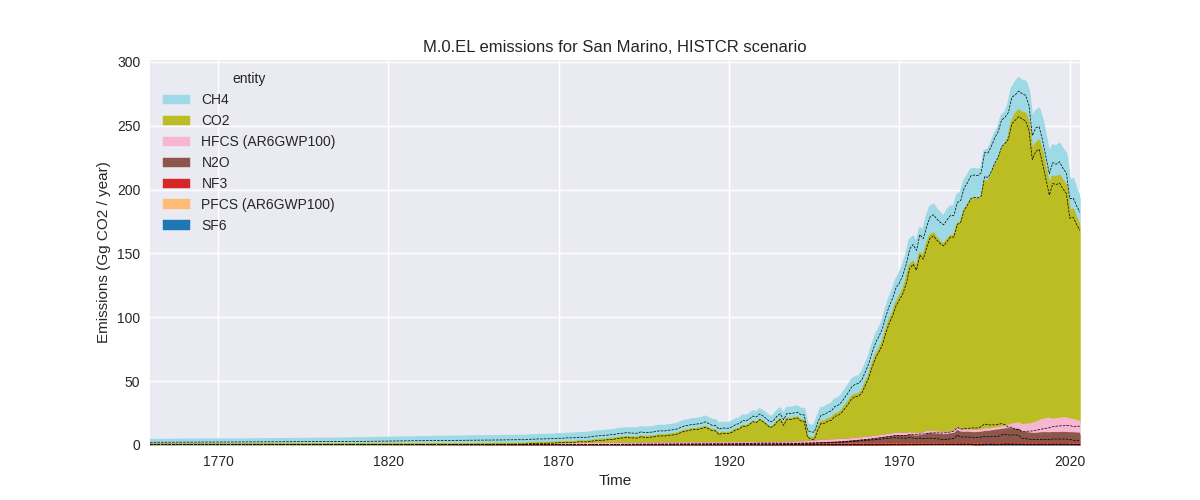

The following figures show the aggregate national total emissions excluding LULUCF AR6GWP100 for the third party priority scenario. The dotted linesshow the v2.6_final data.

Overview over changes
In the country reported priority scenario we have the following changes for aggregate Kyoto GHG and national total emissions excluding LULUCF (M.0.EL):
- Emissions in 2023 have changed by 6.2%% (11.37 Gg CO2 / year)
- Emissions in 1990-2023 have changed by 4.0%% (9.28 Gg CO2 / year)
In the third party priority scenario we have the following changes for aggregate Kyoto GHG and national total emissions excluding LULUCF (M.0.EL):
- Emissions in 2023 have changed by 6.2%% (11.37 Gg CO2 / year)
- Emissions in 1990-2023 have changed by 4.0%% (9.28 Gg CO2 / year)
Most important changes per scenario and time frame
In the country reported priority scenario the following sector-gas combinations have the highest absolute impact on national total KyotoGHG (AR6GWP100) emissions in 2023 (top 5):
- 1: 3.A, CH4 with 8.38 Gg CO2 / year (270.4%)
- 2: M.AG.ELV, N2O with 4.39 Gg CO2 / year (inf%)
- 3: 2, HFCS (AR6GWP100) with -1.75 Gg CO2 / year (-15.7%)
- 4: 3.A, N2O with 0.63 Gg CO2 / year (230.2%)
- 5: 4, CH4 with -0.28 Gg CO2 / year (-4.5%)
In the country reported priority scenario the following sector-gas combinations have the highest absolute impact on national total KyotoGHG (AR6GWP100) emissions in 1990-2023 (top 5):
- 1: 3.A, CH4 with 7.29 Gg CO2 / year (215.7%)
- 2: M.AG.ELV, N2O with 4.10 Gg CO2 / year (1199.0%)
- 3: 2, HFCS (AR6GWP100) with -2.43 Gg CO2 / year (-29.4%)
- 4: 3.A, N2O with 0.56 Gg CO2 / year (216.6%)
- 5: 4, CH4 with -0.53 Gg CO2 / year (-5.1%)
In the third party priority scenario the following sector-gas combinations have the highest absolute impact on national total KyotoGHG (AR6GWP100) emissions in 2023 (top 5):
- 1: 3.A, CH4 with 8.38 Gg CO2 / year (270.4%)
- 2: M.AG.ELV, N2O with 4.39 Gg CO2 / year (inf%)
- 3: 2, HFCS (AR6GWP100) with -1.75 Gg CO2 / year (-15.7%)
- 4: 3.A, N2O with 0.63 Gg CO2 / year (230.2%)
- 5: 4, CH4 with -0.28 Gg CO2 / year (-4.5%)
In the third party priority scenario the following sector-gas combinations have the highest absolute impact on national total KyotoGHG (AR6GWP100) emissions in 1990-2023 (top 5):
- 1: 3.A, CH4 with 7.29 Gg CO2 / year (215.7%)
- 2: M.AG.ELV, N2O with 4.10 Gg CO2 / year (1199.0%)
- 3: 2, HFCS (AR6GWP100) with -2.43 Gg CO2 / year (-29.4%)
- 4: 3.A, N2O with 0.56 Gg CO2 / year (216.6%)
- 5: 4, CH4 with -0.53 Gg CO2 / year (-5.1%)
Notes on data changes
Here we list notes explaining important emissions changes for the country.
- There is no usable country reported data for San Marino, thus the CR and TP time-series are identical.
- FAOSTAT data has changed gas and sector coverage leading to high changes because FAO data differs from EDGFAR which is used where no FAO data is available.
- HFCS emission are different, because they have changed in EDGAR data.
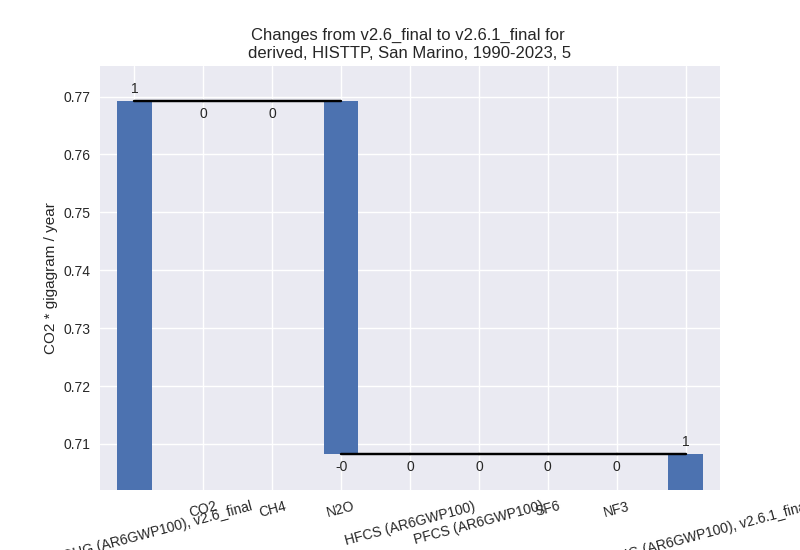
Changes by sector and gas
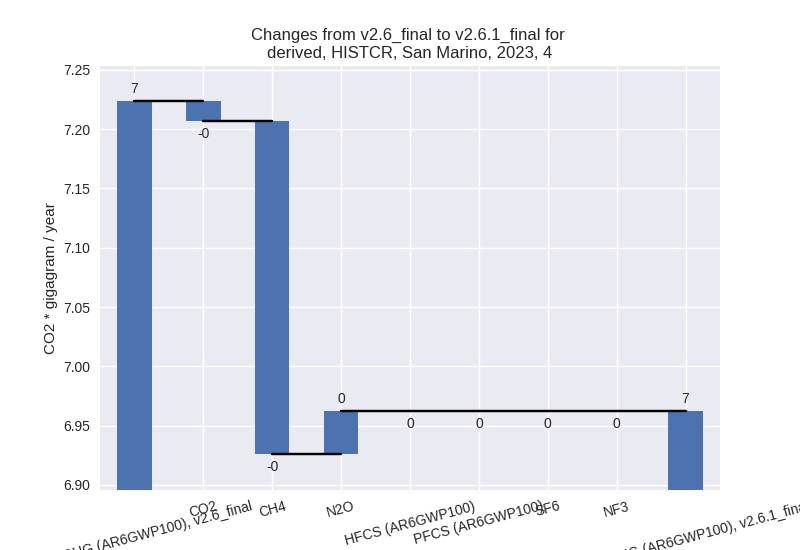
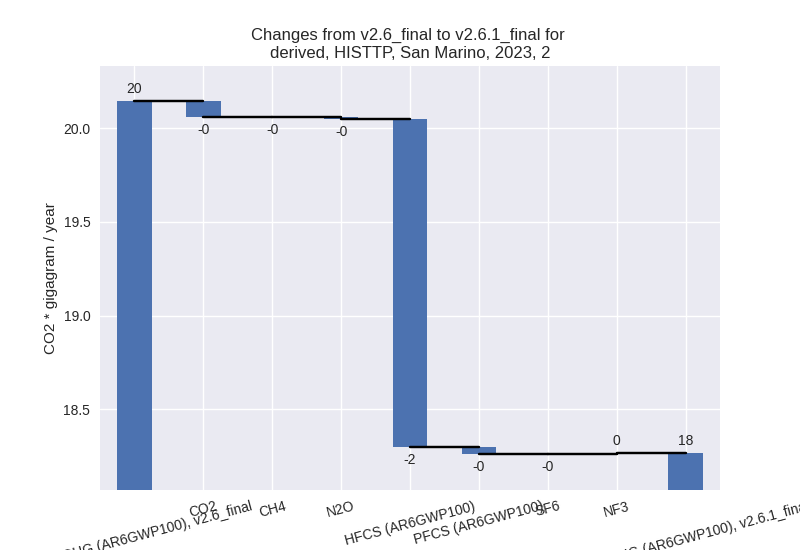
For each scenario and time frame the changes are displayed for all individual sectors and all individual gases. In the sector plot we use aggregate Kyoto GHGs in AR6GWP100. In the gas plot we usenational total emissions without LULUCF.
country reported scenario
2023

1990-2023


third party scenario
2023

1990-2023
Detailed changes for the scenarios:
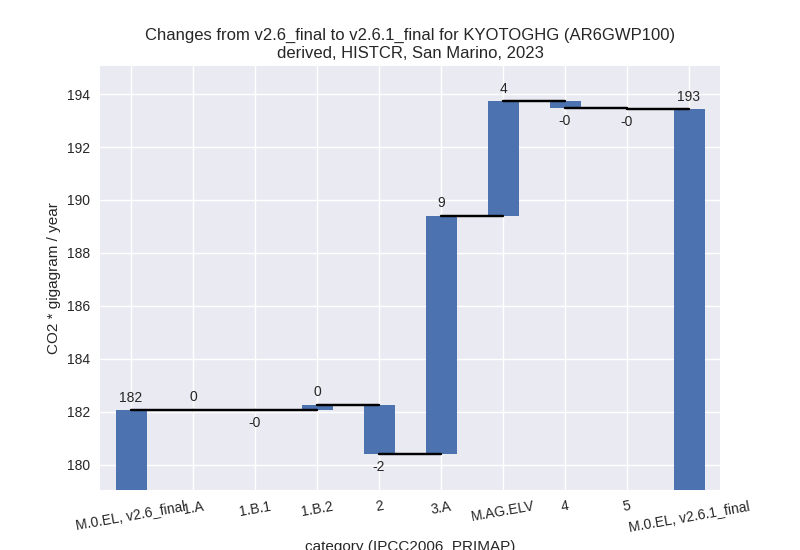
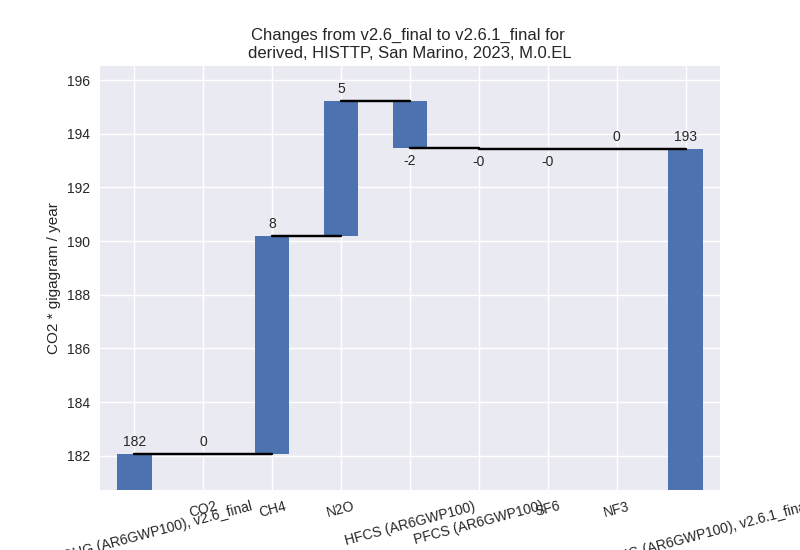
country reported scenario (HISTCR):
Most important changes per time frame
For 2023 the following sector-gas combinations have the highest absolute impact on national total KyotoGHG (AR6GWP100) emissions in 2023 (top 5):
- 1: 3.A, CH4 with 8.38 Gg CO2 / year (270.4%)
- 2: M.AG.ELV, N2O with 4.39 Gg CO2 / year (inf%)
- 3: 2, HFCS (AR6GWP100) with -1.75 Gg CO2 / year (-15.7%)
- 4: 3.A, N2O with 0.63 Gg CO2 / year (230.2%)
- 5: 4, CH4 with -0.28 Gg CO2 / year (-4.5%)
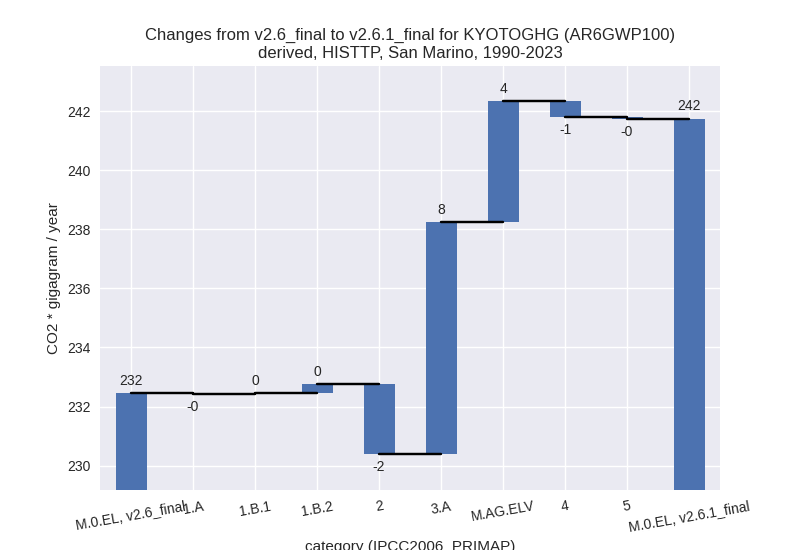
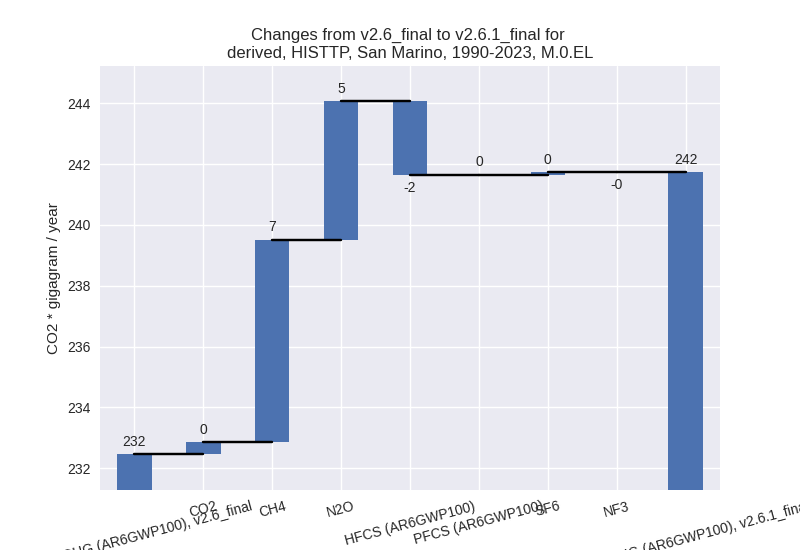
For 1990-2023 the following sector-gas combinations have the highest absolute impact on national total KyotoGHG (AR6GWP100) emissions in 1990-2023 (top 5):
- 1: 3.A, CH4 with 7.29 Gg CO2 / year (215.7%)
- 2: M.AG.ELV, N2O with 4.10 Gg CO2 / year (1199.0%)
- 3: 2, HFCS (AR6GWP100) with -2.43 Gg CO2 / year (-29.4%)
- 4: 3.A, N2O with 0.56 Gg CO2 / year (216.6%)
- 5: 4, CH4 with -0.53 Gg CO2 / year (-5.1%)
Changes in the main sectors for aggregate KyotoGHG (AR6GWP100) are
- 1: Total sectoral emissions in 2022 are 154.61 Gg CO2 / year which is 77.3% of M.0.EL emissions. 2023 Emissions have changed by 0.1% (0.21 Gg CO2 / year). 1990-2023 Emissions have changed by 0.2% (0.29 Gg CO2 / year).
- 2: Total sectoral emissions in 2022 are 19.27 Gg
CO2 / year which is 9.6% of M.0.EL emissions. 2023 Emissions have
changed by -9.3% (-1.88 Gg CO2 /
year). 1990-2023 Emissions have changed by -11.0% (-2.36 Gg CO2 / year). For 2023 the
changes per gas
are:

For 1990-2023 the changes per gas are:
- M.AG: Total sectoral emissions in 2022 are 18.21 Gg
CO2 / year which is 9.1% of M.0.EL emissions. 2023 Emissions have
changed by 283.7% (13.34 Gg CO2 /
year). 1990-2023 Emissions have changed by 225.6% (11.94 Gg CO2 / year). For 2023 the
changes per gas
are:
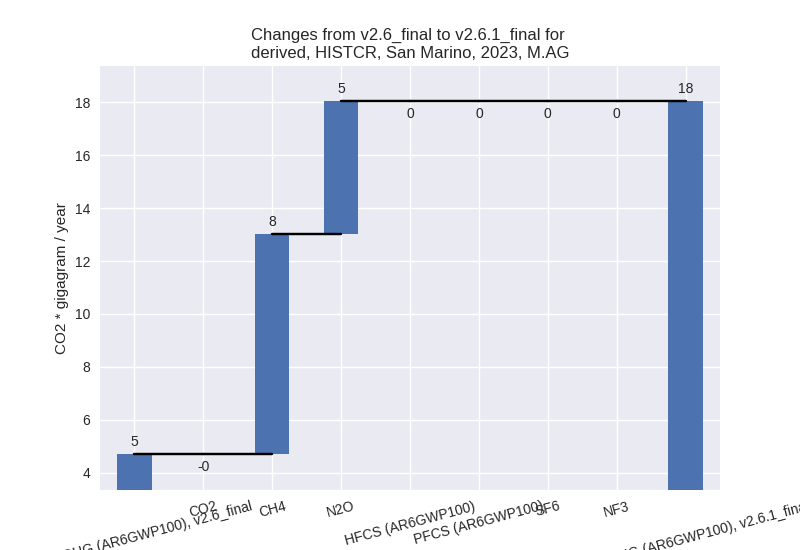
For 1990-2023 the changes per gas are: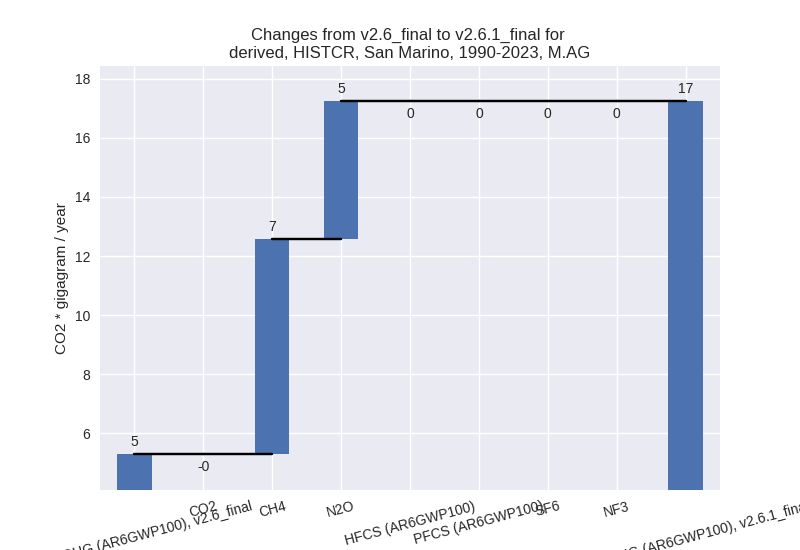
The changes come from the following subsectors:- 3.A: Total sectoral emissions in 2022 are 12.51 Gg
CO2 / year which is 68.7% of category M.AG emissions. 2023 Emissions
have changed by 267.1% (9.01 Gg CO2
/ year). 1990-2023 Emissions have changed by 215.8% (7.85 Gg CO2 / year). For 2023 the
changes per gas
are:
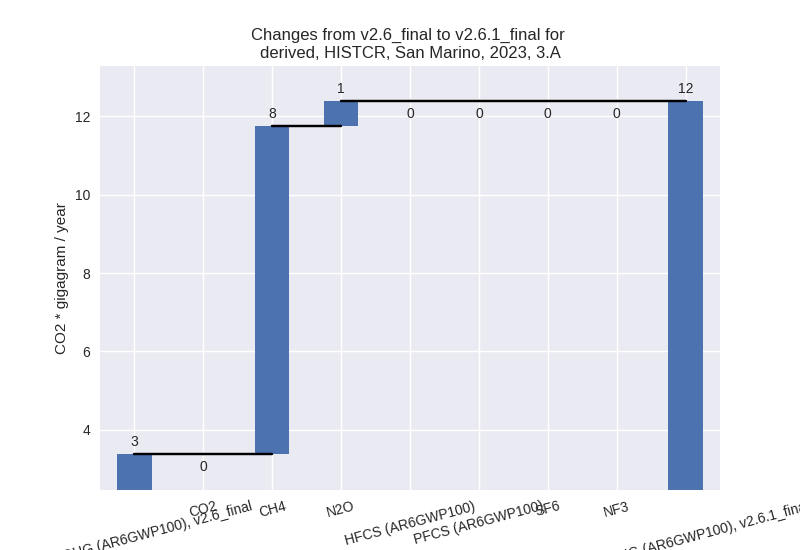
For 1990-2023 the changes per gas are: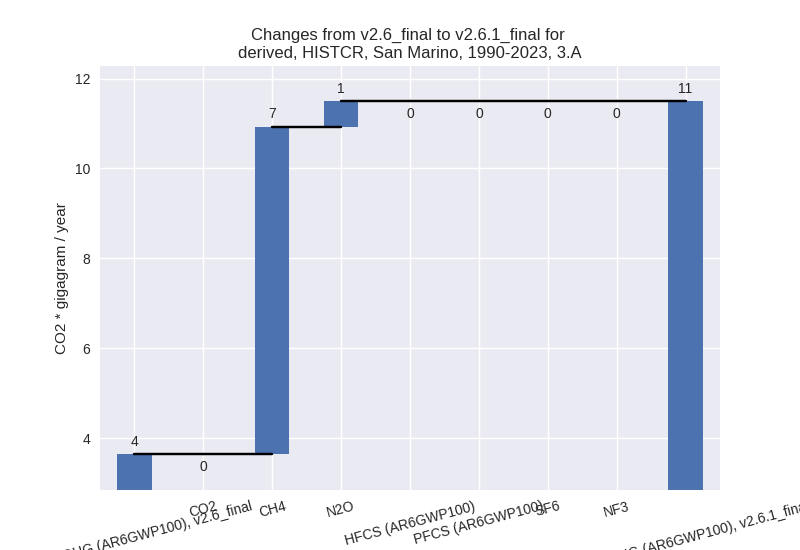
There is no subsector information available in PRIMAP-hist. - M.AG.ELV: Total sectoral emissions in 2022 are 5.71
Gg CO2 / year which is 31.3% of category M.AG emissions. 2023 Emissions
have changed by 325.7% (4.33 Gg CO2
/ year). 1990-2023 Emissions have changed by 247.3% (4.09 Gg CO2 / year). For 2023 the
changes per gas
are:

For 1990-2023 the changes per gas are:
There is no subsector information available in PRIMAP-hist.
- 3.A: Total sectoral emissions in 2022 are 12.51 Gg
CO2 / year which is 68.7% of category M.AG emissions. 2023 Emissions
have changed by 267.1% (9.01 Gg CO2
/ year). 1990-2023 Emissions have changed by 215.8% (7.85 Gg CO2 / year). For 2023 the
changes per gas
are:
- 4: Total sectoral emissions in 2022 are 7.44 Gg CO2
/ year which is 3.7% of M.0.EL emissions. 2023 Emissions have changed by
-3.6% (-0.26 Gg CO2 / year).
1990-2023 Emissions have changed by -4.7% (-0.53 Gg CO2 / year). For 2023 the
changes per gas
are:
For 1990-2023 the changes per gas are:
- 5: Total sectoral emissions in 2022 are 0.48 Gg CO2
/ year which is 0.2% of M.0.EL emissions. 2023 Emissions have changed by
-8.5% (-0.04 Gg CO2 / year).
1990-2023 Emissions have changed by -7.9% (-0.06 Gg CO2 / year). For 2023 the
changes per gas
are:

For 1990-2023 the changes per gas are:
third party scenario (HISTTP):
Most important changes per time frame
For 2023 the following sector-gas combinations have the highest absolute impact on national total KyotoGHG (AR6GWP100) emissions in 2023 (top 5):
- 1: 3.A, CH4 with 8.38 Gg CO2 / year (270.4%)
- 2: M.AG.ELV, N2O with 4.39 Gg CO2 / year (inf%)
- 3: 2, HFCS (AR6GWP100) with -1.75 Gg CO2 / year (-15.7%)
- 4: 3.A, N2O with 0.63 Gg CO2 / year (230.2%)
- 5: 4, CH4 with -0.28 Gg CO2 / year (-4.5%)
For 1990-2023 the following sector-gas combinations have the highest absolute impact on national total KyotoGHG (AR6GWP100) emissions in 1990-2023 (top 5):
- 1: 3.A, CH4 with 7.29 Gg CO2 / year (215.7%)
- 2: M.AG.ELV, N2O with 4.10 Gg CO2 / year (1199.0%)
- 3: 2, HFCS (AR6GWP100) with -2.43 Gg CO2 / year (-29.4%)
- 4: 3.A, N2O with 0.56 Gg CO2 / year (216.6%)
- 5: 4, CH4 with -0.53 Gg CO2 / year (-5.1%)
Changes in the main sectors for aggregate KyotoGHG (AR6GWP100) are
- 1: Total sectoral emissions in 2022 are 154.61 Gg CO2 / year which is 77.3% of M.0.EL emissions. 2023 Emissions have changed by 0.1% (0.21 Gg CO2 / year). 1990-2023 Emissions have changed by 0.2% (0.29 Gg CO2 / year).
- 2: Total sectoral emissions in 2022 are 19.27 Gg
CO2 / year which is 9.6% of M.0.EL emissions. 2023 Emissions have
changed by -9.3% (-1.88 Gg CO2 /
year). 1990-2023 Emissions have changed by -11.0% (-2.36 Gg CO2 / year). For 2023 the
changes per gas
are:
For 1990-2023 the changes per gas are: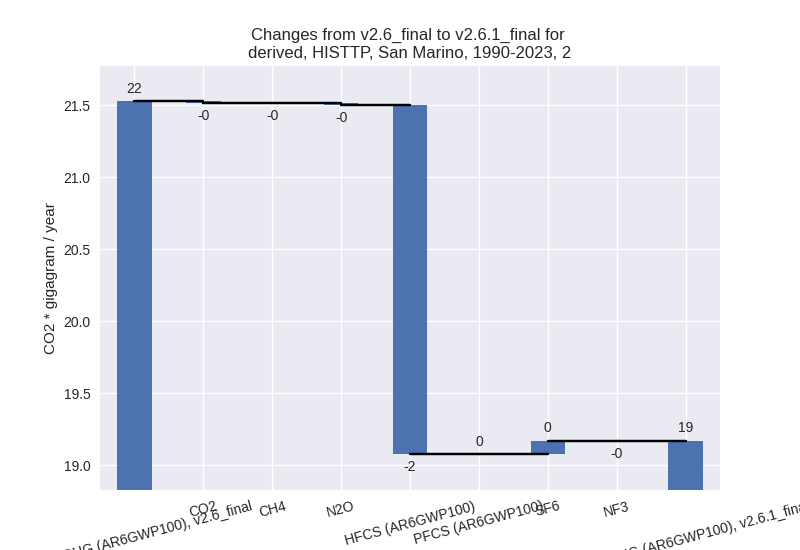
- M.AG: Total sectoral emissions in 2022 are 18.21 Gg
CO2 / year which is 9.1% of M.0.EL emissions. 2023 Emissions have
changed by 283.7% (13.34 Gg CO2 /
year). 1990-2023 Emissions have changed by 225.6% (11.94 Gg CO2 / year). For 2023 the
changes per gas
are:

For 1990-2023 the changes per gas are:
The changes come from the following subsectors:- 3.A: Total sectoral emissions in 2022 are 12.51 Gg
CO2 / year which is 68.7% of category M.AG emissions. 2023 Emissions
have changed by 267.1% (9.01 Gg CO2
/ year). 1990-2023 Emissions have changed by 215.8% (7.85 Gg CO2 / year). For 2023 the
changes per gas
are:

For 1990-2023 the changes per gas are:
There is no subsector information available in PRIMAP-hist. - M.AG.ELV: Total sectoral emissions in 2022 are 5.71
Gg CO2 / year which is 31.3% of category M.AG emissions. 2023 Emissions
have changed by 325.7% (4.33 Gg CO2
/ year). 1990-2023 Emissions have changed by 247.3% (4.09 Gg CO2 / year). For 2023 the
changes per gas
are:
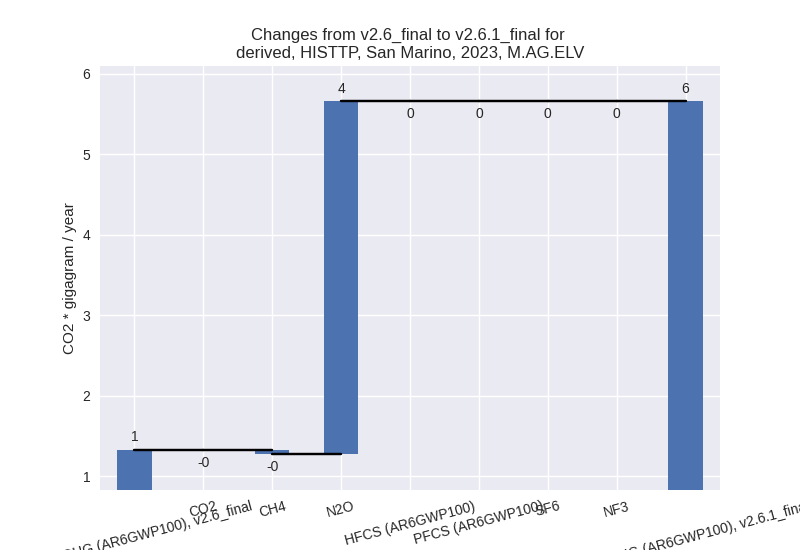
For 1990-2023 the changes per gas are: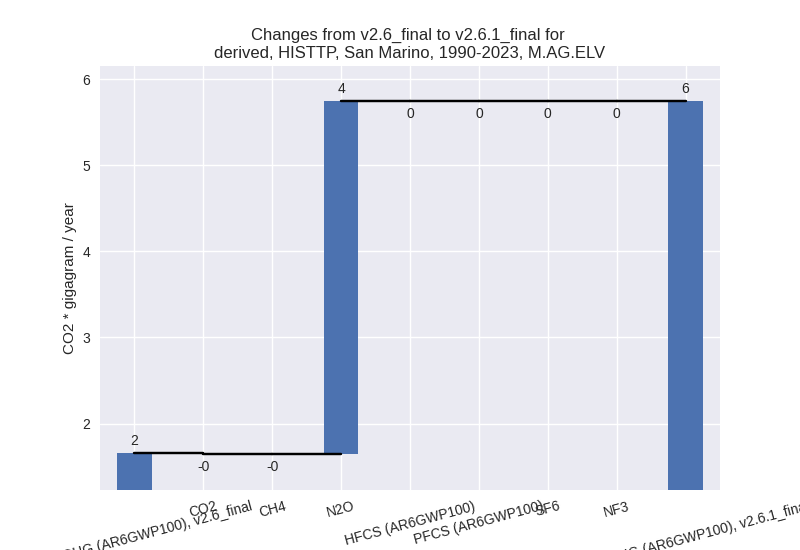
There is no subsector information available in PRIMAP-hist.
- 3.A: Total sectoral emissions in 2022 are 12.51 Gg
CO2 / year which is 68.7% of category M.AG emissions. 2023 Emissions
have changed by 267.1% (9.01 Gg CO2
/ year). 1990-2023 Emissions have changed by 215.8% (7.85 Gg CO2 / year). For 2023 the
changes per gas
are:
- 4: Total sectoral emissions in 2022 are 7.44 Gg CO2
/ year which is 3.7% of M.0.EL emissions. 2023 Emissions have changed by
-3.6% (-0.26 Gg CO2 / year).
1990-2023 Emissions have changed by -4.7% (-0.53 Gg CO2 / year). For 2023 the
changes per gas
are:

For 1990-2023 the changes per gas are: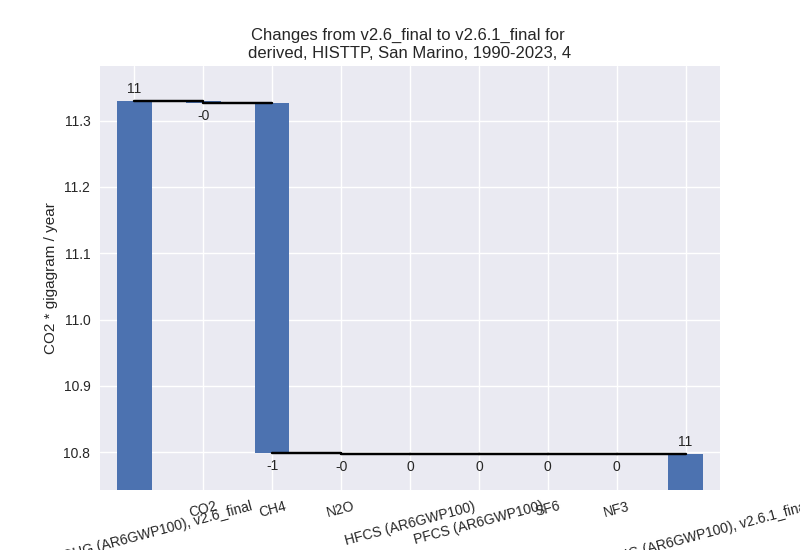
- 5: Total sectoral emissions in 2022 are 0.48 Gg CO2
/ year which is 0.2% of M.0.EL emissions. 2023 Emissions have changed by
-8.5% (-0.04 Gg CO2 / year).
1990-2023 Emissions have changed by -7.9% (-0.06 Gg CO2 / year). For 2023 the
changes per gas
are:

For 1990-2023 the changes per gas are: