Changes in PRIMAP-hist v2.6.1_final compared to v2.6_final for Sao Tome and Principe
2025-03-19
Johannes Gütschow
Change analysis for Sao Tome and Principe for PRIMAP-hist v2.6.1_final compared to v2.6_final
Overview over emissions by sector and gas
The following figures show the aggregate national total emissions excluding LULUCF AR6GWP100 for the country reported priority scenario. The dotted linesshow the v2.6_final data.
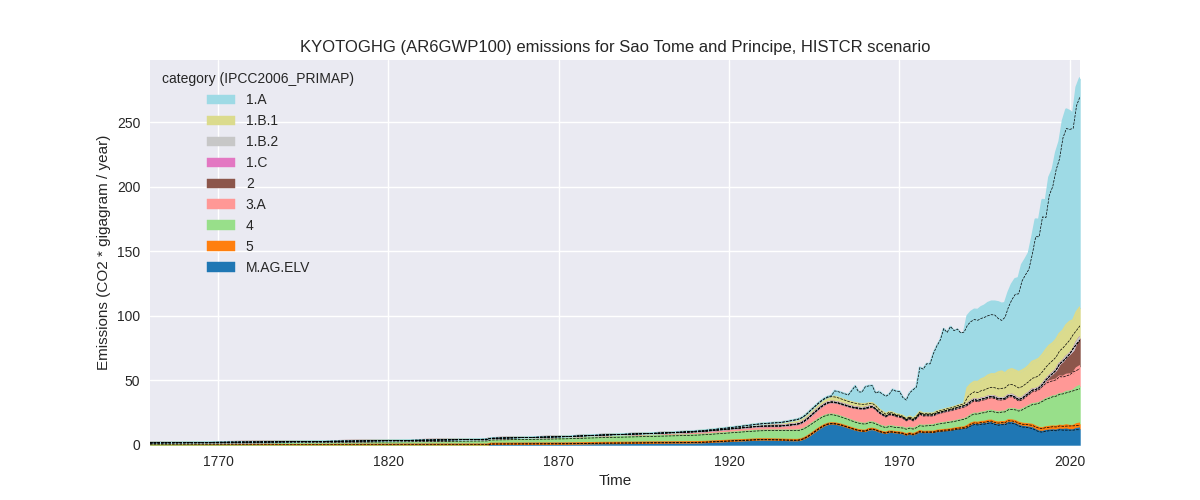
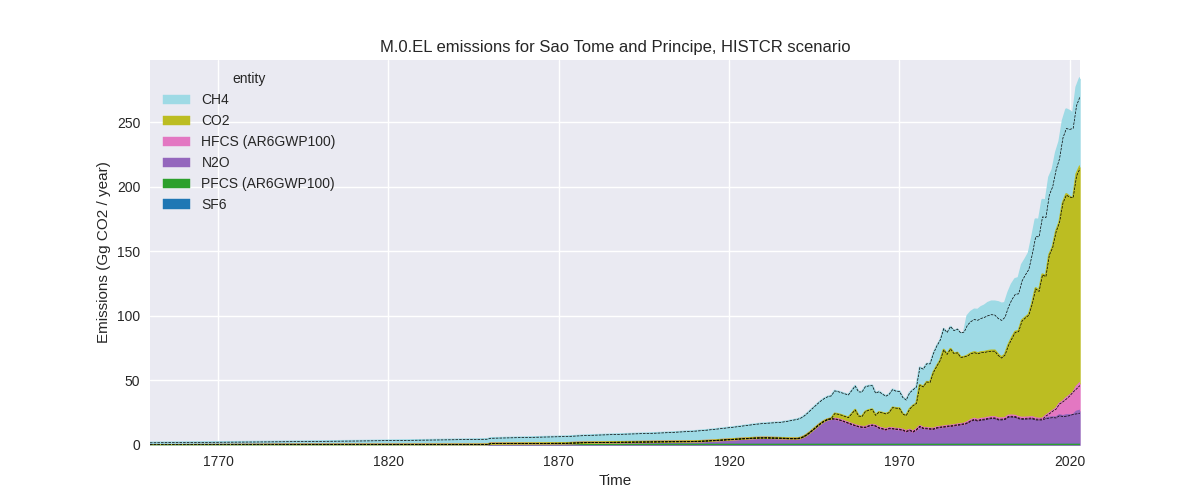
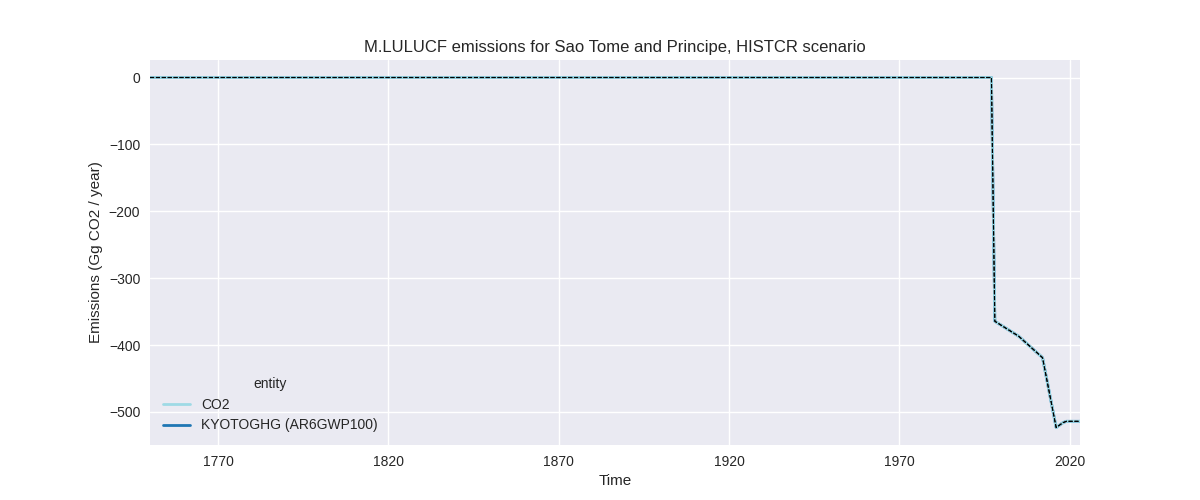
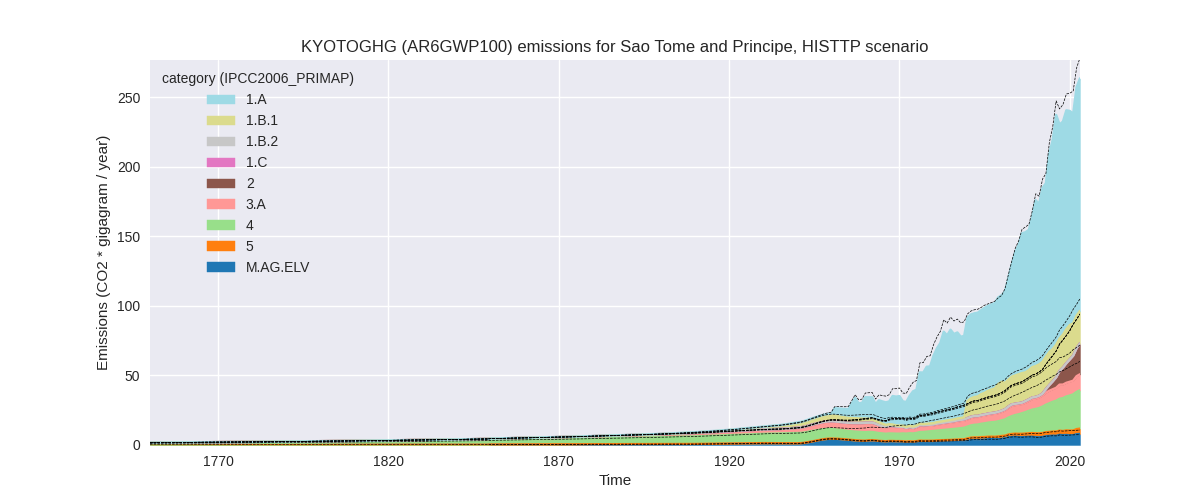
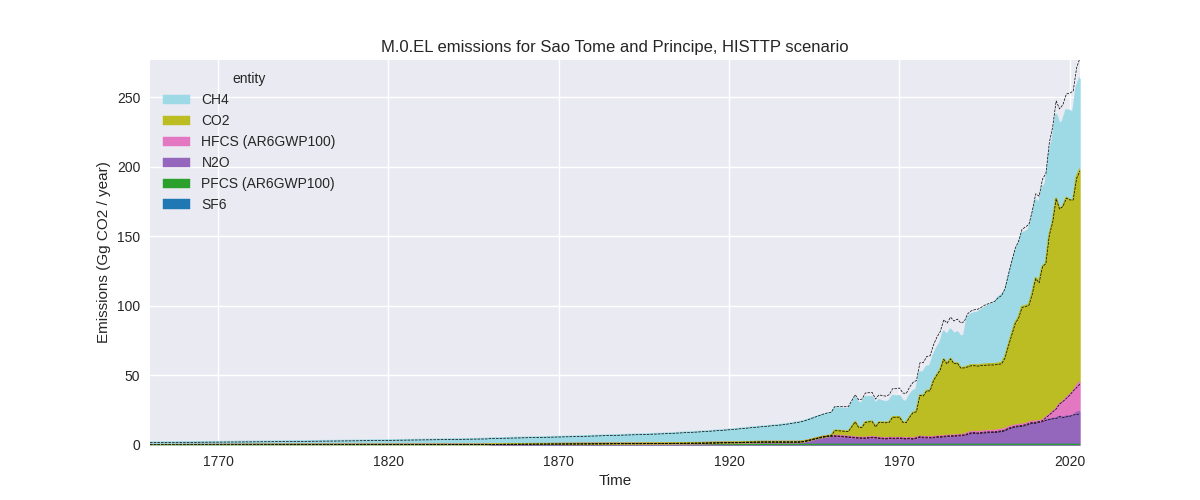
The following figures show the aggregate national total emissions excluding LULUCF AR6GWP100 for the third party priority scenario. The dotted linesshow the v2.6_final data.
Overview over changes
In the country reported priority scenario we have the following changes for aggregate Kyoto GHG and national total emissions excluding LULUCF (M.0.EL):
- Emissions in 2023 have changed by 5.3%% (14.22 Gg CO2 / year)
- Emissions in 1990-2023 have changed by 7.7%% (11.76 Gg CO2 / year)
In the third party priority scenario we have the following changes for aggregate Kyoto GHG and national total emissions excluding LULUCF (M.0.EL):
- Emissions in 2023 have changed by -5.3%% (-14.78 Gg CO2 / year)
- Emissions in 1990-2023 have changed by -3.3%% (-5.53 Gg CO2 / year)
Most important changes per scenario and time frame
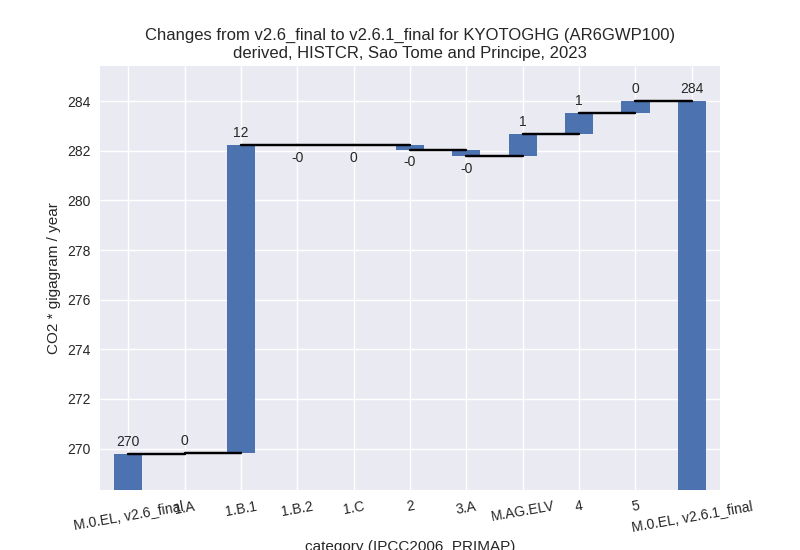
In the country reported priority scenario the following sector-gas combinations have the highest absolute impact on national total KyotoGHG (AR6GWP100) emissions in 2023 (top 5):
- 1: 1.B.1, CH4 with 12.24 Gg CO2 / year (112.8%)
- 2: M.AG.ELV, N2O with 0.78 Gg CO2 / year (6.8%)
- 3: 4, CH4 with 0.71 Gg CO2 / year (2.7%)
- 4: 5, N2O with 0.48 Gg CO2 / year (14.4%)
- 5: 1.A, N2O with 0.34 Gg CO2 / year (18.1%)
In the country reported priority scenario the following sector-gas combinations have the highest absolute impact on national total KyotoGHG (AR6GWP100) emissions in 1990-2023 (top 5):
- 1: 1.B.1, CH4 with 11.36 Gg CO2 / year (132.4%)
- 2: 5, N2O with 0.23 Gg CO2 / year (10.3%)
- 3: 1.B.1, N2O with 0.15 Gg CO2 / year (132.4%)
- 4: 4, CH4 with 0.03 Gg CO2 / year (0.3%)
- 5: 1.A, N2O with 0.03 Gg CO2 / year (2.7%)
In the third party priority scenario the following sector-gas combinations have the highest absolute impact on national total KyotoGHG (AR6GWP100) emissions in 2023 (top 5):
- 1: 4, CH4 with -21.95 Gg CO2 / year (-46.5%)
- 2: 1.B.1, CH4 with 12.24 Gg CO2 / year (112.8%)
- 3: 1.A, CH4 with -6.10 Gg CO2 / year (-35.0%)
- 4: M.AG.ELV, N2O with 0.50 Gg CO2 / year (6.8%)
- 5: 5, N2O with 0.48 Gg CO2 / year (14.4%)
In the third party priority scenario the following sector-gas combinations have the highest absolute impact on national total KyotoGHG (AR6GWP100) emissions in 1990-2023 (top 5):
- 1: 4, CH4 with -15.79 Gg CO2 / year (-51.9%)
- 2: 1.B.1, CH4 with 11.36 Gg CO2 / year (132.4%)
- 3: 1.A, CH4 with -1.41 Gg CO2 / year (-10.4%)
- 4: 5, N2O with 0.23 Gg CO2 / year (10.3%)
- 5: 1.B.1, N2O with 0.15 Gg CO2 / year (132.4%)
Notes on data changes
Here we list notes explaining important emissions changes for the country.
- No new country reported data has been included. country reported
data does not cover all sectors and gases, thus for some sectors third
party data is used directly.
- The main change for the CR scenario is CH4 in 1.B.1 and comes directly from EDGAR because we have no country reported data.
- Other CR scenario changes are small and come from EDGAR and FAO data either used to extrapolate country reported data or filling in for missing country reported data.
- In the TP scenario the changes are for similar sectors with the addition of a high reduction of waste CH4 emissions from EDGAR data.
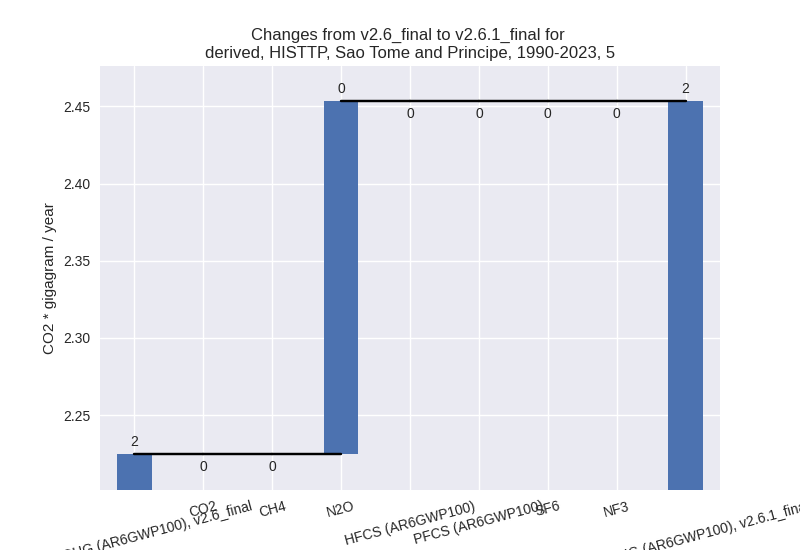
Changes by sector and gas
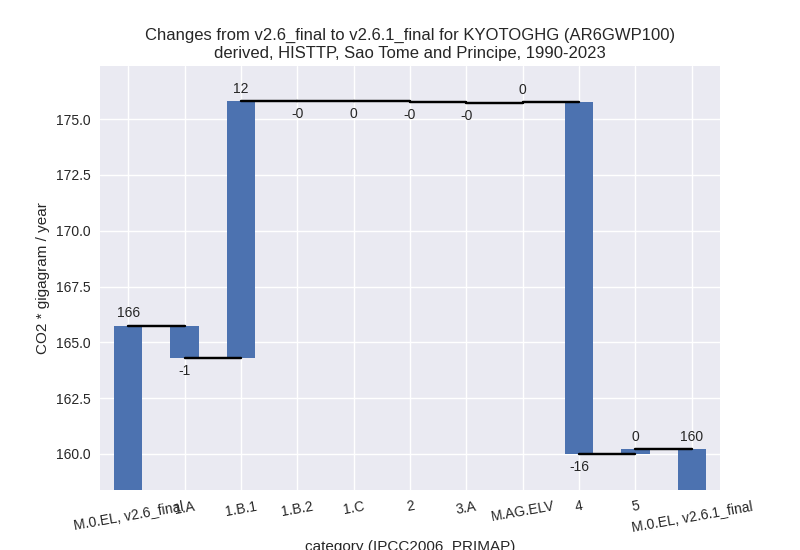
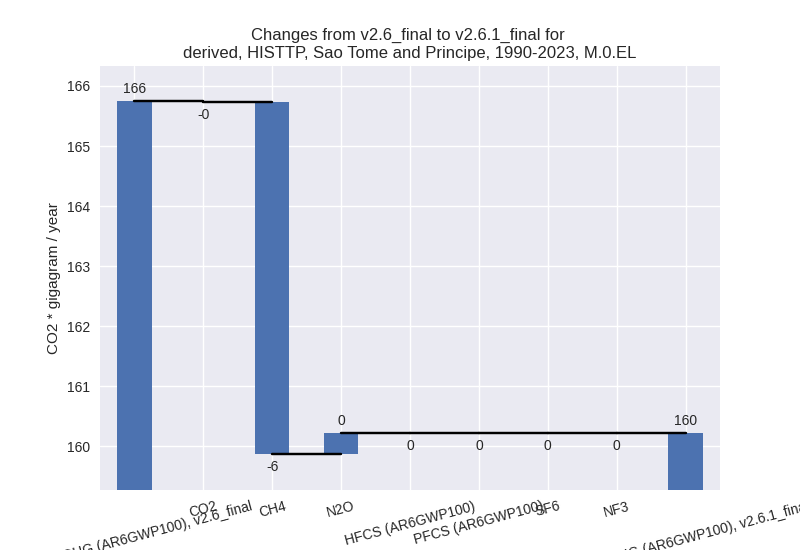
For each scenario and time frame the changes are displayed for all individual sectors and all individual gases. In the sector plot we use aggregate Kyoto GHGs in AR6GWP100. In the gas plot we usenational total emissions without LULUCF.
country reported scenario
2023
1990-2023

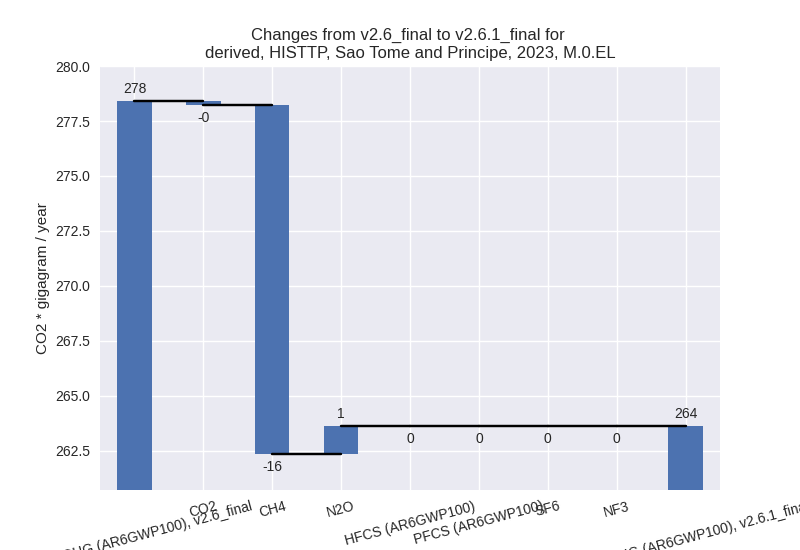
third party scenario
2023
1990-2023
Detailed changes for the scenarios:
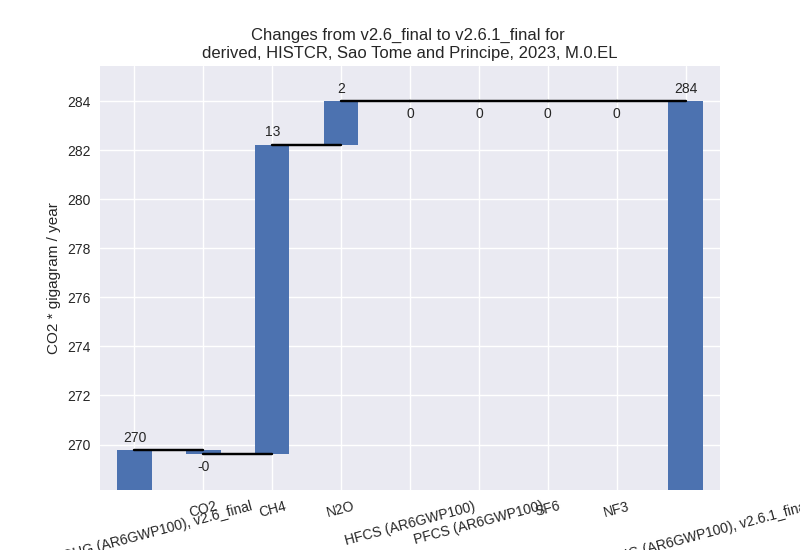
country reported scenario (HISTCR):
Most important changes per time frame
For 2023 the following sector-gas combinations have the highest absolute impact on national total KyotoGHG (AR6GWP100) emissions in 2023 (top 5):
- 1: 1.B.1, CH4 with 12.24 Gg CO2 / year (112.8%)
- 2: M.AG.ELV, N2O with 0.78 Gg CO2 / year (6.8%)
- 3: 4, CH4 with 0.71 Gg CO2 / year (2.7%)
- 4: 5, N2O with 0.48 Gg CO2 / year (14.4%)
- 5: 1.A, N2O with 0.34 Gg CO2 / year (18.1%)
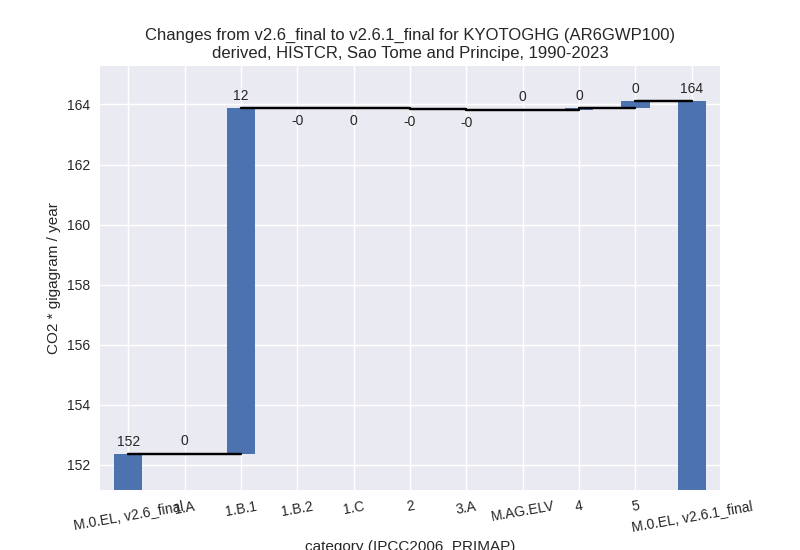
For 1990-2023 the following sector-gas combinations have the highest absolute impact on national total KyotoGHG (AR6GWP100) emissions in 1990-2023 (top 5):
- 1: 1.B.1, CH4 with 11.36 Gg CO2 / year (132.4%)
- 2: 5, N2O with 0.23 Gg CO2 / year (10.3%)
- 3: 1.B.1, N2O with 0.15 Gg CO2 / year (132.4%)
- 4: 4, CH4 with 0.03 Gg CO2 / year (0.3%)
- 5: 1.A, N2O with 0.03 Gg CO2 / year (2.7%)
Changes in the main sectors for aggregate KyotoGHG (AR6GWP100) are
- 1: Total sectoral emissions in 2022 are 197.68 Gg
CO2 / year which is 71.3% of M.0.EL emissions. 2023 Emissions have
changed by 6.6% (12.44 Gg CO2 /
year). 1990-2023 Emissions have changed by 10.9% (11.52 Gg CO2 / year). For 2023 the
changes per gas
are:

For 1990-2023 the changes per gas are: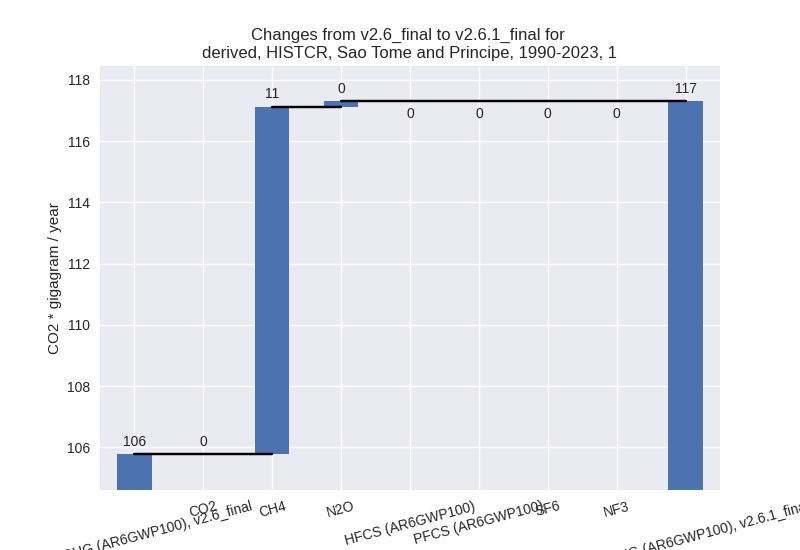
The changes come from the following subsectors:- 1.A: Total sectoral emissions in 2022 are 174.29 Gg CO2 / year which is 88.2% of category 1 emissions. 2023 Emissions have changed by 0.0% (0.05 Gg CO2 / year). 1990-2023 Emissions have changed by 0.0% (0.02 Gg CO2 / year).
- 1.B.1: Total sectoral emissions in 2022 are 23.39
Gg CO2 / year which is 11.8% of category 1 emissions. 2023 Emissions
have changed by 112.8% (12.40 Gg CO2
/ year). 1990-2023 Emissions have changed by 132.4% (11.51 Gg CO2 / year). For 2023 the
changes per gas
are:
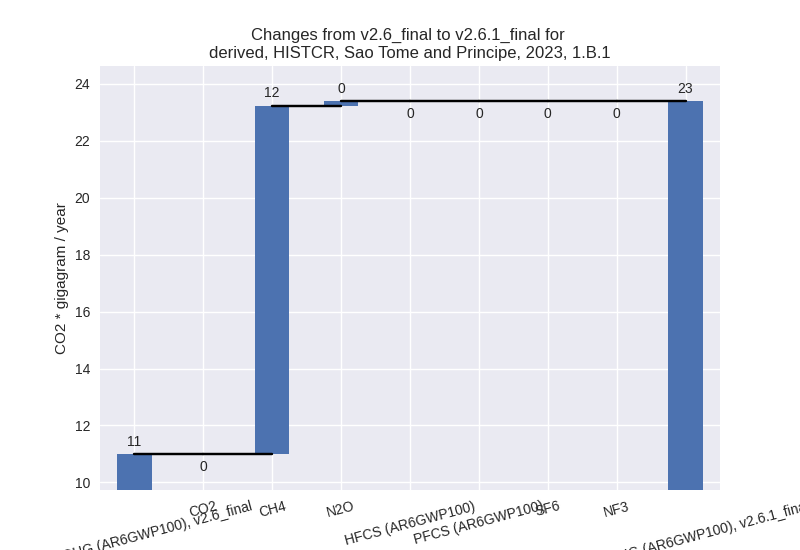
For 1990-2023 the changes per gas are:
There is no subsector information available in PRIMAP-hist. - 1.B.2: Total sectoral emissions in 2022 are 0.00 Gg
CO2 / year which is 0.0% of category 1 emissions. 2023 Emissions have
changed by -62.0% (-0.00 Gg CO2 /
year). 1990-2023 Emissions have changed by -65.2% (-0.00 Gg CO2 / year). For 2023 the
changes per gas
are:

For 1990-2023 the changes per gas are:
There is no subsector information available in PRIMAP-hist.
- 2: Total sectoral emissions in 2022 are 20.10 Gg CO2 / year which is 7.3% of M.0.EL emissions. 2023 Emissions have changed by -0.8% (-0.17 Gg CO2 / year). 1990-2023 Emissions have changed by -0.3% (-0.02 Gg CO2 / year).
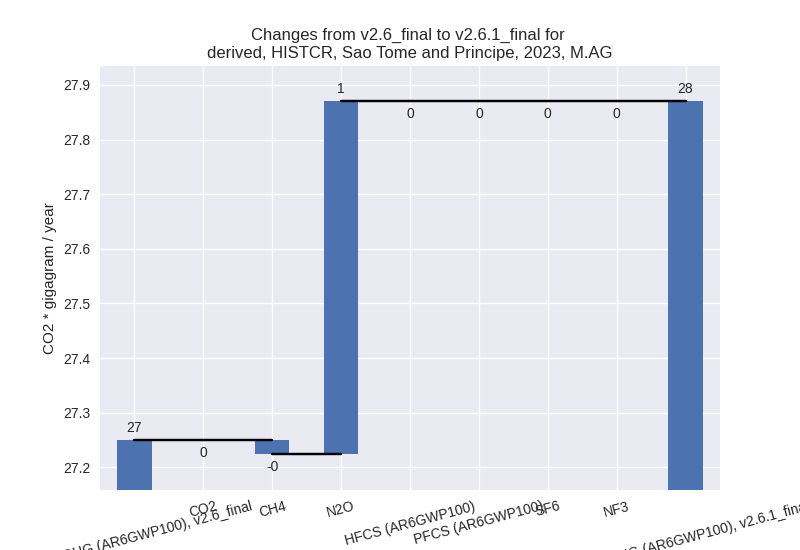
- M.AG: Total sectoral emissions in 2022 are 27.21 Gg
CO2 / year which is 9.8% of M.0.EL emissions. 2023 Emissions have
changed by 2.3% (0.62 Gg CO2 /
year). 1990-2023 Emissions have changed by -0.1% (-0.02 Gg CO2 / year). For 2023 the
changes per gas
are:
The changes come from the following subsectors:- 3.A: Total sectoral emissions in 2022 are 14.91 Gg CO2 / year which is 54.8% of category M.AG emissions. 2023 Emissions have changed by -1.7% (-0.26 Gg CO2 / year). 1990-2023 Emissions have changed by -0.5% (-0.05 Gg CO2 / year).
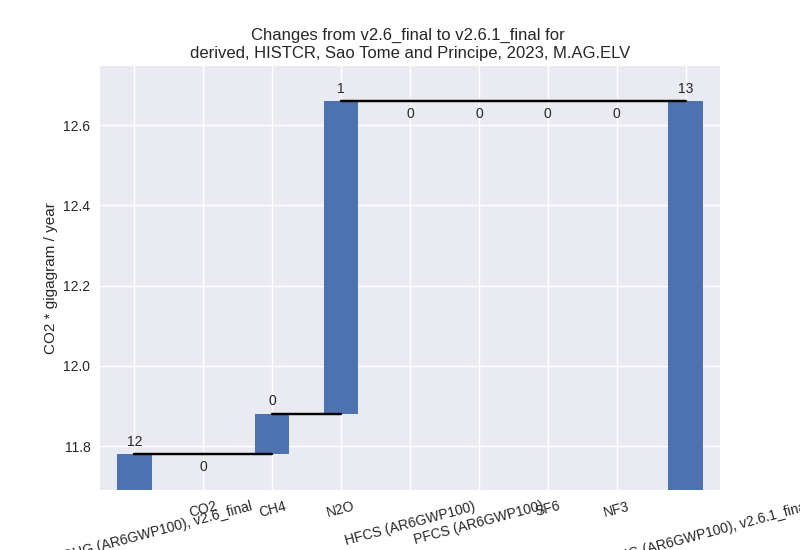
- M.AG.ELV: Total sectoral emissions in 2022 are
12.29 Gg CO2 / year which is 45.2% of category M.AG emissions. 2023
Emissions have changed by 7.5% (0.88
Gg CO2 / year). 1990-2023 Emissions have changed by 0.2% (0.03 Gg CO2 / year). For 2023 the
changes per gas
are:
There is no subsector information available in PRIMAP-hist.
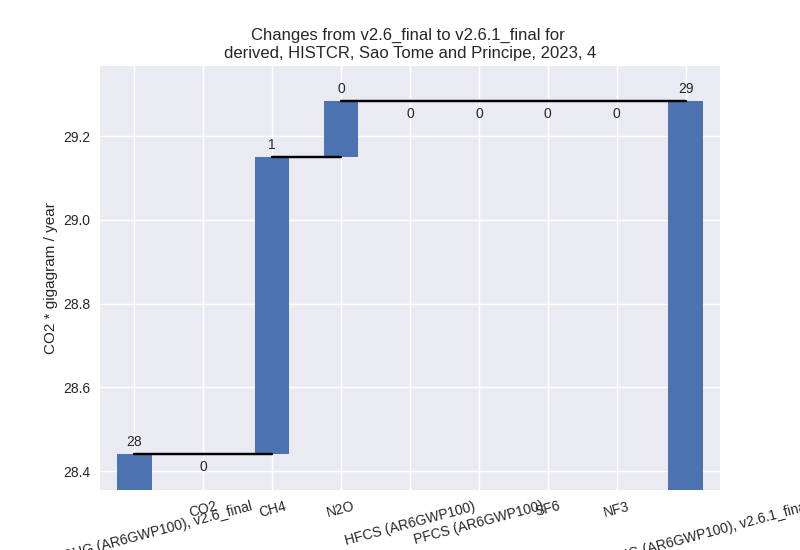
- 4: Total sectoral emissions in 2022 are 28.41 Gg
CO2 / year which is 10.3% of M.0.EL emissions. 2023 Emissions have
changed by 3.0% (0.84 Gg CO2 /
year). 1990-2023 Emissions have changed by 0.3% (0.04 Gg CO2 / year). For 2023 the
changes per gas
are:
- 5: Total sectoral emissions in 2022 are 3.71 Gg CO2
/ year which is 1.3% of M.0.EL emissions. 2023 Emissions have changed by
14.4% (0.48 Gg CO2 / year).
1990-2023 Emissions have changed by 10.3% (0.23 Gg CO2 / year). For 2023 the
changes per gas
are:
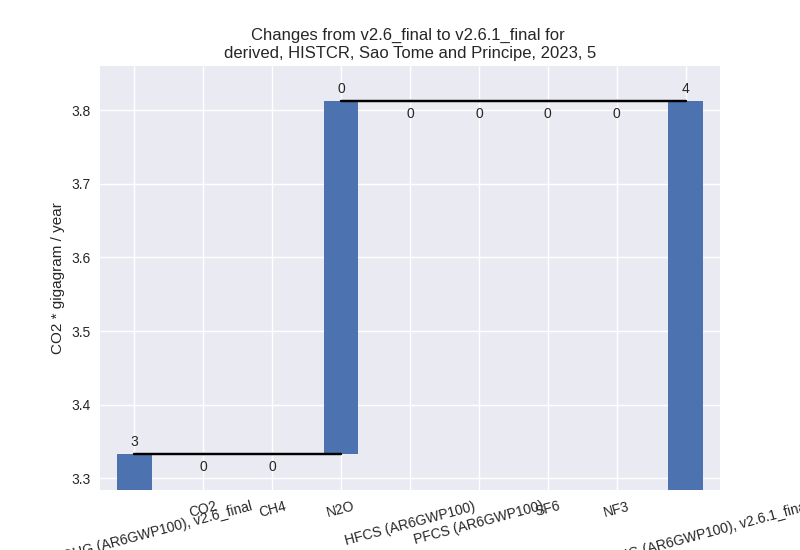
For 1990-2023 the changes per gas are:
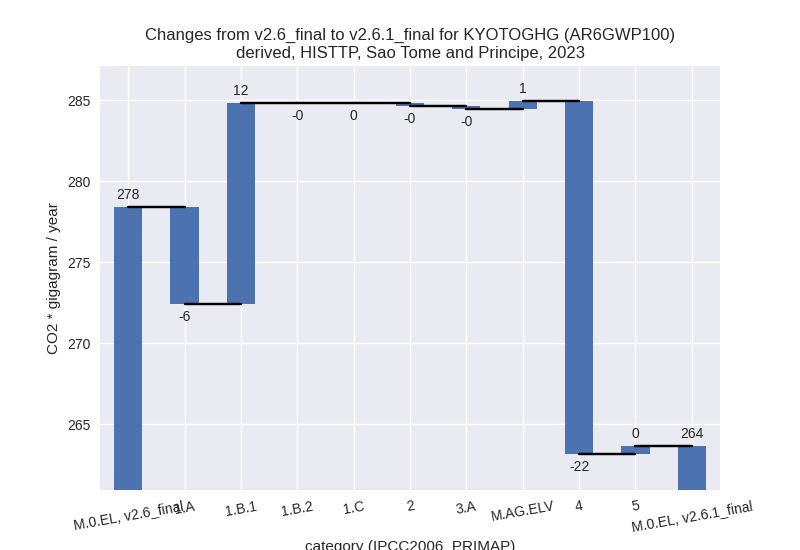
third party scenario (HISTTP):
Most important changes per time frame
For 2023 the following sector-gas combinations have the highest absolute impact on national total KyotoGHG (AR6GWP100) emissions in 2023 (top 5):
- 1: 4, CH4 with -21.95 Gg CO2 / year (-46.5%)
- 2: 1.B.1, CH4 with 12.24 Gg CO2 / year (112.8%)
- 3: 1.A, CH4 with -6.10 Gg CO2 / year (-35.0%)
- 4: M.AG.ELV, N2O with 0.50 Gg CO2 / year (6.8%)
- 5: 5, N2O with 0.48 Gg CO2 / year (14.4%)
For 1990-2023 the following sector-gas combinations have the highest absolute impact on national total KyotoGHG (AR6GWP100) emissions in 1990-2023 (top 5):
- 1: 4, CH4 with -15.79 Gg CO2 / year (-51.9%)
- 2: 1.B.1, CH4 with 11.36 Gg CO2 / year (132.4%)
- 3: 1.A, CH4 with -1.41 Gg CO2 / year (-10.4%)
- 4: 5, N2O with 0.23 Gg CO2 / year (10.3%)
- 5: 1.B.1, N2O with 0.15 Gg CO2 / year (132.4%)
Changes in the main sectors for aggregate KyotoGHG (AR6GWP100) are
- 1: Total sectoral emissions in 2022 are 187.64 Gg
CO2 / year which is 73.0% of M.0.EL emissions. 2023 Emissions have
changed by 3.5% (6.40 Gg CO2 /
year). 1990-2023 Emissions have changed by 8.8% (10.06 Gg CO2 / year). For 2023 the
changes per gas
are:

For 1990-2023 the changes per gas are: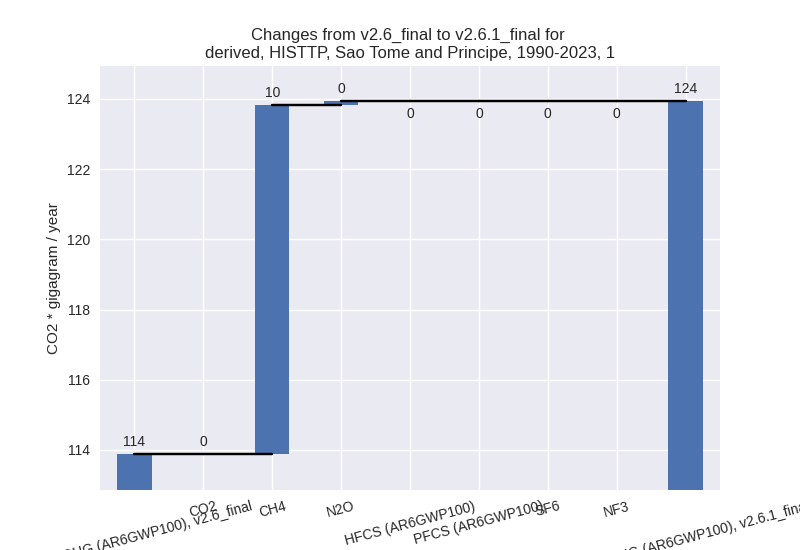
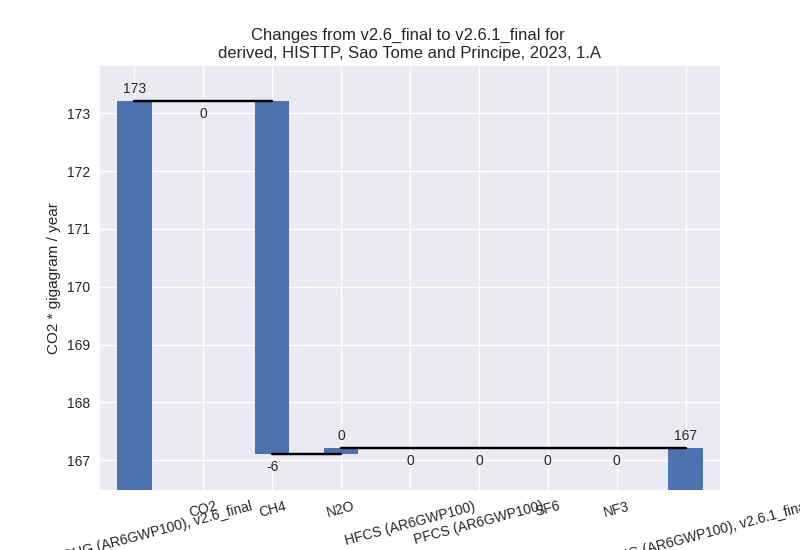
The changes come from the following subsectors:- 1.A: Total sectoral emissions in 2022 are 164.26 Gg
CO2 / year which is 87.5% of category 1 emissions. 2023 Emissions have
changed by -3.5% (-6.00 Gg CO2 /
year). 1990-2023 Emissions have changed by -1.4% (-1.45 Gg CO2 / year). For 2023 the
changes per gas
are:
There is no subsector information available in PRIMAP-hist. - 1.B.1: Total sectoral emissions in 2022 are 23.39
Gg CO2 / year which is 12.5% of category 1 emissions. 2023 Emissions
have changed by 112.8% (12.40 Gg CO2
/ year). 1990-2023 Emissions have changed by 132.4% (11.51 Gg CO2 / year). For 2023 the
changes per gas
are:

For 1990-2023 the changes per gas are:
There is no subsector information available in PRIMAP-hist. - 1.B.2: Total sectoral emissions in 2022 are 0.00 Gg
CO2 / year which is 0.0% of category 1 emissions. 2023 Emissions have
changed by -62.0% (-0.00 Gg CO2 /
year). 1990-2023 Emissions have changed by -65.2% (-0.00 Gg CO2 / year). For 2023 the
changes per gas
are:
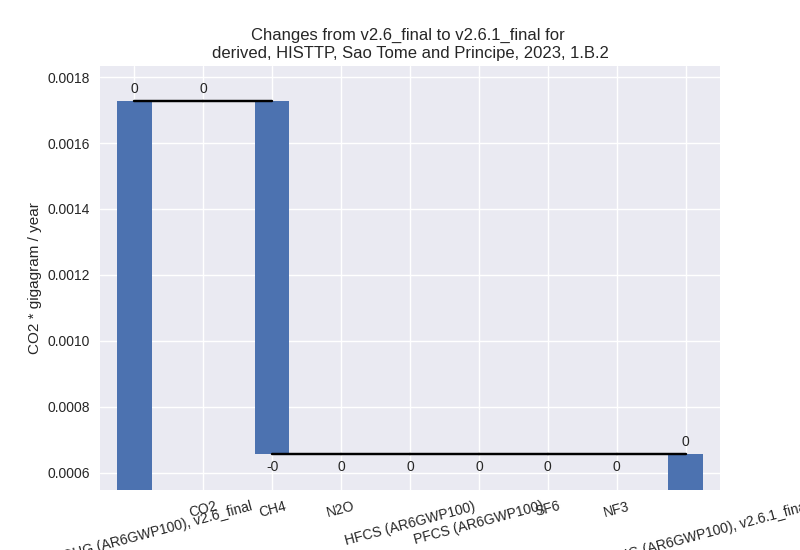
For 1990-2023 the changes per gas are:
There is no subsector information available in PRIMAP-hist.
- 1.A: Total sectoral emissions in 2022 are 164.26 Gg
CO2 / year which is 87.5% of category 1 emissions. 2023 Emissions have
changed by -3.5% (-6.00 Gg CO2 /
year). 1990-2023 Emissions have changed by -1.4% (-1.45 Gg CO2 / year). For 2023 the
changes per gas
are:
- 2: Total sectoral emissions in 2022 are 20.10 Gg CO2 / year which is 7.8% of M.0.EL emissions. 2023 Emissions have changed by -0.8% (-0.17 Gg CO2 / year). 1990-2023 Emissions have changed by -0.3% (-0.02 Gg CO2 / year).
- M.AG: Total sectoral emissions in 2022 are 18.98 Gg CO2 / year which is 7.4% of M.0.EL emissions. 2023 Emissions have changed by 1.5% (0.30 Gg CO2 / year). 1990-2023 Emissions have changed by -0.2% (-0.02 Gg CO2 / year).
- 4: Total sectoral emissions in 2022 are 26.77 Gg
CO2 / year which is 10.4% of M.0.EL emissions. 2023 Emissions have
changed by -44.1% (-21.78 Gg CO2 /
year). 1990-2023 Emissions have changed by -49.3% (-15.78 Gg CO2 / year). For 2023
the changes per gas
are:

For 1990-2023 the changes per gas are:
- 5: Total sectoral emissions in 2022 are 3.71 Gg CO2
/ year which is 1.4% of M.0.EL emissions. 2023 Emissions have changed by
14.4% (0.48 Gg CO2 / year).
1990-2023 Emissions have changed by 10.3% (0.23 Gg CO2 / year). For 2023 the
changes per gas
are:

For 1990-2023 the changes per gas are: