Changes in PRIMAP-hist v2.6.1_final compared to v2.6_final for Slovakia
2025-03-19
Johannes Gütschow
Change analysis for Slovakia for PRIMAP-hist v2.6.1_final compared to v2.6_final
Overview over emissions by sector and gas
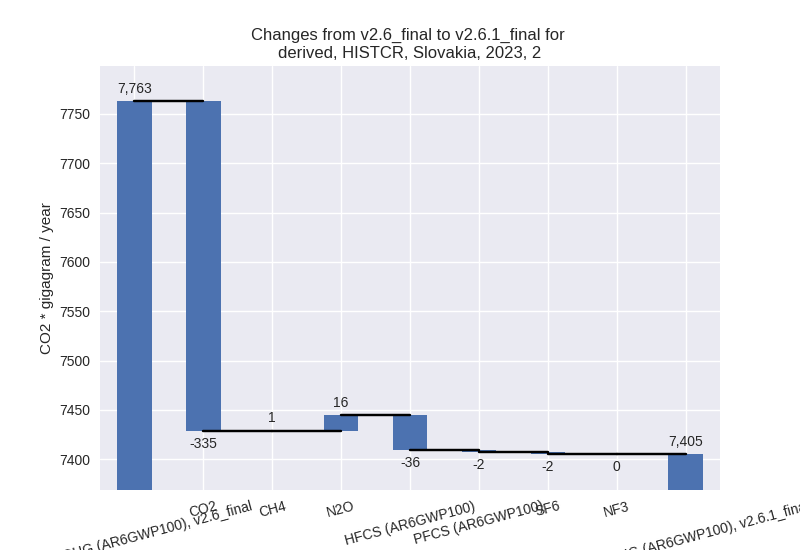
The following figures show the aggregate national total emissions excluding LULUCF AR6GWP100 for the country reported priority scenario. The dotted linesshow the v2.6_final data.
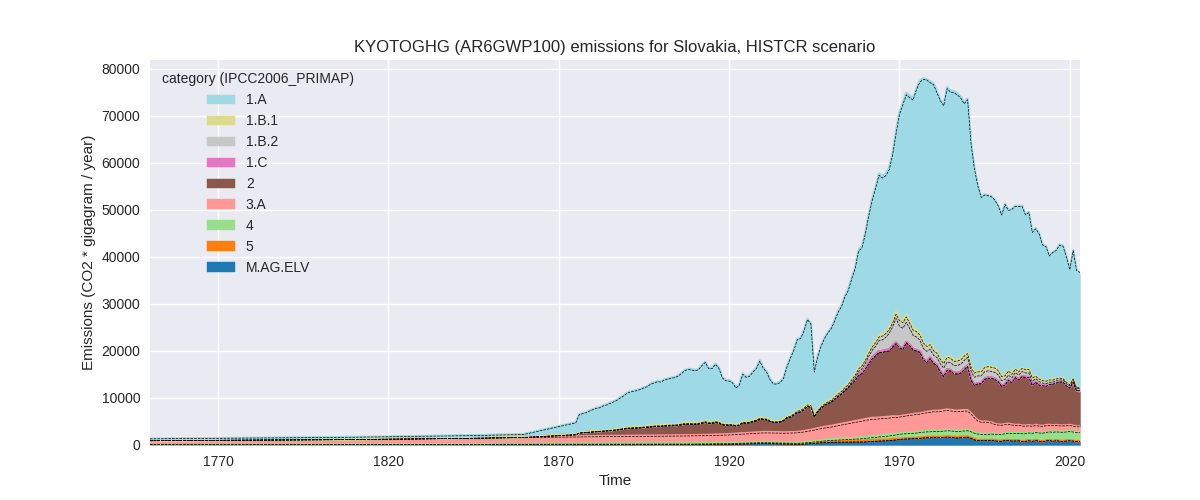
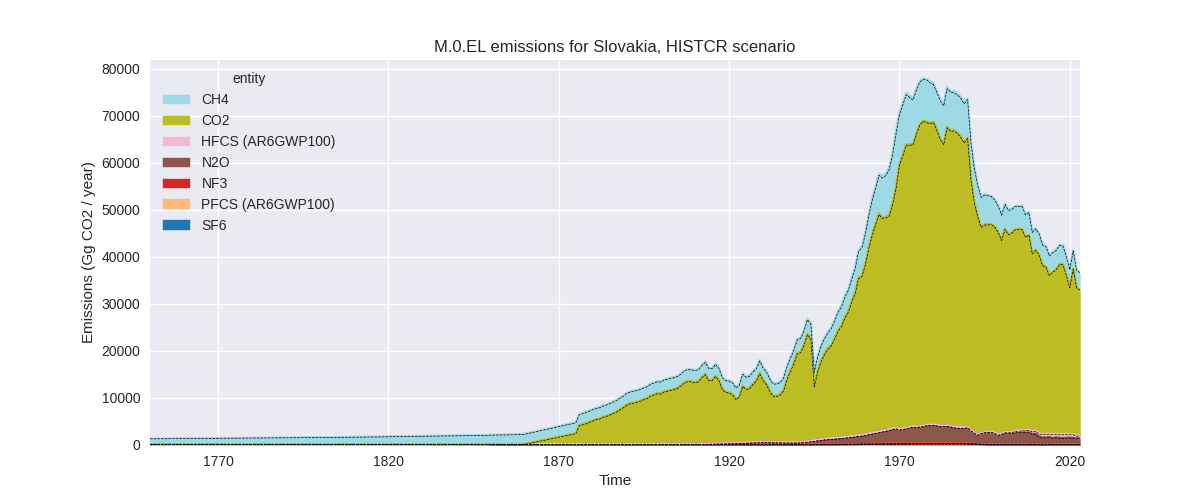
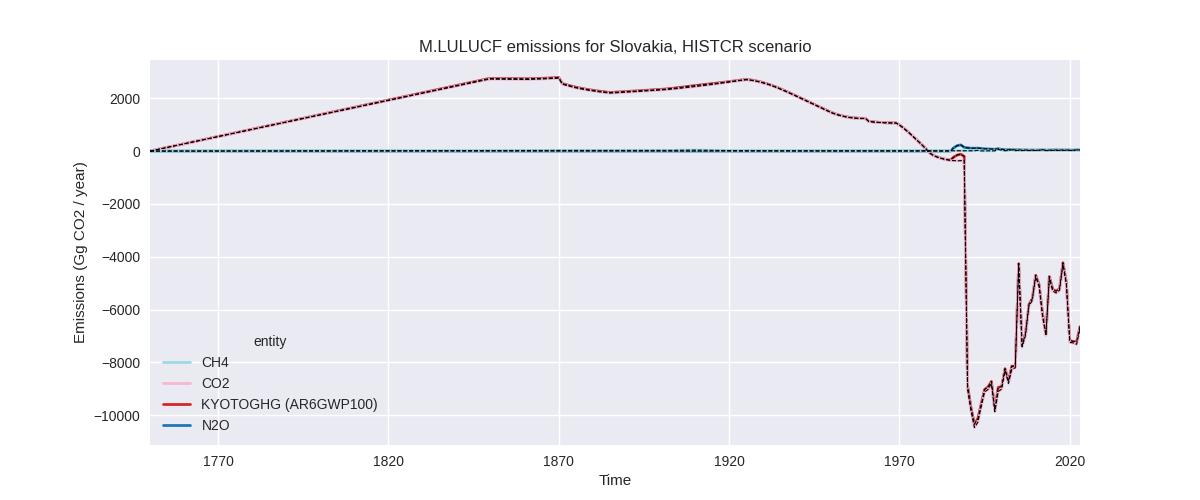
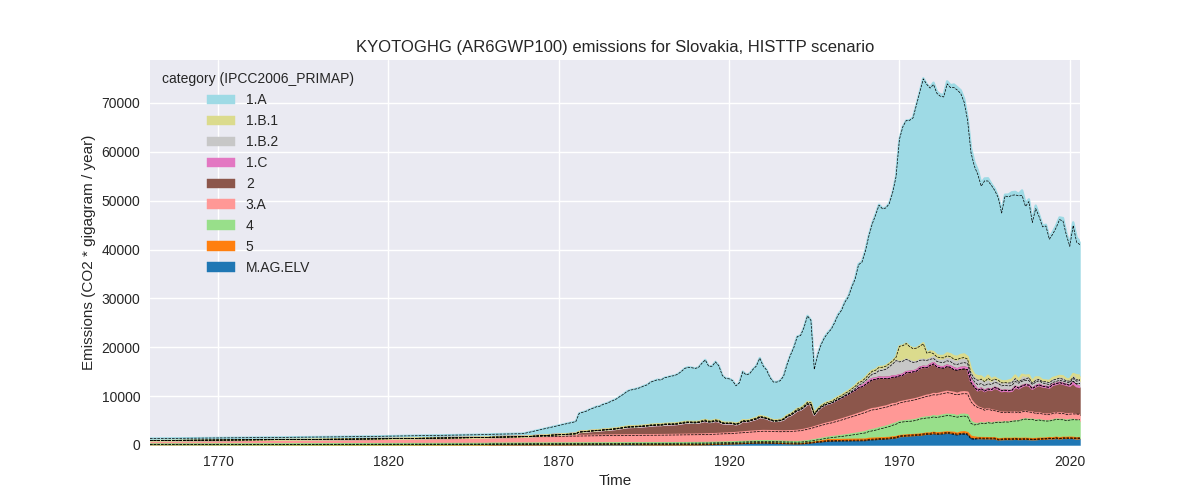
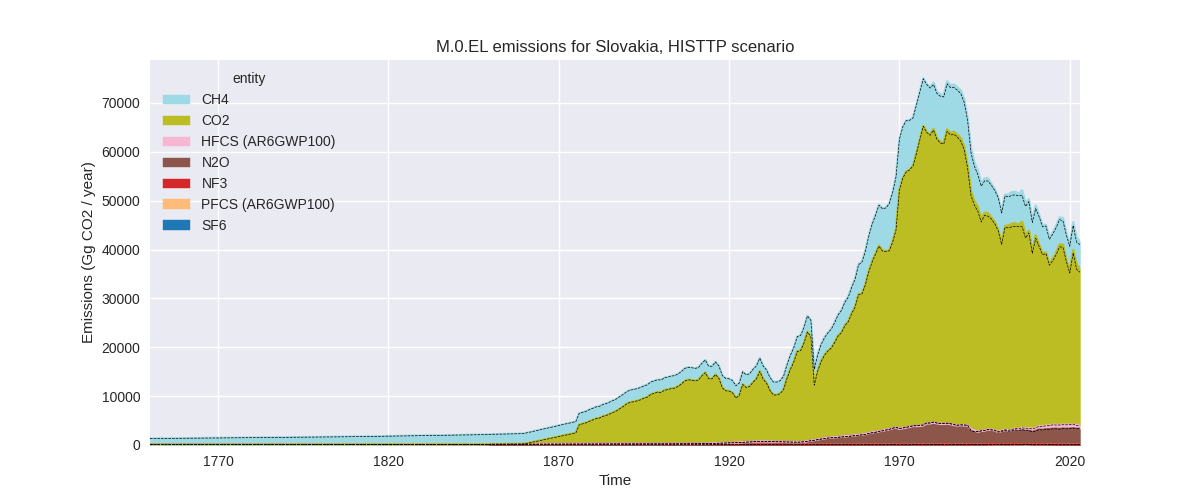
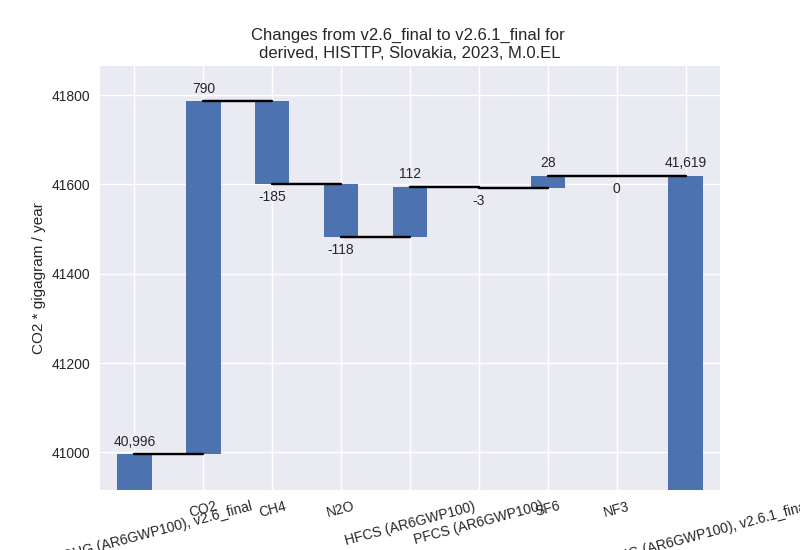
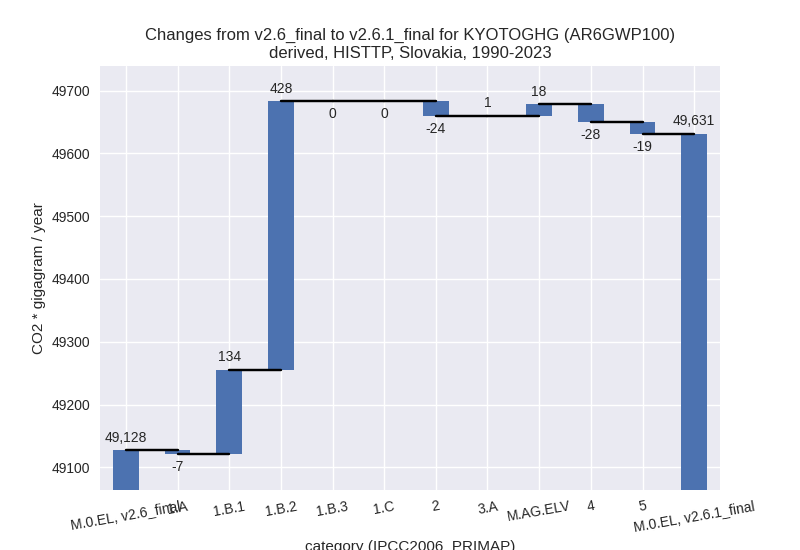
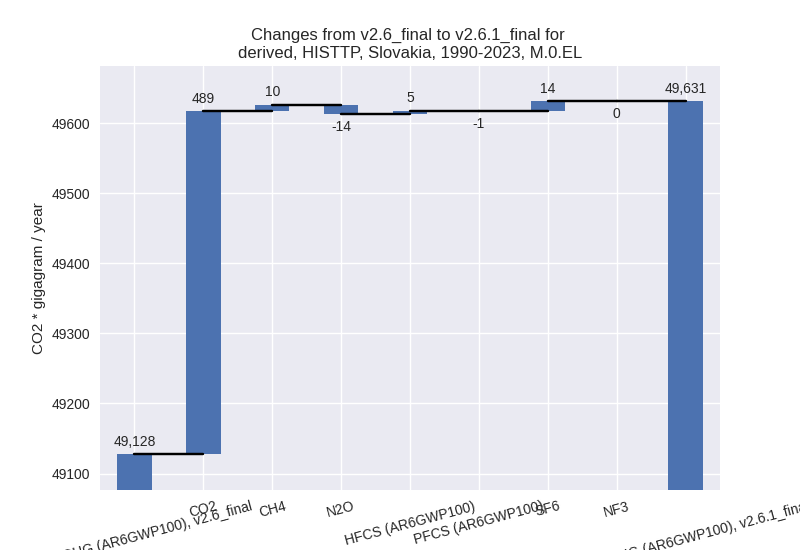
The following figures show the aggregate national total emissions excluding LULUCF AR6GWP100 for the third party priority scenario. The dotted linesshow the v2.6_final data.
Overview over changes
In the country reported priority scenario we have the following changes for aggregate Kyoto GHG and national total emissions excluding LULUCF (M.0.EL):
- Emissions in 2023 have changed by -0.9%% (-330.32 Gg CO2 / year)
- Emissions in 1990-2023 have changed by 0.2%% (108.15 Gg CO2 / year)
In the third party priority scenario we have the following changes for aggregate Kyoto GHG and national total emissions excluding LULUCF (M.0.EL):
- Emissions in 2023 have changed by 1.5%% (623.36 Gg CO2 / year)
- Emissions in 1990-2023 have changed by 1.0%% (503.51 Gg CO2 / year)
Most important changes per scenario and time frame
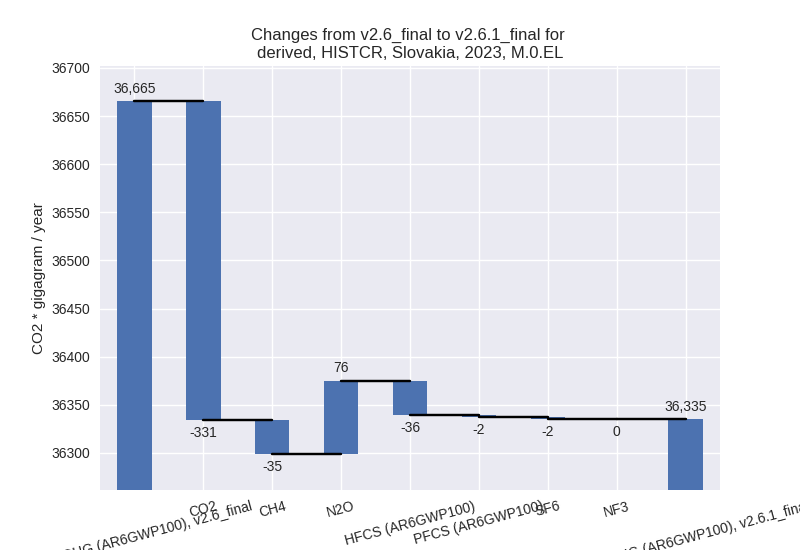
In the country reported priority scenario the following sector-gas combinations have the highest absolute impact on national total KyotoGHG (AR6GWP100) emissions in 2023 (top 5):
- 1: 2, CO2 with -334.67 Gg CO2 / year (-4.8%)
- 2: 5, N2O with 82.40 Gg CO2 / year (inf%)
- 3: 2, HFCS (AR6GWP100) with -35.89 Gg CO2 / year (-6.0%)
- 4: 3.A, CH4 with 30.22 Gg CO2 / year (2.8%)
- 5: 1.A, CH4 with -27.34 Gg CO2 / year (-8.7%)
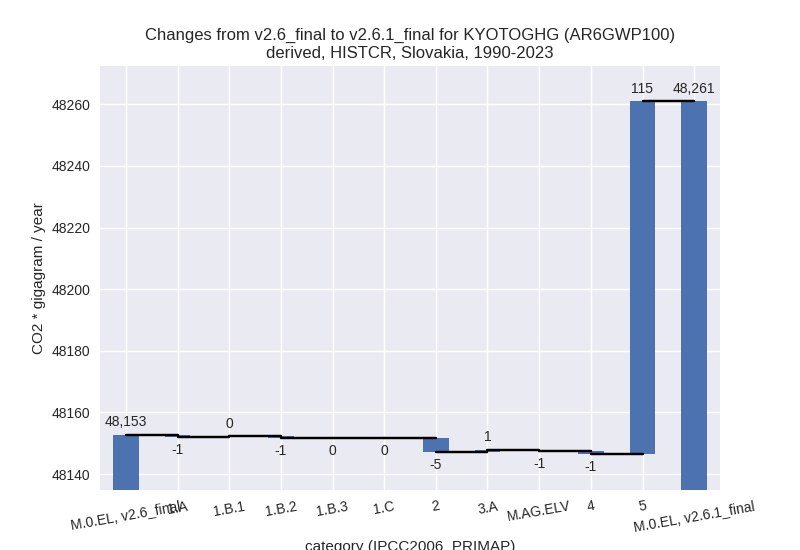
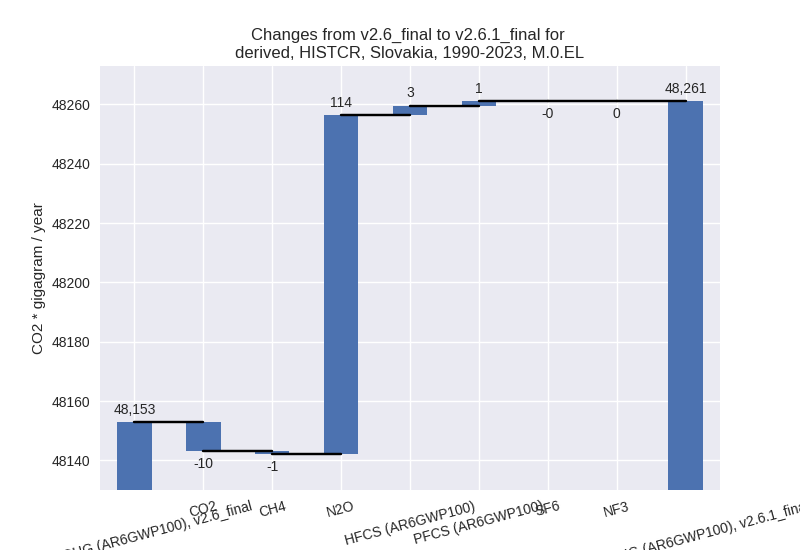
In the country reported priority scenario the following sector-gas combinations have the highest absolute impact on national total KyotoGHG (AR6GWP100) emissions in 1990-2023 (top 5):
- 1: 5, N2O with 114.54 Gg CO2 / year (inf%)
- 2: 2, CO2 with -9.84 Gg CO2 / year (-0.1%)
- 3: 2, HFCS (AR6GWP100) with 3.16 Gg CO2 / year (0.8%)
- 4: 2, PFCS (AR6GWP100) with 1.50 Gg CO2 / year (3.0%)
- 5: 3.A, CH4 with 0.89 Gg CO2 / year (0.1%)
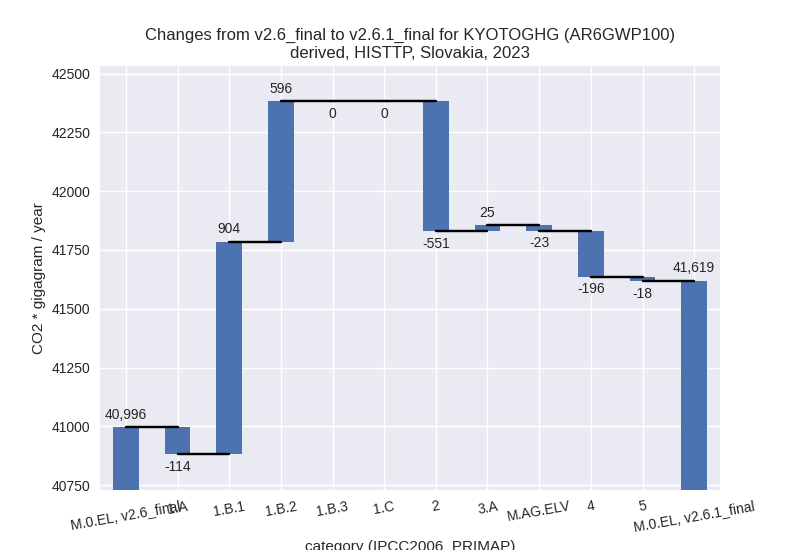
In the third party priority scenario the following sector-gas combinations have the highest absolute impact on national total KyotoGHG (AR6GWP100) emissions in 2023 (top 5):
- 1: 1.B.1, CO2 with 796.82 Gg CO2 / year (441.8%)
- 2: 2, CO2 with -642.01 Gg CO2 / year (-15.8%)
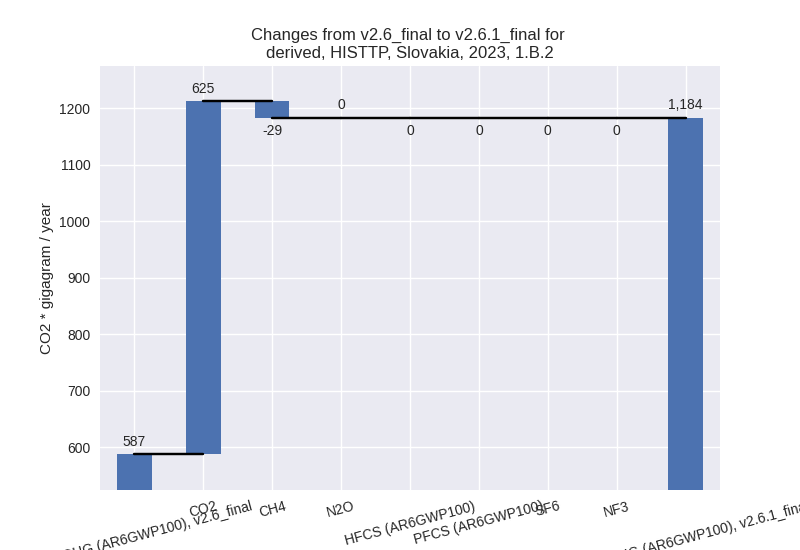
- 3: 1.B.2, CO2 with 625.35 Gg CO2 / year (3445550.1%)
- 4: 4, CH4 with -194.11 Gg CO2 / year (-5.5%)
- 5: 2, HFCS (AR6GWP100) with 111.92 Gg CO2 / year (16.6%)
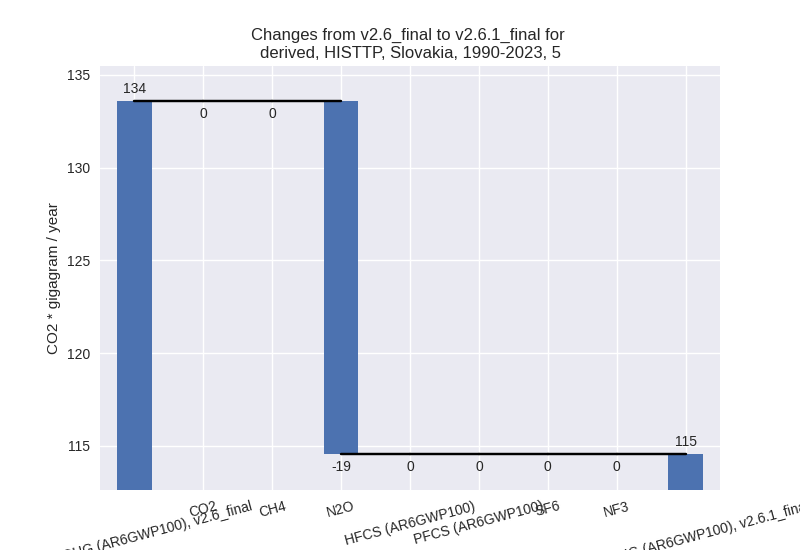
In the third party priority scenario the following sector-gas combinations have the highest absolute impact on national total KyotoGHG (AR6GWP100) emissions in 1990-2023 (top 5):
- 1: 1.B.2, CO2 with 473.32 Gg CO2 / year (3752.0%)
- 2: 1.B.1, CH4 with 86.37 Gg CO2 / year (43.3%)
- 3: 1.B.1, CO2 with 48.03 Gg CO2 / year (15.5%)
- 4: 1.B.2, CH4 with -45.75 Gg CO2 / year (-5.4%)
- 5: 2, CO2 with -41.00 Gg CO2 / year (-1.2%)
Notes on data changes
Here we list notes explaining important emissions changes for the country.
- CRT data has been included but replaces official data reported to the EU which does not show noteworthy differences. Changes in the CR time-series are small and come from updated third party data (EDGAR, FAO) which is used to extrapolate the country reported data.
- Changes in the TP time-series come directly from EDGAR.
Changes by sector and gas
For each scenario and time frame the changes are displayed for all individual sectors and all individual gases. In the sector plot we use aggregate Kyoto GHGs in AR6GWP100. In the gas plot we usenational total emissions without LULUCF.
country reported scenario
2023
1990-2023
third party scenario
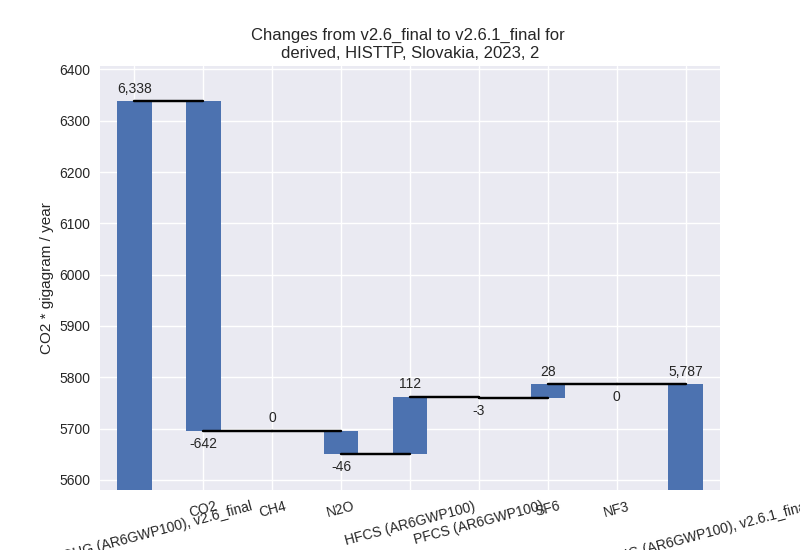
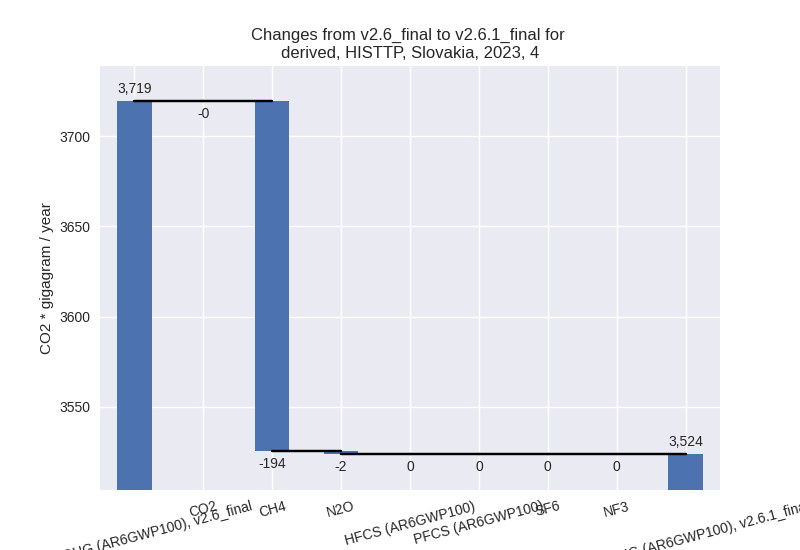
2023
1990-2023
Detailed changes for the scenarios:
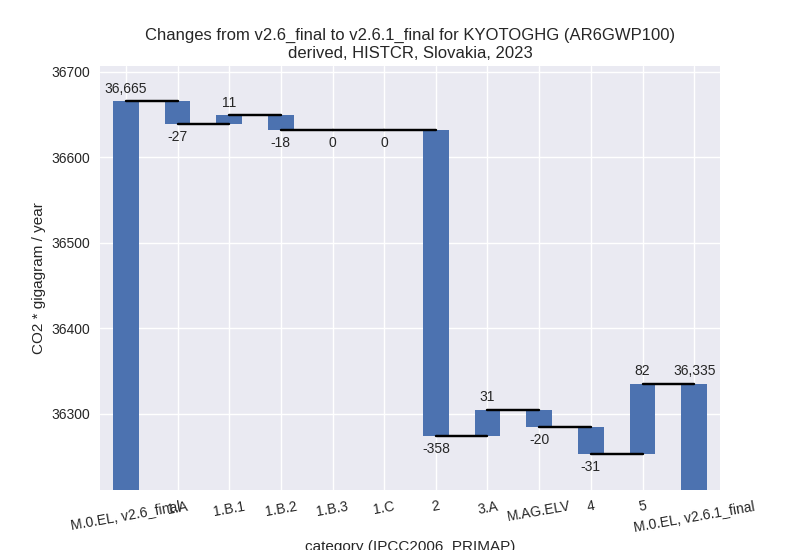
country reported scenario (HISTCR):
Most important changes per time frame
For 2023 the following sector-gas combinations have the highest absolute impact on national total KyotoGHG (AR6GWP100) emissions in 2023 (top 5):
- 1: 2, CO2 with -334.67 Gg CO2 / year (-4.8%)
- 2: 5, N2O with 82.40 Gg CO2 / year (inf%)
- 3: 2, HFCS (AR6GWP100) with -35.89 Gg CO2 / year (-6.0%)
- 4: 3.A, CH4 with 30.22 Gg CO2 / year (2.8%)
- 5: 1.A, CH4 with -27.34 Gg CO2 / year (-8.7%)
For 1990-2023 the following sector-gas combinations have the highest absolute impact on national total KyotoGHG (AR6GWP100) emissions in 1990-2023 (top 5):
- 1: 5, N2O with 114.54 Gg CO2 / year (inf%)
- 2: 2, CO2 with -9.84 Gg CO2 / year (-0.1%)
- 3: 2, HFCS (AR6GWP100) with 3.16 Gg CO2 / year (0.8%)
- 4: 2, PFCS (AR6GWP100) with 1.50 Gg CO2 / year (3.0%)
- 5: 3.A, CH4 with 0.89 Gg CO2 / year (0.1%)
Changes in the main sectors for aggregate KyotoGHG (AR6GWP100) are
- 1: Total sectoral emissions in 2022 are 25614.89 Gg CO2 / year which is 68.8% of M.0.EL emissions. 2023 Emissions have changed by -0.1% (-34.00 Gg CO2 / year). 1990-2023 Emissions have changed by -0.0% (-1.01 Gg CO2 / year).
- 2: Total sectoral emissions in 2022 are 7627.42 Gg
CO2 / year which is 20.5% of M.0.EL emissions. 2023 Emissions have
changed by -4.6% (-357.70 Gg CO2 /
year). 1990-2023 Emissions have changed by -0.1% (-4.77 Gg CO2 / year). For 2023 the
changes per gas
are:
- M.AG: Total sectoral emissions in 2022 are 1952.85 Gg CO2 / year which is 5.2% of M.0.EL emissions. 2023 Emissions have changed by 0.5% (10.45 Gg CO2 / year). 1990-2023 Emissions have changed by 0.0% (0.31 Gg CO2 / year).
- 4: Total sectoral emissions in 2022 are 1929.86 Gg CO2 / year which is 5.2% of M.0.EL emissions. 2023 Emissions have changed by -1.6% (-31.48 Gg CO2 / year). 1990-2023 Emissions have changed by -0.1% (-0.93 Gg CO2 / year).
- 5: Total sectoral emissions in 2022 are 85.56 Gg
CO2 / year which is 0.2% of M.0.EL emissions. 2023 Emissions have
changed by inf% (82.40 Gg CO2 /
year). 1990-2023 Emissions have changed by inf% (114.54 Gg CO2 / year). For 2023 the
changes per gas
are:
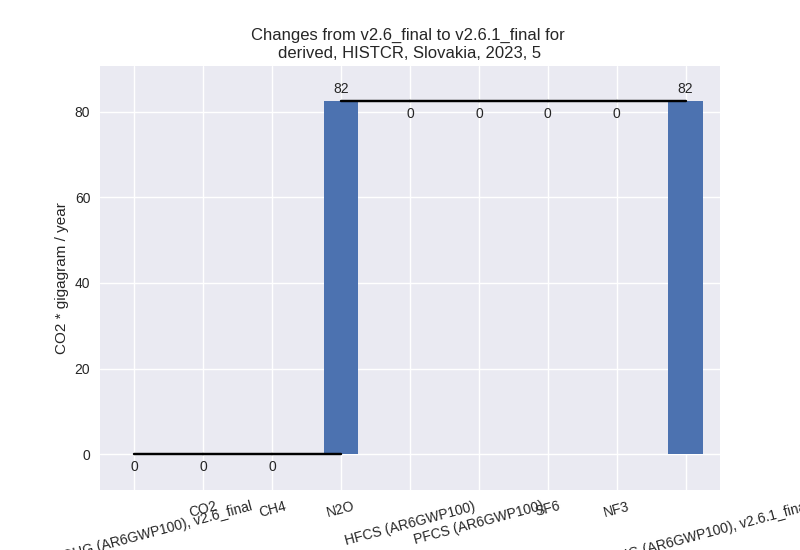
For 1990-2023 the changes per gas are: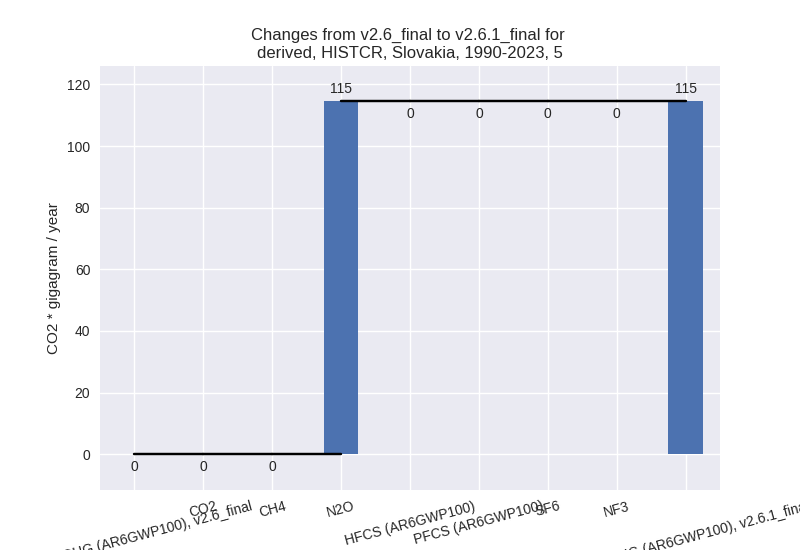
third party scenario (HISTTP):
Most important changes per time frame
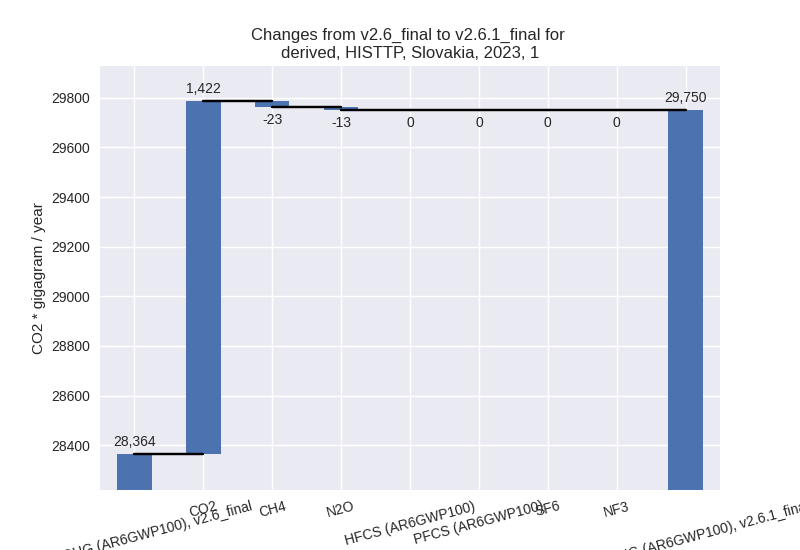
For 2023 the following sector-gas combinations have the highest absolute impact on national total KyotoGHG (AR6GWP100) emissions in 2023 (top 5):
- 1: 1.B.1, CO2 with 796.82 Gg CO2 / year (441.8%)
- 2: 2, CO2 with -642.01 Gg CO2 / year (-15.8%)
- 3: 1.B.2, CO2 with 625.35 Gg CO2 / year (3445550.1%)
- 4: 4, CH4 with -194.11 Gg CO2 / year (-5.5%)
- 5: 2, HFCS (AR6GWP100) with 111.92 Gg CO2 / year (16.6%)
For 1990-2023 the following sector-gas combinations have the highest absolute impact on national total KyotoGHG (AR6GWP100) emissions in 1990-2023 (top 5):
- 1: 1.B.2, CO2 with 473.32 Gg CO2 / year (3752.0%)
- 2: 1.B.1, CH4 with 86.37 Gg CO2 / year (43.3%)
- 3: 1.B.1, CO2 with 48.03 Gg CO2 / year (15.5%)
- 4: 1.B.2, CH4 with -45.75 Gg CO2 / year (-5.4%)
- 5: 2, CO2 with -41.00 Gg CO2 / year (-1.2%)
Changes in the main sectors for aggregate KyotoGHG (AR6GWP100) are
- 1: Total sectoral emissions in 2022 are 30374.89 Gg
CO2 / year which is 71.6% of M.0.EL emissions. 2023 Emissions have
changed by 4.9% (1386.44 Gg CO2 /
year). 1990-2023 Emissions have changed by 1.5% (555.34 Gg CO2 / year). For 2023 the
changes per gas
are:
The changes come from the following subsectors:- 1.A: Total sectoral emissions in 2022 are 28165.13 Gg CO2 / year which is 92.7% of category 1 emissions. 2023 Emissions have changed by -0.4% (-114.34 Gg CO2 / year). 1990-2023 Emissions have changed by -0.0% (-6.63 Gg CO2 / year).
- 1.B.1: Total sectoral emissions in 2022 are 1062.16
Gg CO2 / year which is 3.5% of category 1 emissions. 2023 Emissions have
changed by 399.7% (904.32 Gg CO2 /
year). 1990-2023 Emissions have changed by 26.3% (134.40 Gg CO2 / year). For 2023 the
changes per gas
are:

For 1990-2023 the changes per gas are: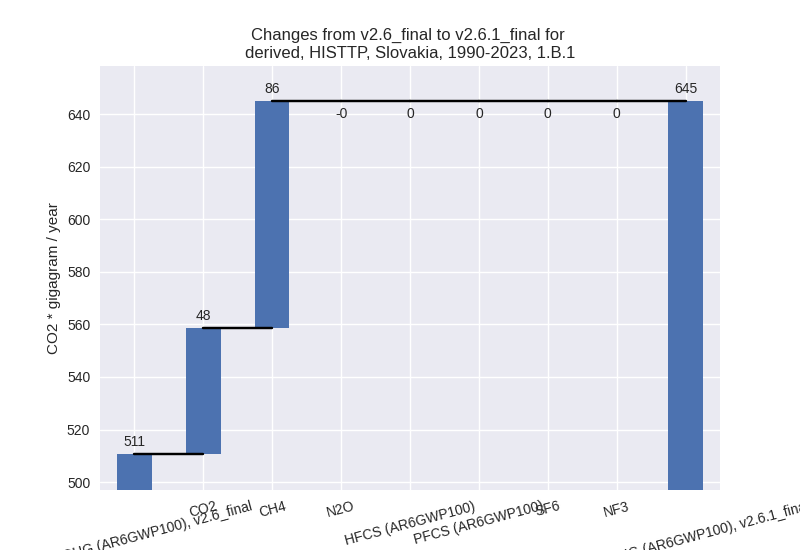
There is no subsector information available in PRIMAP-hist. - 1.B.2: Total sectoral emissions in 2022 are 1147.60
Gg CO2 / year which is 3.8% of category 1 emissions. 2023 Emissions have
changed by 101.5% (596.45 Gg CO2 /
year). 1990-2023 Emissions have changed by 50.0% (427.57 Gg CO2 / year). For 2023 the
changes per gas
are:
For 1990-2023 the changes per gas are: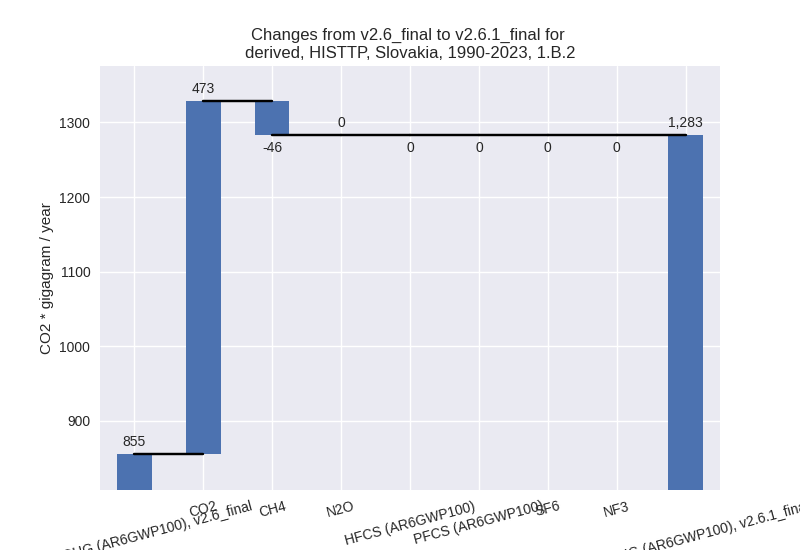
There is no subsector information available in PRIMAP-hist.
- 2: Total sectoral emissions in 2022 are 5959.25 Gg
CO2 / year which is 14.0% of M.0.EL emissions. 2023 Emissions have
changed by -8.7% (-551.21 Gg CO2 /
year). 1990-2023 Emissions have changed by -0.5% (-23.98 Gg CO2 / year). For 2023 the
changes per gas
are:
- M.AG: Total sectoral emissions in 2022 are 2427.36 Gg CO2 / year which is 5.7% of M.0.EL emissions. 2023 Emissions have changed by 0.1% (1.70 Gg CO2 / year). 1990-2023 Emissions have changed by 0.6% (19.26 Gg CO2 / year).
- 4: Total sectoral emissions in 2022 are 3575.78 Gg
CO2 / year which is 8.4% of M.0.EL emissions. 2023 Emissions have
changed by -5.3% (-195.79 Gg CO2 /
year). 1990-2023 Emissions have changed by -0.8% (-28.08 Gg CO2 / year). For 2023 the
changes per gas
are:
- 5: Total sectoral emissions in 2022 are 85.56 Gg
CO2 / year which is 0.2% of M.0.EL emissions. 2023 Emissions have
changed by -17.7% (-17.77 Gg CO2 /
year). 1990-2023 Emissions have changed by -14.2% (-19.03 Gg CO2 / year). For 2023
the changes per gas
are:

For 1990-2023 the changes per gas are: