Changes in PRIMAP-hist v2.6.1_final compared to v2.6_final for Sweden
2025-03-19
Johannes Gütschow
Change analysis for Sweden for PRIMAP-hist v2.6.1_final compared to v2.6_final
Overview over emissions by sector and gas
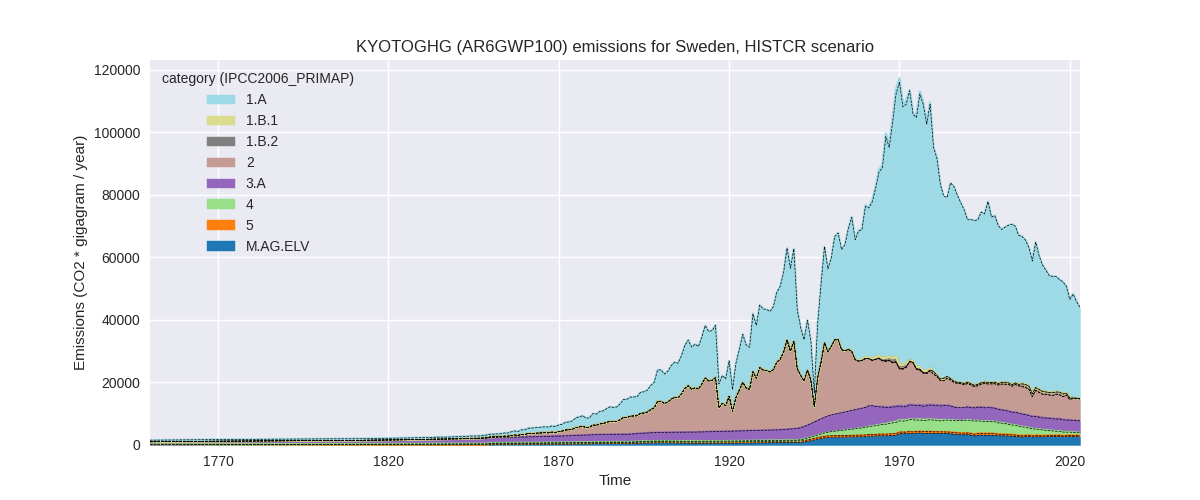
The following figures show the aggregate national total emissions excluding LULUCF AR6GWP100 for the country reported priority scenario. The dotted linesshow the v2.6_final data.
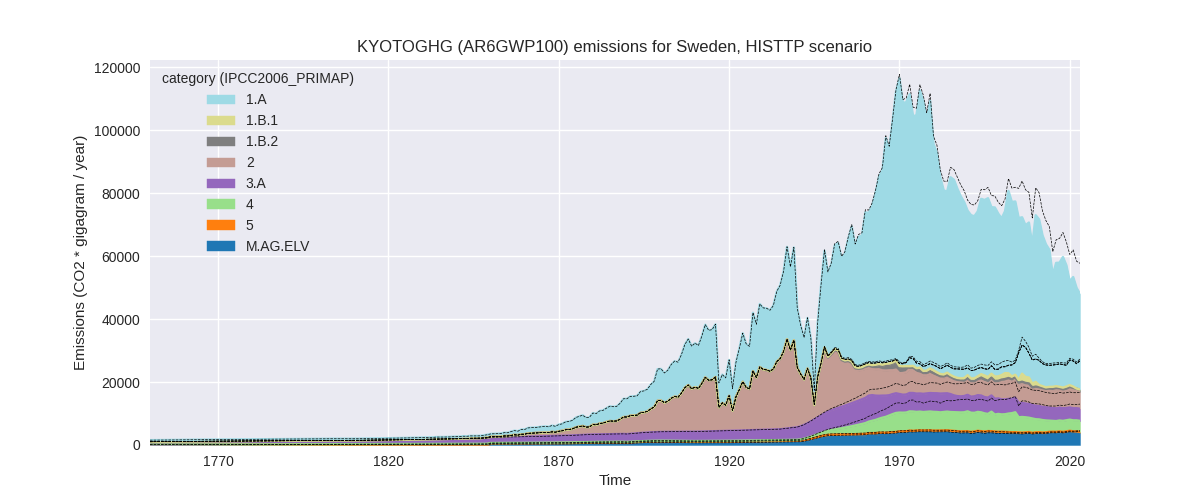
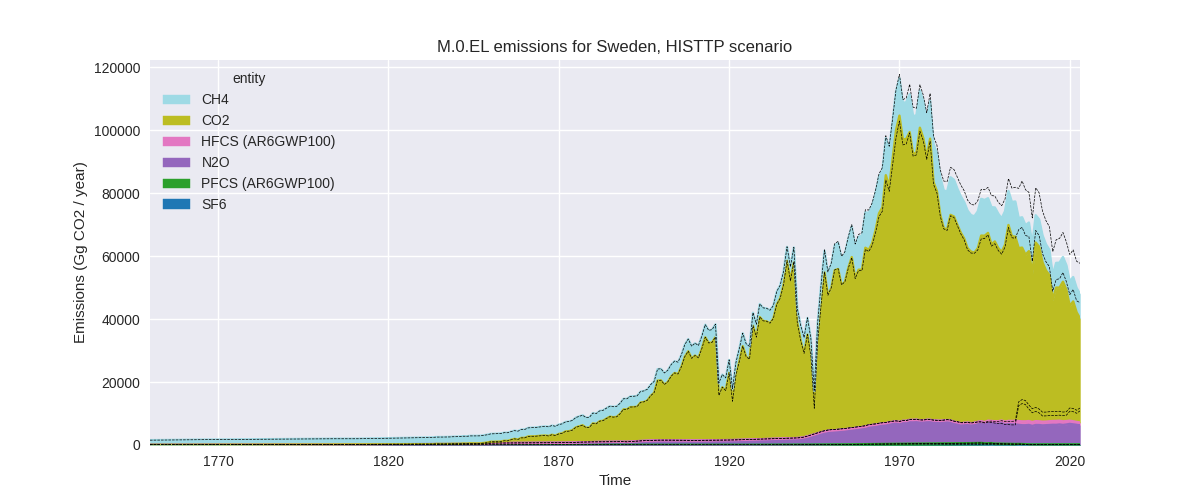
The following figures show the aggregate national total emissions excluding LULUCF AR6GWP100 for the third party priority scenario. The dotted linesshow the v2.6_final data.
Overview over changes
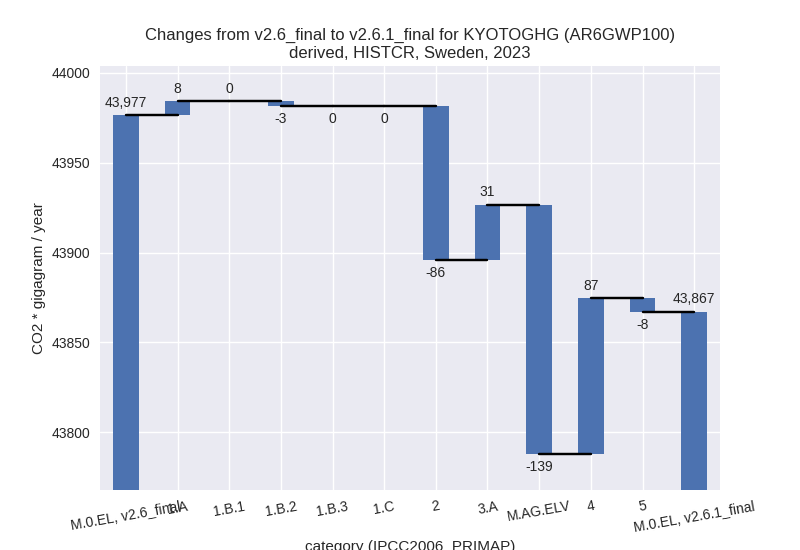
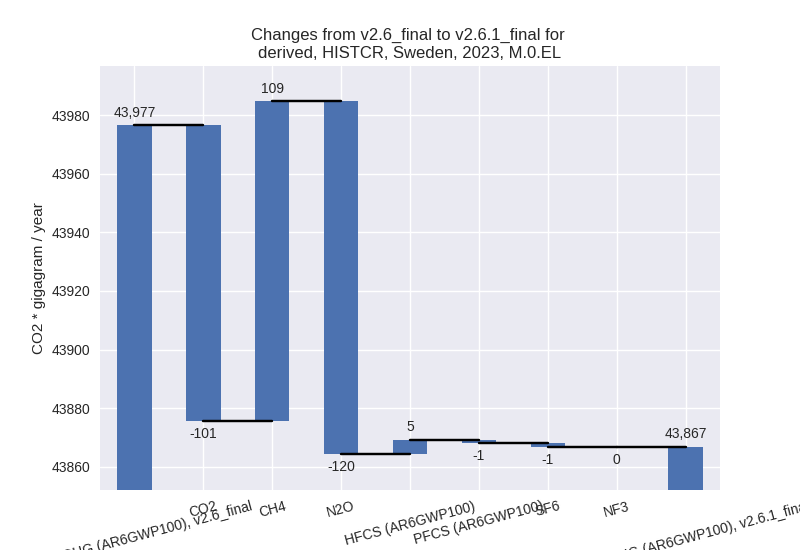
In the country reported priority scenario we have the following changes for aggregate Kyoto GHG and national total emissions excluding LULUCF (M.0.EL):
- Emissions in 2023 have changed by -0.2%% (-109.67 Gg CO2 / year)
- Emissions in 1990-2023 have changed by -0.0%% (-3.12 Gg CO2 / year)
In the third party priority scenario we have the following changes for aggregate Kyoto GHG and national total emissions excluding LULUCF (M.0.EL):
- Emissions in 2023 have changed by -16.9%% (-9754.32 Gg CO2 / year)
- Emissions in 1990-2023 have changed by -8.7%% (-6445.55 Gg CO2 / year)
Most important changes per scenario and time frame
In the country reported priority scenario the following sector-gas combinations have the highest absolute impact on national total KyotoGHG (AR6GWP100) emissions in 2023 (top 5):
- 1: M.AG.ELV, N2O with -147.69 Gg CO2 / year (-5.5%)
- 2: 2, CO2 with -98.16 Gg CO2 / year (-1.7%)
- 3: 4, CH4 with 90.10 Gg CO2 / year (17.0%)
- 4: 3.A, CH4 with 27.68 Gg CO2 / year (0.8%)
- 5: 1.A, N2O with 23.84 Gg CO2 / year (4.6%)
In the country reported priority scenario the following sector-gas combinations have the highest absolute impact on national total KyotoGHG (AR6GWP100) emissions in 1990-2023 (top 5):
- 1: M.AG.ELV, CH4 with 11.43 Gg CO2 / year (inf%)
- 2: 5, N2O with -11.20 Gg CO2 / year (-2.9%)
- 3: M.AG.ELV, N2O with -4.34 Gg CO2 / year (-0.2%)
- 4: 2, CO2 with -2.93 Gg CO2 / year (-0.0%)
- 5: 4, CH4 with 2.65 Gg CO2 / year (0.1%)
In the third party priority scenario the following sector-gas combinations have the highest absolute impact on national total KyotoGHG (AR6GWP100) emissions in 2023 (top 5):
- 1: 4, CH4 with -4919.43 Gg CO2 / year (-61.1%)
- 2: 2, N2O with -4268.28 Gg CO2 / year (-87.3%)
- 3: 1.B.2, CO2 with 560.48 Gg CO2 / year (inf%)
- 4: 2, CO2 with -447.83 Gg CO2 / year (-10.8%)
- 5: 1.B.1, CO2 with -440.61 Gg CO2 / year (-100.0%)
In the third party priority scenario the following sector-gas combinations have the highest absolute impact on national total KyotoGHG (AR6GWP100) emissions in 1990-2023 (top 5):
- 1: 4, CH4 with -4644.97 Gg CO2 / year (-50.8%)
- 2: 2, N2O with -2322.35 Gg CO2 / year (-77.5%)
- 3: 1.B.2, CO2 with 478.47 Gg CO2 / year (177611.4%)
- 4: 1.A, N2O with 46.31 Gg CO2 / year (4.8%)
- 5: 2, CO2 with -31.88 Gg CO2 / year (-0.9%)
Notes on data changes
Here we list notes explaining important emissions changes for the country.
- The CRT1 data from BTR1 is not usable because several sectors are marked as confidential and are missing in the sum varying on a year by year basis. Thus the values in the CRT tables don’t represent the actual emissions. We continue to use the emissions reported to the EU.
- Changes in the CR time-series are small and come from updated third party data (EDGAR, FAO) which is used to extrapolate the country reported data.
- Emissions in the TP scenario are much lower driven by high reduction in waste CH4 and chemical industry N2O emissions in the new EDGAR data. Fugitive CO2 emissions also have changed in the new EDGAR data, but the changes in subsectors cancel out. CO2 from chemical industry is lower in 2023 because the trend showed increasing emissions while the new EDGAR data shows a slight decrease.
Changes by sector and gas
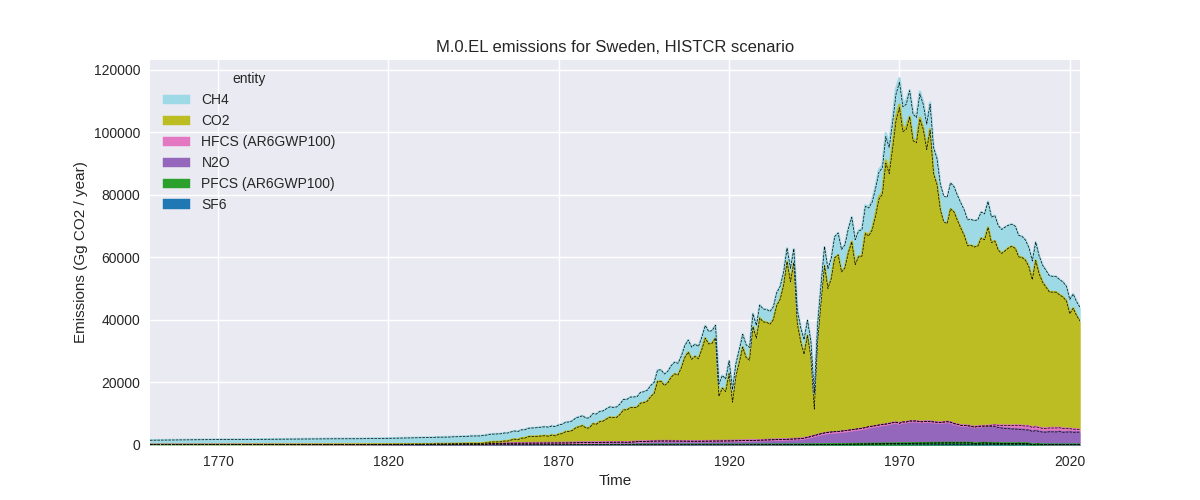
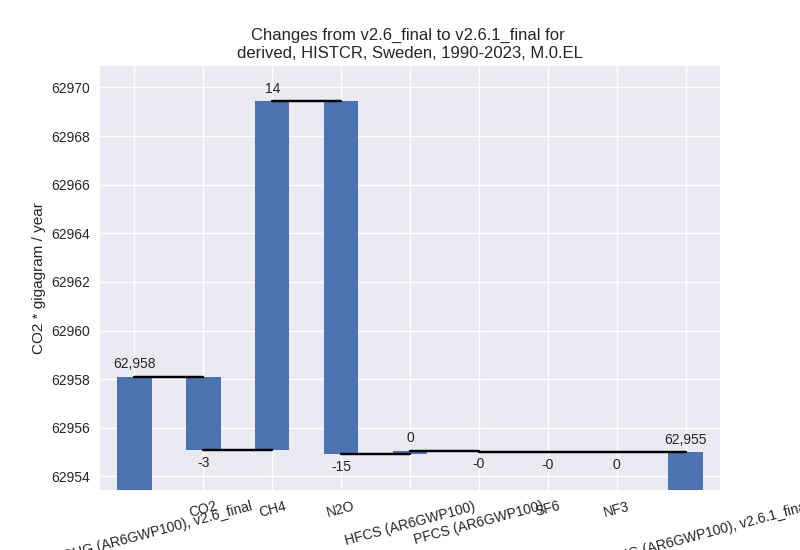
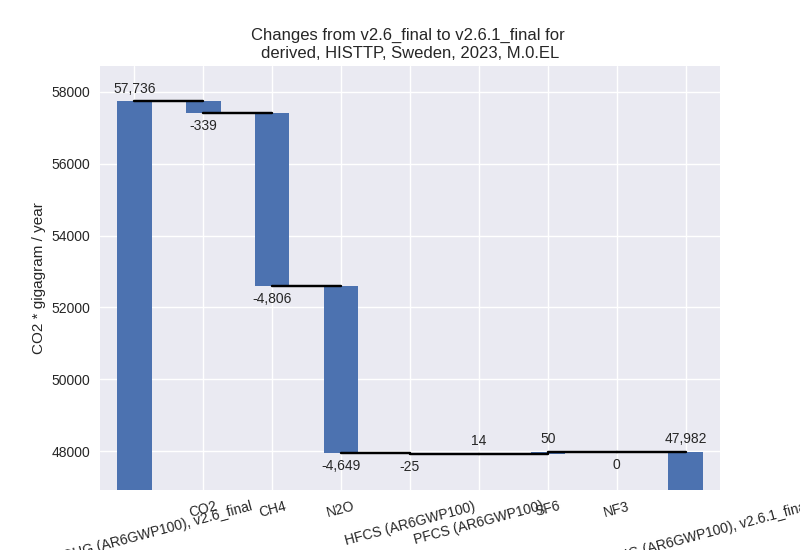
For each scenario and time frame the changes are displayed for all individual sectors and all individual gases. In the sector plot we use aggregate Kyoto GHGs in AR6GWP100. In the gas plot we usenational total emissions without LULUCF.
country reported scenario
2023
1990-2023
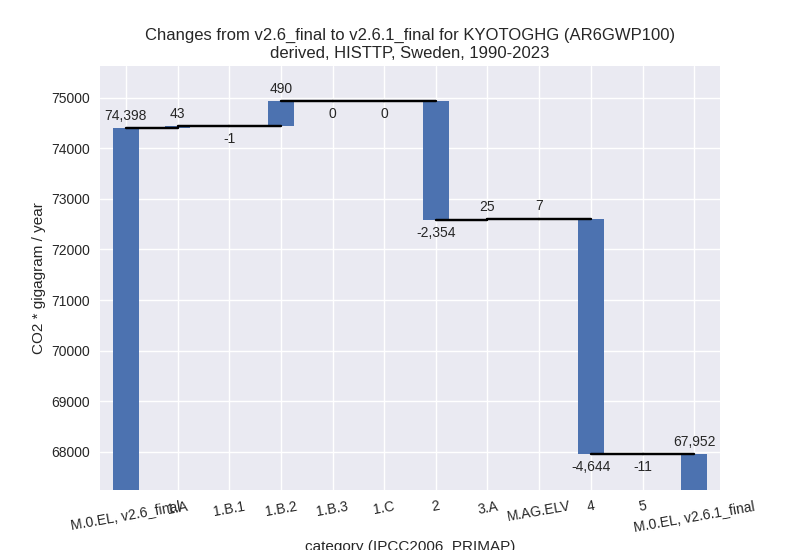
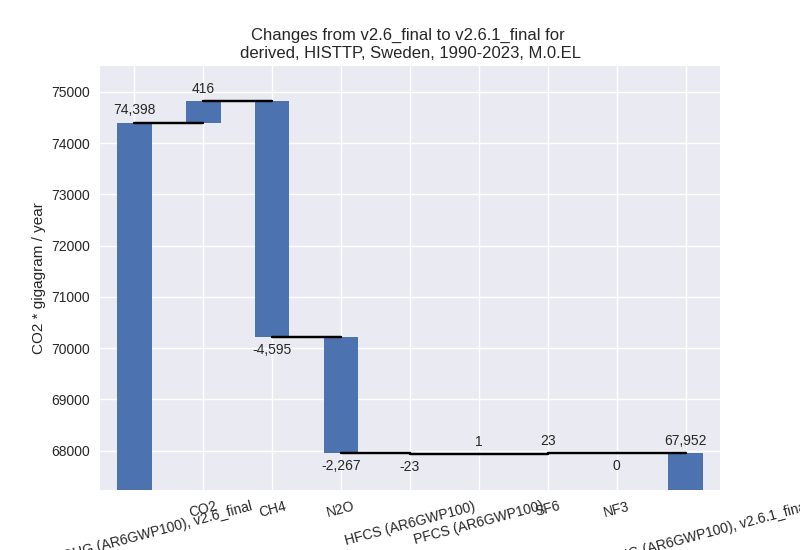
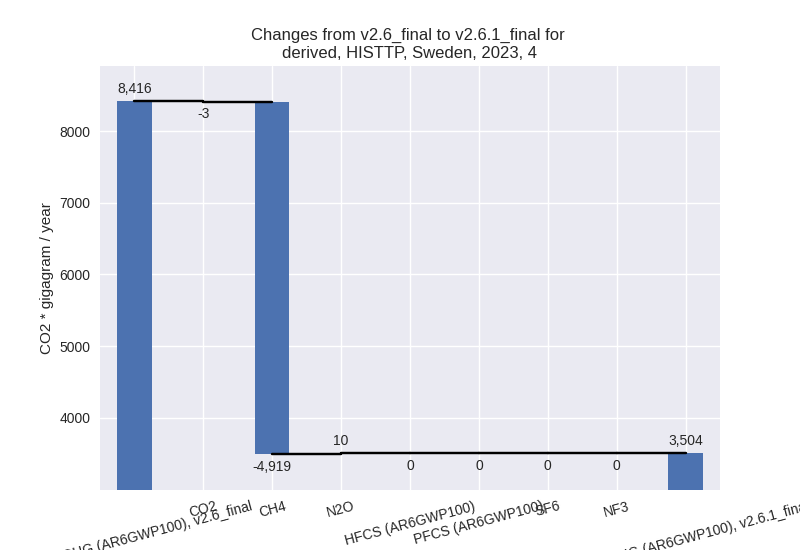
third party scenario
2023
1990-2023
Detailed changes for the scenarios:
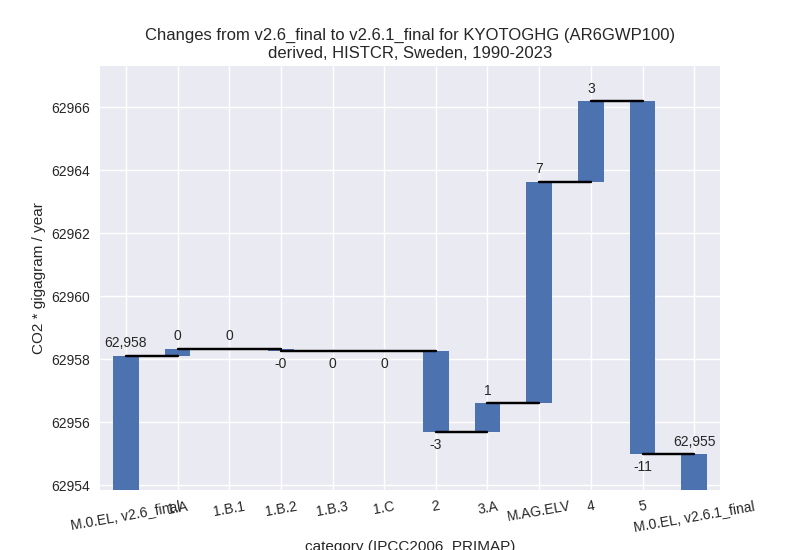
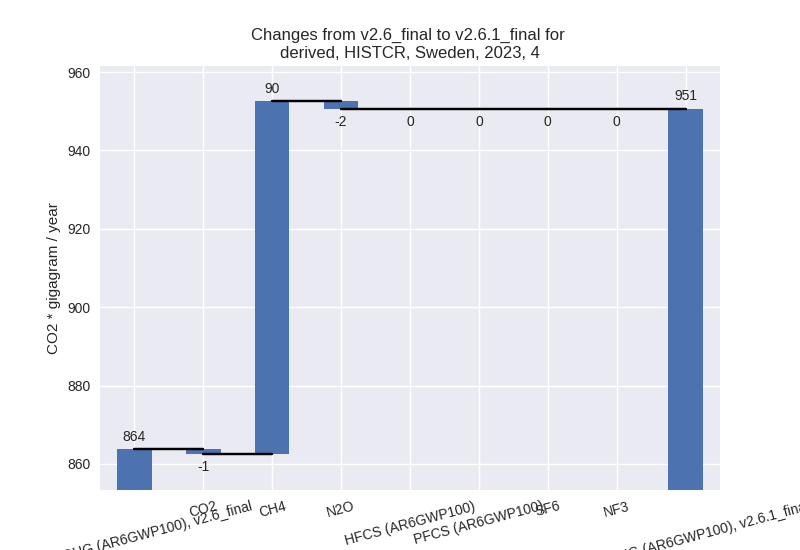
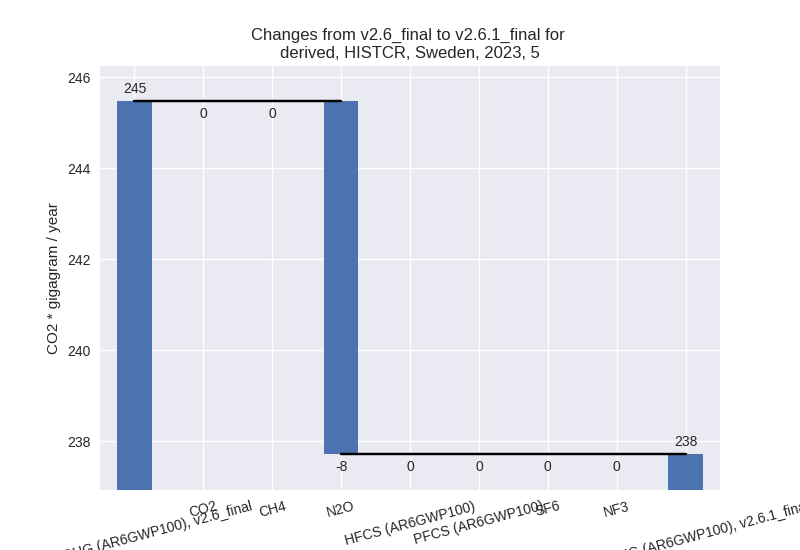
country reported scenario (HISTCR):
Most important changes per time frame
For 2023 the following sector-gas combinations have the highest absolute impact on national total KyotoGHG (AR6GWP100) emissions in 2023 (top 5):
- 1: M.AG.ELV, N2O with -147.69 Gg CO2 / year (-5.5%)
- 2: 2, CO2 with -98.16 Gg CO2 / year (-1.7%)
- 3: 4, CH4 with 90.10 Gg CO2 / year (17.0%)
- 4: 3.A, CH4 with 27.68 Gg CO2 / year (0.8%)
- 5: 1.A, N2O with 23.84 Gg CO2 / year (4.6%)
For 1990-2023 the following sector-gas combinations have the highest absolute impact on national total KyotoGHG (AR6GWP100) emissions in 1990-2023 (top 5):
- 1: M.AG.ELV, CH4 with 11.43 Gg CO2 / year (inf%)
- 2: 5, N2O with -11.20 Gg CO2 / year (-2.9%)
- 3: M.AG.ELV, N2O with -4.34 Gg CO2 / year (-0.2%)
- 4: 2, CO2 with -2.93 Gg CO2 / year (-0.0%)
- 5: 4, CH4 with 2.65 Gg CO2 / year (0.1%)
Changes in the main sectors for aggregate KyotoGHG (AR6GWP100) are
- 1: Total sectoral emissions in 2022 are 30883.23 Gg CO2 / year which is 67.4% of M.0.EL emissions. 2023 Emissions have changed by 0.0% (5.01 Gg CO2 / year). 1990-2023 Emissions have changed by 0.0% (0.15 Gg CO2 / year).
- 2: Total sectoral emissions in 2022 are 7134.08 Gg CO2 / year which is 15.6% of M.0.EL emissions. 2023 Emissions have changed by -1.2% (-85.55 Gg CO2 / year). 1990-2023 Emissions have changed by -0.0% (-2.56 Gg CO2 / year).
- M.AG: Total sectoral emissions in 2022 are 6597.73 Gg CO2 / year which is 14.4% of M.0.EL emissions. 2023 Emissions have changed by -1.6% (-108.35 Gg CO2 / year). 1990-2023 Emissions have changed by 0.1% (7.94 Gg CO2 / year).
- 4: Total sectoral emissions in 2022 are 948.47 Gg
CO2 / year which is 2.1% of M.0.EL emissions. 2023 Emissions have
changed by 10.1% (86.98 Gg CO2 /
year). 1990-2023 Emissions have changed by 0.1% (2.56 Gg CO2 / year). For 2023 the
changes per gas
are:
- 5: Total sectoral emissions in 2022 are 243.81 Gg
CO2 / year which is 0.5% of M.0.EL emissions. 2023 Emissions have
changed by -3.2% (-7.76 Gg CO2 /
year). 1990-2023 Emissions have changed by -2.9% (-11.20 Gg CO2 / year). For 2023 the
changes per gas
are:
For 1990-2023 the changes per gas are:
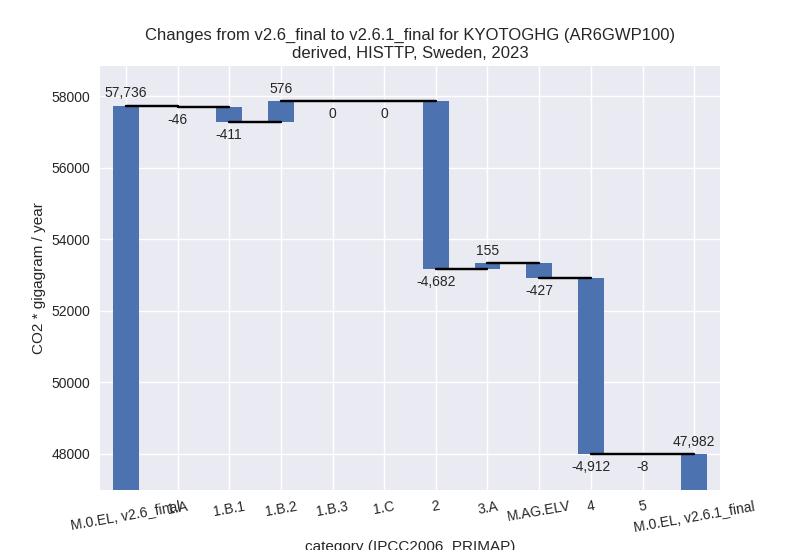
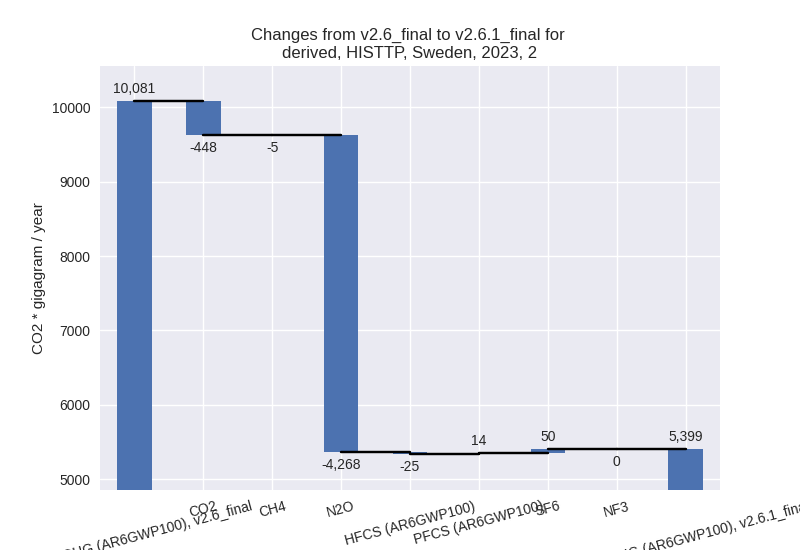
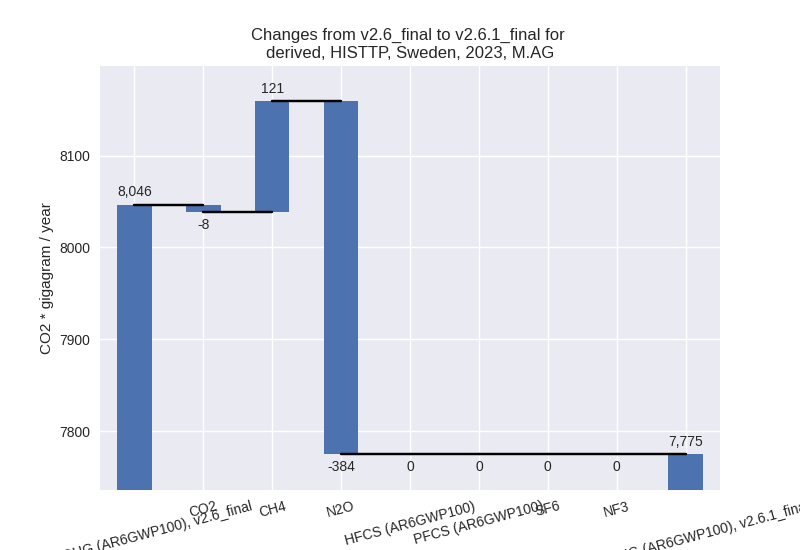
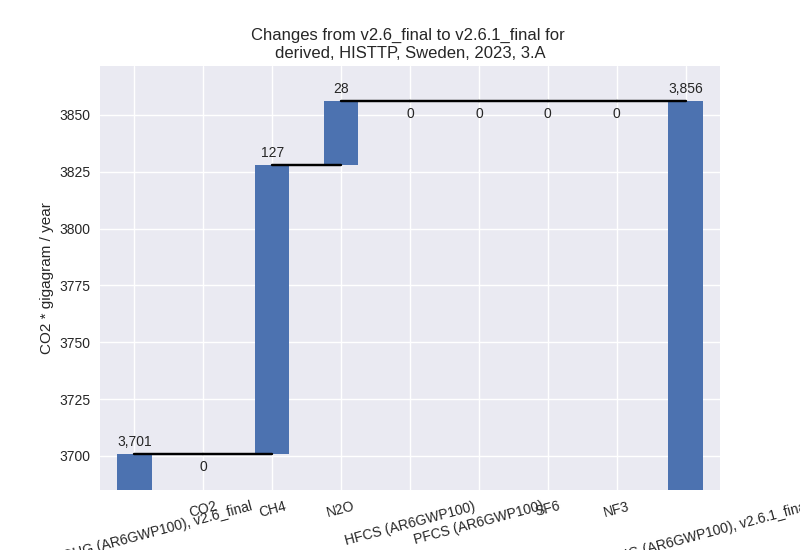
third party scenario (HISTTP):
Most important changes per time frame
For 2023 the following sector-gas combinations have the highest absolute impact on national total KyotoGHG (AR6GWP100) emissions in 2023 (top 5):
- 1: 4, CH4 with -4919.43 Gg CO2 / year (-61.1%)
- 2: 2, N2O with -4268.28 Gg CO2 / year (-87.3%)
- 3: 1.B.2, CO2 with 560.48 Gg CO2 / year (inf%)
- 4: 2, CO2 with -447.83 Gg CO2 / year (-10.8%)
- 5: 1.B.1, CO2 with -440.61 Gg CO2 / year (-100.0%)
For 1990-2023 the following sector-gas combinations have the highest absolute impact on national total KyotoGHG (AR6GWP100) emissions in 1990-2023 (top 5):
- 1: 4, CH4 with -4644.97 Gg CO2 / year (-50.8%)
- 2: 2, N2O with -2322.35 Gg CO2 / year (-77.5%)
- 3: 1.B.2, CO2 with 478.47 Gg CO2 / year (177611.4%)
- 4: 1.A, N2O with 46.31 Gg CO2 / year (4.8%)
- 5: 2, CO2 with -31.88 Gg CO2 / year (-0.9%)
Changes in the main sectors for aggregate KyotoGHG (AR6GWP100) are
- 1: Total sectoral emissions in 2022 are 32644.74 Gg CO2 / year which is 65.4% of M.0.EL emissions. 2023 Emissions have changed by 0.4% (118.49 Gg CO2 / year). 1990-2023 Emissions have changed by 1.1% (531.49 Gg CO2 / year).
- 2: Total sectoral emissions in 2022 are 5580.64 Gg
CO2 / year which is 11.2% of M.0.EL emissions. 2023 Emissions have
changed by -46.4% (-4681.66 Gg CO2 /
year). 1990-2023 Emissions have changed by -30.1% (-2354.06 Gg CO2 / year). For 2023
the changes per gas
are:
For 1990-2023 the changes per gas are:
- M.AG: Total sectoral emissions in 2022 are 7938.54
Gg CO2 / year which is 15.9% of M.0.EL emissions. 2023 Emissions have
changed by -3.4% (-271.48 Gg CO2 /
year). 1990-2023 Emissions have changed by 0.4% (32.38 Gg CO2 / year). For 2023 the
changes per gas
are:
The changes come from the following subsectors:- 3.A: Total sectoral emissions in 2022 are 3859.34
Gg CO2 / year which is 48.6% of category M.AG emissions. 2023 Emissions
have changed by 4.2% (155.27 Gg CO2
/ year). 1990-2023 Emissions have changed by 0.6% (25.32 Gg CO2 / year). For 2023 the
changes per gas
are:
There is no subsector information available in PRIMAP-hist. - M.AG.ELV: Total sectoral emissions in 2022 are
4079.19 Gg CO2 / year which is 51.4% of category M.AG emissions. 2023
Emissions have changed by -9.8%
(-426.74 Gg CO2 / year). 1990-2023 Emissions have changed by 0.2% (7.06 Gg CO2 / year). For 2023 the
changes per gas
are:
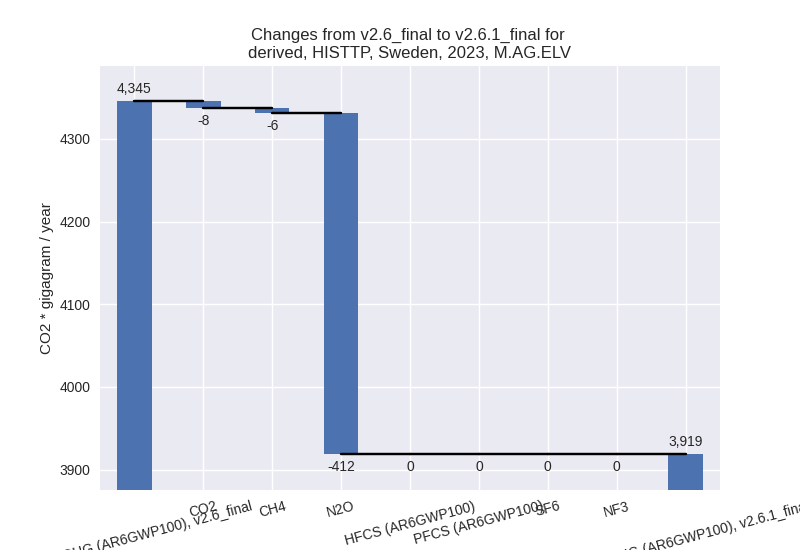
There is no subsector information available in PRIMAP-hist.
- 3.A: Total sectoral emissions in 2022 are 3859.34
Gg CO2 / year which is 48.6% of category M.AG emissions. 2023 Emissions
have changed by 4.2% (155.27 Gg CO2
/ year). 1990-2023 Emissions have changed by 0.6% (25.32 Gg CO2 / year). For 2023 the
changes per gas
are:
- 4: Total sectoral emissions in 2022 are 3500.53 Gg
CO2 / year which is 7.0% of M.0.EL emissions. 2023 Emissions have
changed by -58.4% (-4911.92 Gg CO2 /
year). 1990-2023 Emissions have changed by -49.2% (-4644.16 Gg CO2 / year). For 2023
the changes per gas
are:
For 1990-2023 the changes per gas are:
- 5: Total sectoral emissions in 2022 are 243.81 Gg
CO2 / year which is 0.5% of M.0.EL emissions. 2023 Emissions have
changed by -3.2% (-7.76 Gg CO2 /
year). 1990-2023 Emissions have changed by -2.9% (-11.20 Gg CO2 / year). For 2023 the
changes per gas
are:

For 1990-2023 the changes per gas are: