Changes in PRIMAP-hist v2.6.1_final compared to v2.6_final for Thailand
2025-03-19
Johannes Gütschow
Change analysis for Thailand for PRIMAP-hist v2.6.1_final compared to v2.6_final
Overview over emissions by sector and gas
The following figures show the aggregate national total emissions excluding LULUCF AR6GWP100 for the country reported priority scenario. The dotted linesshow the v2.6_final data.
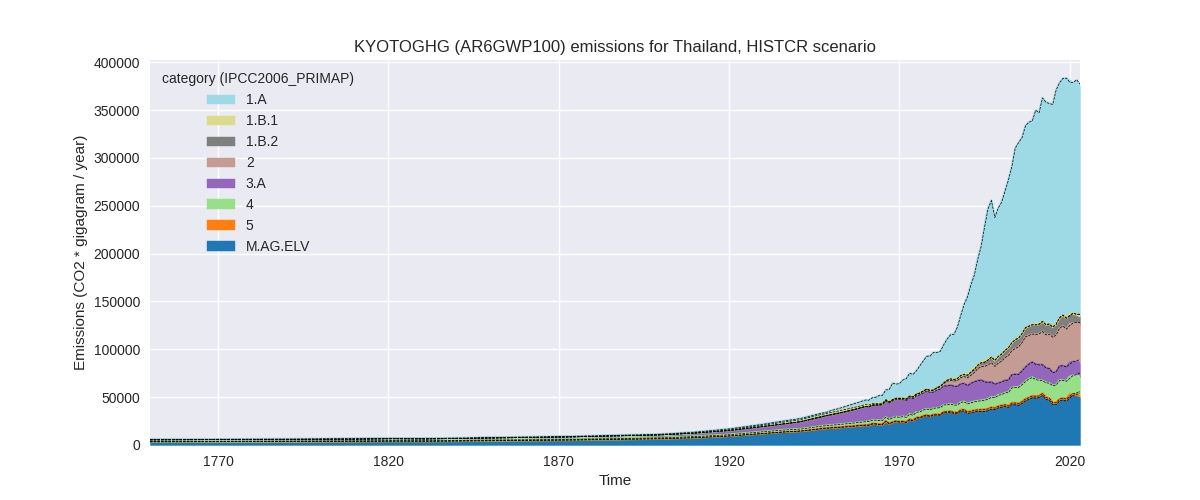
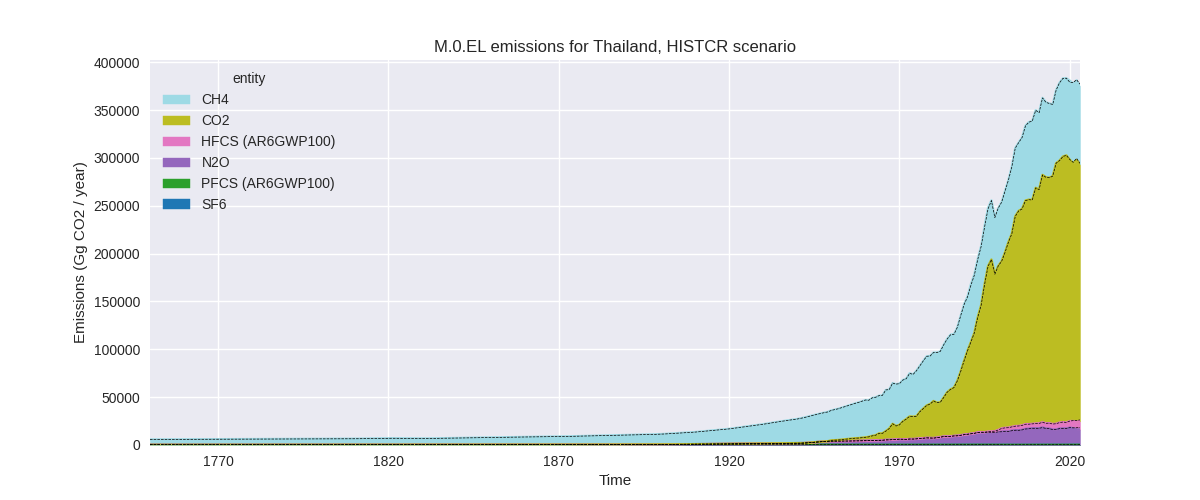
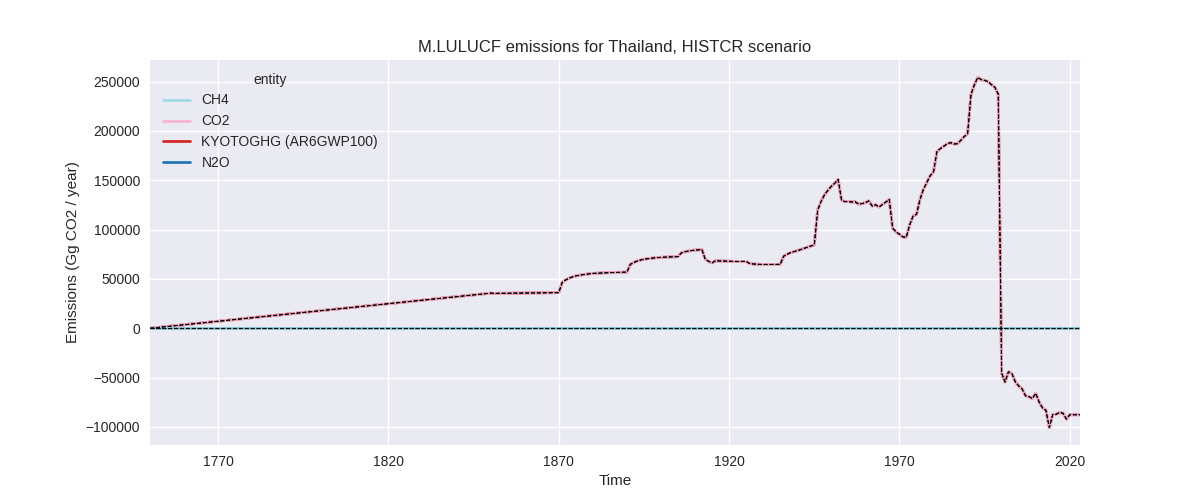
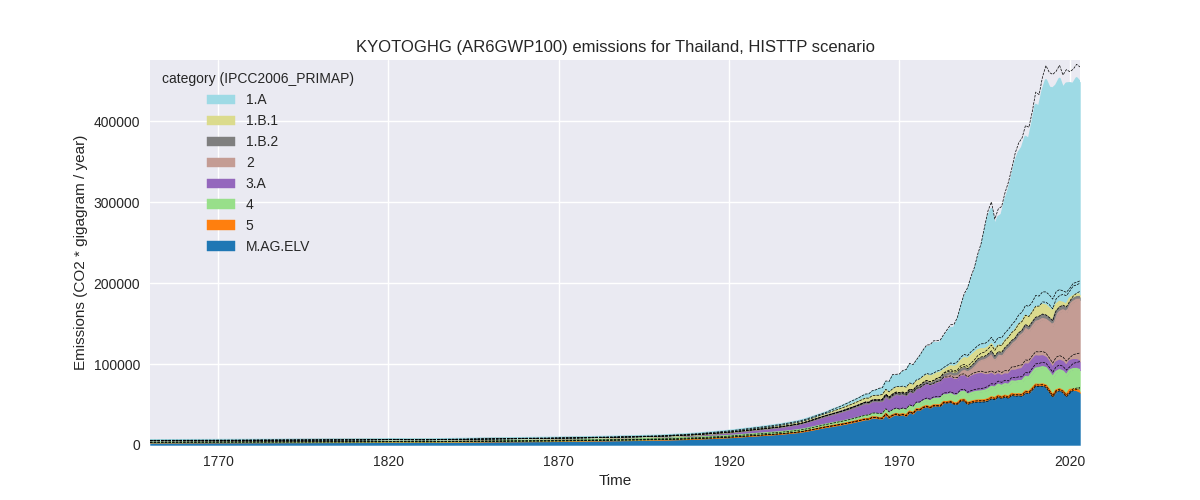
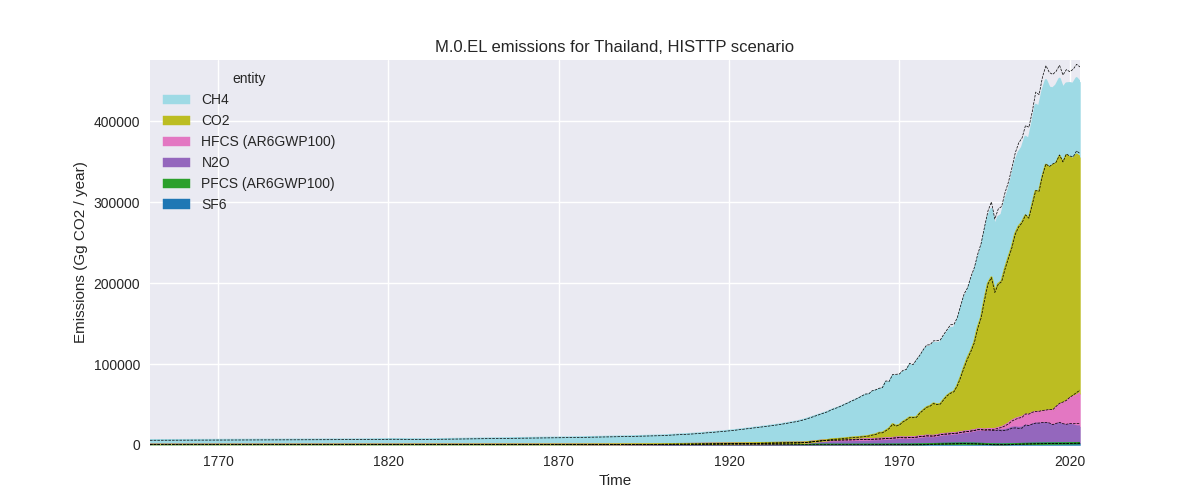
The following figures show the aggregate national total emissions excluding LULUCF AR6GWP100 for the third party priority scenario. The dotted linesshow the v2.6_final data.
Overview over changes
In the country reported priority scenario we have the following changes for aggregate Kyoto GHG and national total emissions excluding LULUCF (M.0.EL):
- Emissions in 2023 have changed by -0.6%% (-2114.33 Gg CO2 / year)
- Emissions in 1990-2023 have changed by 0.0%% (22.10 Gg CO2 / year)
In the third party priority scenario we have the following changes for aggregate Kyoto GHG and national total emissions excluding LULUCF (M.0.EL):
- Emissions in 2023 have changed by -4.0%% (-18739.00 Gg CO2 / year)
- Emissions in 1990-2023 have changed by -3.4%% (-12670.27 Gg CO2 / year)
Most important changes per scenario and time frame
In the country reported priority scenario the following sector-gas combinations have the highest absolute impact on national total KyotoGHG (AR6GWP100) emissions in 2023 (top 5):
- 1: M.AG.ELV, CH4 with -2484.69 Gg CO2 / year (-6.2%)
- 2: M.AG.ELV, N2O with -1981.15 Gg CO2 / year (-15.8%)
- 3: 4, CH4 with 913.25 Gg CO2 / year (5.0%)
- 4: 2, HFCS (AR6GWP100) with 847.65 Gg CO2 / year (10.7%)
- 5: 2, CO2 with 819.09 Gg CO2 / year (2.7%)
In the country reported priority scenario the following sector-gas combinations have the highest absolute impact on national total KyotoGHG (AR6GWP100) emissions in 1990-2023 (top 5):
- 1: 1.B.2, CH4 with 124.43 Gg CO2 / year (1.6%)
- 2: M.AG.ELV, N2O with -99.50 Gg CO2 / year (-1.0%)
- 3: 4, CH4 with 76.51 Gg CO2 / year (0.5%)
- 4: M.AG.ELV, CO2 with -55.23 Gg CO2 / year (-4.2%)
- 5: 1.A, N2O with -51.06 Gg CO2 / year (-2.9%)
In the third party priority scenario the following sector-gas combinations have the highest absolute impact on national total KyotoGHG (AR6GWP100) emissions in 2023 (top 5):
- 1: 1.B.2, CH4 with -6590.76 Gg CO2 / year (-68.1%)
- 2: 4, CH4 with -5671.70 Gg CO2 / year (-18.3%)
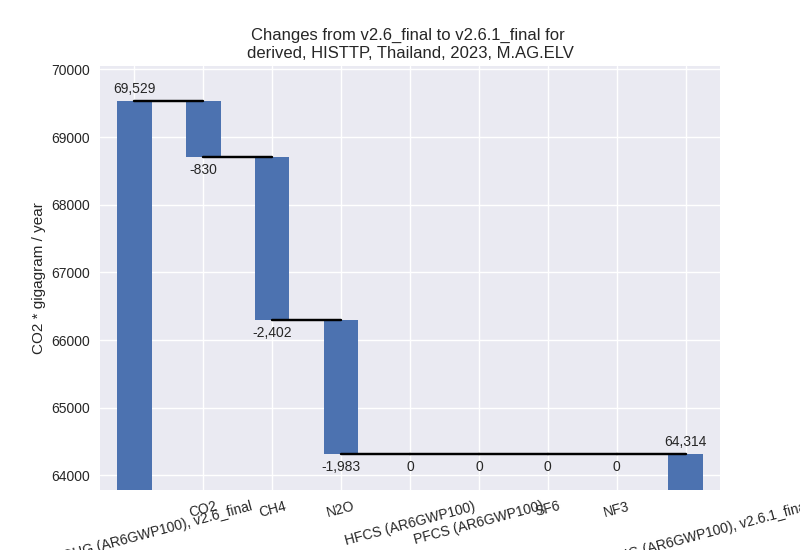
- 3: M.AG.ELV, CH4 with -2402.18 Gg CO2 / year (-4.6%)
- 4: M.AG.ELV, N2O with -1982.62 Gg CO2 / year (-14.0%)
- 5: 1.A, N2O with -1908.65 Gg CO2 / year (-33.9%)
In the third party priority scenario the following sector-gas combinations have the highest absolute impact on national total KyotoGHG (AR6GWP100) emissions in 1990-2023 (top 5):
- 1: 1.B.2, CH4 with -6743.21 Gg CO2 / year (-69.9%)
- 2: 4, CH4 with -5274.15 Gg CO2 / year (-23.7%)
- 3: 1.A, N2O with -618.01 Gg CO2 / year (-16.6%)
- 4: 1.B.2, CO2 with 124.85 Gg CO2 / year (26.1%)
- 5: M.AG.ELV, N2O with -103.65 Gg CO2 / year (-0.8%)
Notes on data changes
Here we list notes explaining important emissions changes for the country.
- No new country reported data has been included. Changes in the CR time-series are small and mostly limited to the latest years and come from updated third party data (EDGAR, FAO) which is used to extrapolate the country reported data.
- Changes in the TP time-series come from updated EDGAR and FAO data. FAO has adjusted data for the latest years while EDGAR has updated full time-series with the main change coming from the waste sector.
Changes by sector and gas
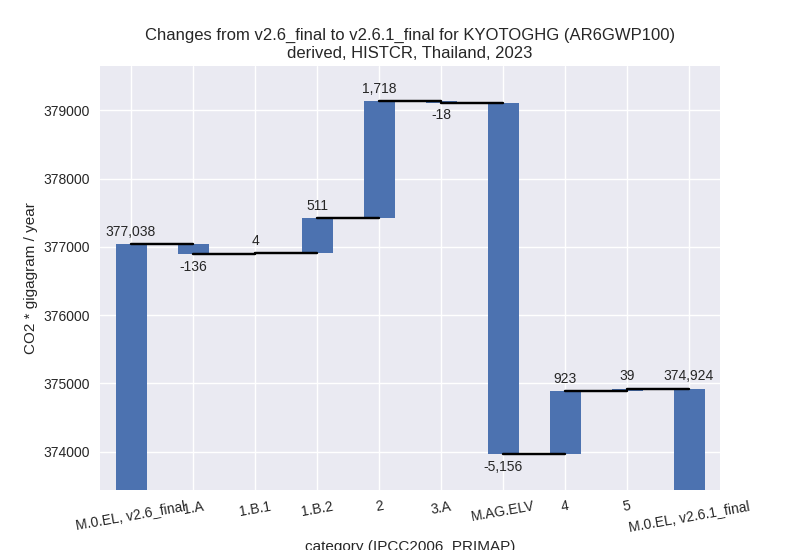
For each scenario and time frame the changes are displayed for all individual sectors and all individual gases. In the sector plot we use aggregate Kyoto GHGs in AR6GWP100. In the gas plot we usenational total emissions without LULUCF.
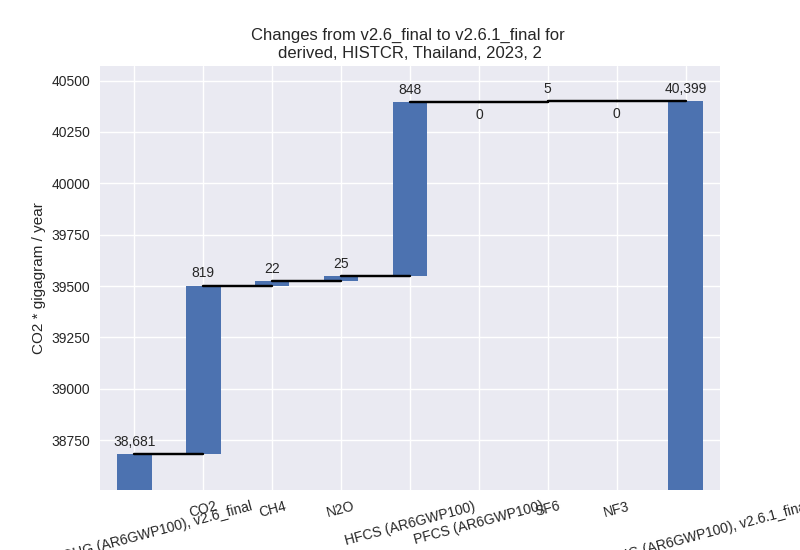
country reported scenario
2023
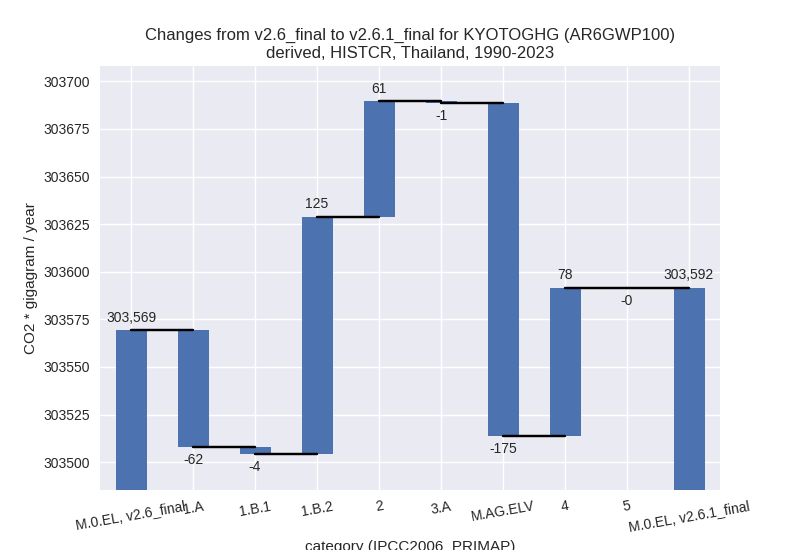
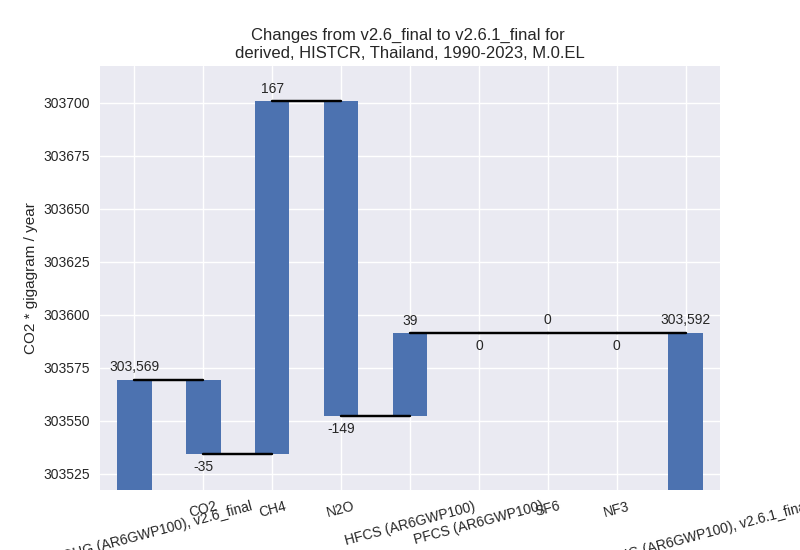
1990-2023
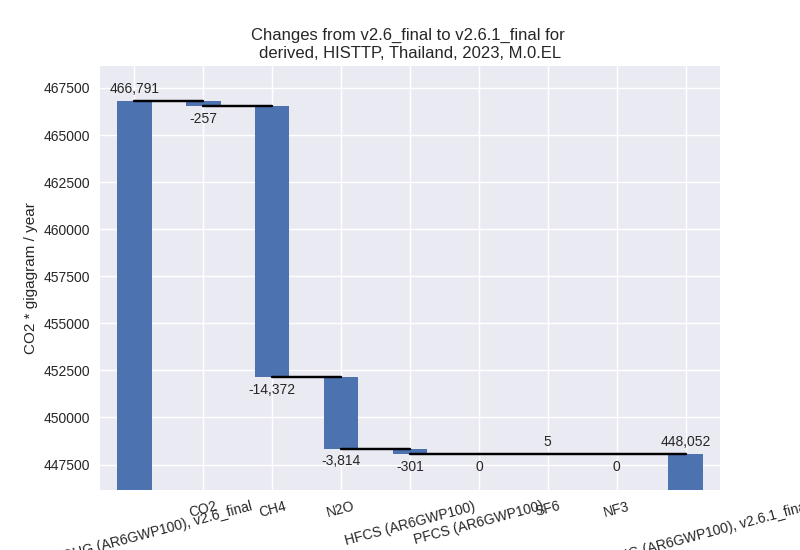
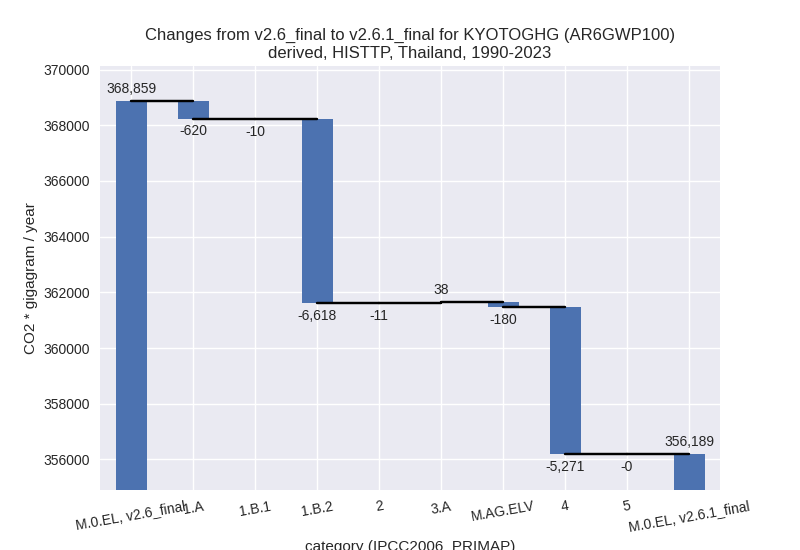
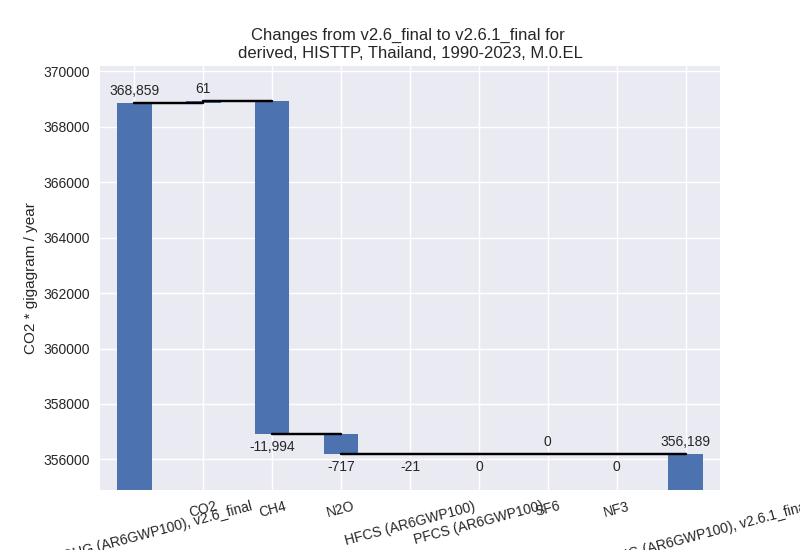
third party scenario
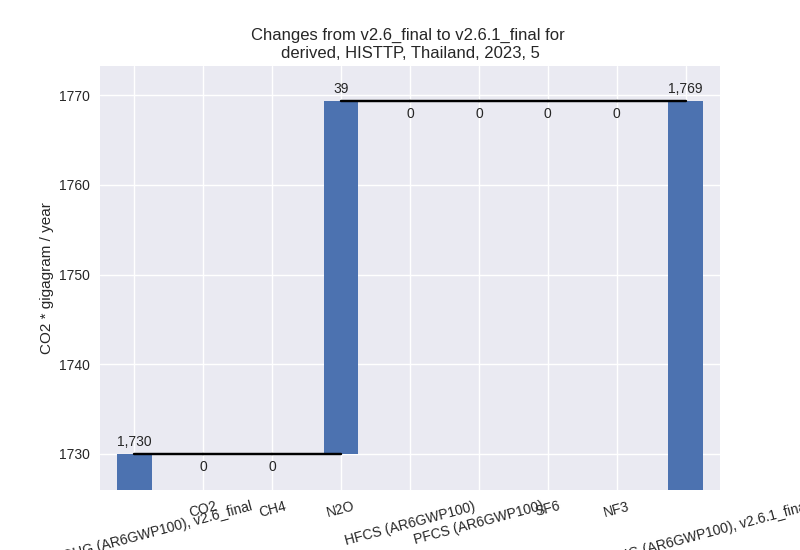
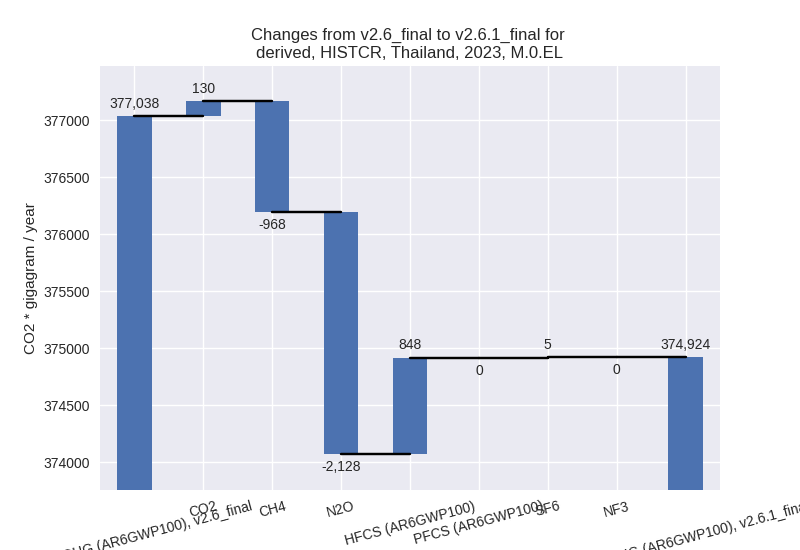
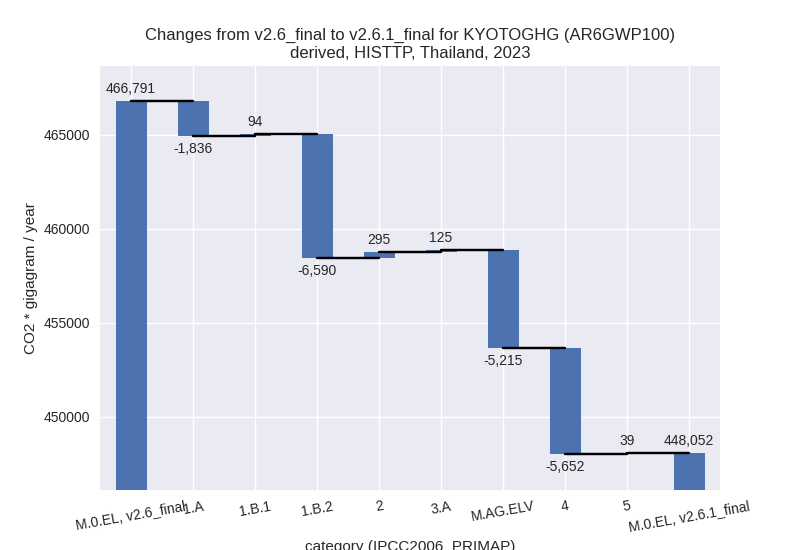
2023
1990-2023
Detailed changes for the scenarios:
country reported scenario (HISTCR):
Most important changes per time frame
For 2023 the following sector-gas combinations have the highest absolute impact on national total KyotoGHG (AR6GWP100) emissions in 2023 (top 5):
- 1: M.AG.ELV, CH4 with -2484.69 Gg CO2 / year (-6.2%)
- 2: M.AG.ELV, N2O with -1981.15 Gg CO2 / year (-15.8%)
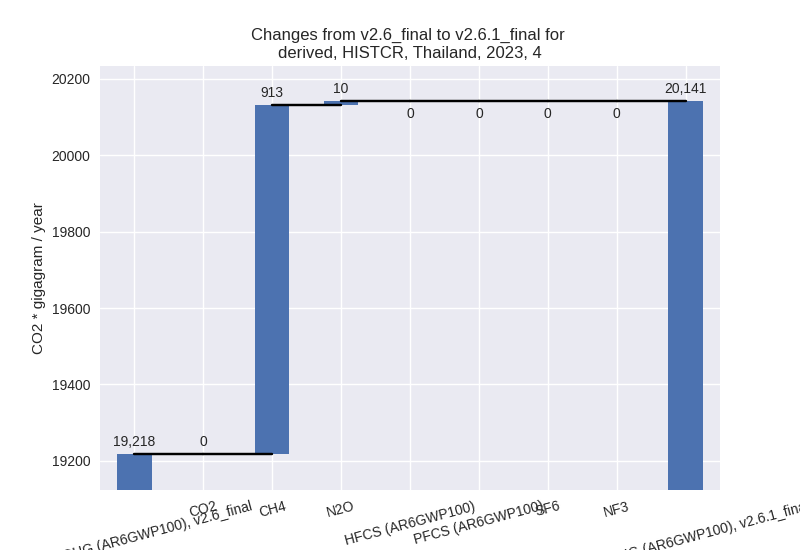
- 3: 4, CH4 with 913.25 Gg CO2 / year (5.0%)
- 4: 2, HFCS (AR6GWP100) with 847.65 Gg CO2 / year (10.7%)
- 5: 2, CO2 with 819.09 Gg CO2 / year (2.7%)
For 1990-2023 the following sector-gas combinations have the highest absolute impact on national total KyotoGHG (AR6GWP100) emissions in 1990-2023 (top 5):
- 1: 1.B.2, CH4 with 124.43 Gg CO2 / year (1.6%)
- 2: M.AG.ELV, N2O with -99.50 Gg CO2 / year (-1.0%)
- 3: 4, CH4 with 76.51 Gg CO2 / year (0.5%)
- 4: M.AG.ELV, CO2 with -55.23 Gg CO2 / year (-4.2%)
- 5: 1.A, N2O with -51.06 Gg CO2 / year (-2.9%)
Changes in the main sectors for aggregate KyotoGHG (AR6GWP100) are
- 1: Total sectoral emissions in 2022 are 253752.35 Gg CO2 / year which is 66.6% of M.0.EL emissions. 2023 Emissions have changed by 0.2% (378.74 Gg CO2 / year). 1990-2023 Emissions have changed by 0.0% (59.51 Gg CO2 / year).
- 2: Total sectoral emissions in 2022 are 40647.05 Gg
CO2 / year which is 10.7% of M.0.EL emissions. 2023 Emissions have
changed by 4.4% (1718.20 Gg CO2 /
year). 1990-2023 Emissions have changed by 0.2% (60.58 Gg CO2 / year). For 2023 the
changes per gas
are:
- M.AG: Total sectoral emissions in 2022 are 65122.26
Gg CO2 / year which is 17.1% of M.0.EL emissions. 2023 Emissions have
changed by -7.6% (-5173.88 Gg CO2 /
year). 1990-2023 Emissions have changed by -0.3% (-175.52 Gg CO2 / year). For 2023
the changes per gas
are:

The changes come from the following subsectors:- 3.A: Total sectoral emissions in 2022 are 14175.77 Gg CO2 / year which is 21.8% of category M.AG emissions. 2023 Emissions have changed by -0.1% (-18.33 Gg CO2 / year). 1990-2023 Emissions have changed by -0.0% (-0.78 Gg CO2 / year).
- M.AG.ELV: Total sectoral emissions in 2022 are
50946.49 Gg CO2 / year which is 78.2% of category M.AG emissions. 2023
Emissions have changed by -9.5%
(-5155.54 Gg CO2 / year). 1990-2023 Emissions have changed by -0.4% (-174.73 Gg CO2 / year). For 2023
the changes per gas
are:

There is no subsector information available in PRIMAP-hist.
- 4: Total sectoral emissions in 2022 are 19774.75 Gg
CO2 / year which is 5.2% of M.0.EL emissions. 2023 Emissions have
changed by 4.8% (923.28 Gg CO2 /
year). 1990-2023 Emissions have changed by 0.5% (77.64 Gg CO2 / year). For 2023 the
changes per gas
are:
- 5: Total sectoral emissions in 2022 are 1630.76 Gg
CO2 / year which is 0.4% of M.0.EL emissions. 2023 Emissions have
changed by 2.3% (39.33 Gg CO2 /
year). 1990-2023 Emissions have changed by -0.0% (-0.11 Gg CO2 / year). For 2023 the
changes per gas
are:

third party scenario (HISTTP):
Most important changes per time frame
For 2023 the following sector-gas combinations have the highest absolute impact on national total KyotoGHG (AR6GWP100) emissions in 2023 (top 5):
- 1: 1.B.2, CH4 with -6590.76 Gg CO2 / year (-68.1%)
- 2: 4, CH4 with -5671.70 Gg CO2 / year (-18.3%)
- 3: M.AG.ELV, CH4 with -2402.18 Gg CO2 / year (-4.6%)
- 4: M.AG.ELV, N2O with -1982.62 Gg CO2 / year (-14.0%)
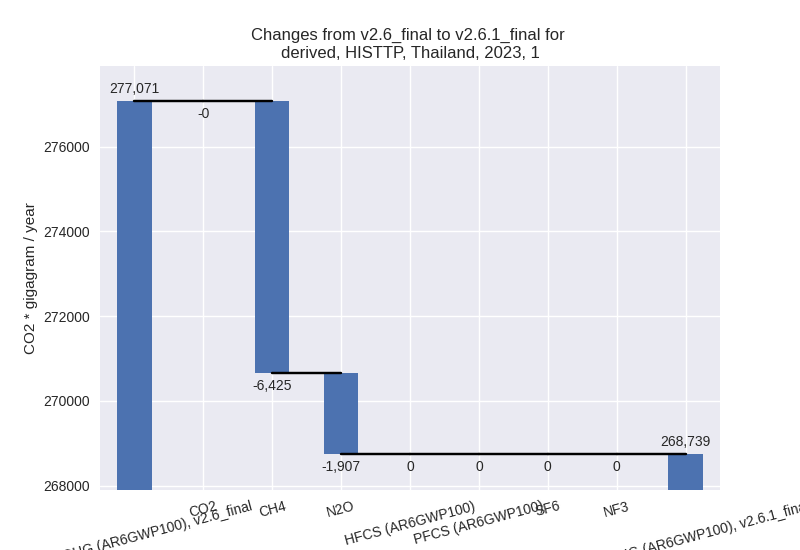
- 5: 1.A, N2O with -1908.65 Gg CO2 / year (-33.9%)
For 1990-2023 the following sector-gas combinations have the highest absolute impact on national total KyotoGHG (AR6GWP100) emissions in 1990-2023 (top 5):
- 1: 1.B.2, CH4 with -6743.21 Gg CO2 / year (-69.9%)
- 2: 4, CH4 with -5274.15 Gg CO2 / year (-23.7%)
- 3: 1.A, N2O with -618.01 Gg CO2 / year (-16.6%)
- 4: 1.B.2, CO2 with 124.85 Gg CO2 / year (26.1%)
- 5: M.AG.ELV, N2O with -103.65 Gg CO2 / year (-0.8%)
Changes in the main sectors for aggregate KyotoGHG (AR6GWP100) are
- 1: Total sectoral emissions in 2022 are 273552.10
Gg CO2 / year which is 60.4% of M.0.EL emissions. 2023 Emissions have
changed by -3.0% (-8331.81 Gg CO2 /
year). 1990-2023 Emissions have changed by -3.2% (-7247.17 Gg CO2 / year). For 2023
the changes per gas
are:
For 1990-2023 the changes per gas are:
The changes come from the following subsectors:- 1.A: Total sectoral emissions in 2022 are 267028.03 Gg CO2 / year which is 97.6% of category 1 emissions. 2023 Emissions have changed by -0.7% (-1835.97 Gg CO2 / year). 1990-2023 Emissions have changed by -0.3% (-619.88 Gg CO2 / year).
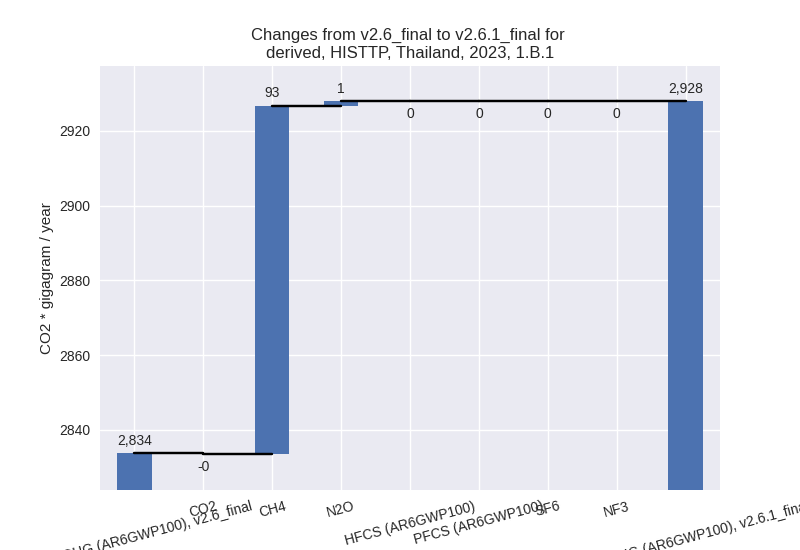
- 1.B.1: Total sectoral emissions in 2022 are 2945.19
Gg CO2 / year which is 1.1% of category 1 emissions. 2023 Emissions have
changed by 3.3% (94.22 Gg CO2 /
year). 1990-2023 Emissions have changed by -0.1% (-9.61 Gg CO2 / year). For 2023 the
changes per gas
are:
There is no subsector information available in PRIMAP-hist. - 1.B.2: Total sectoral emissions in 2022 are 3578.89
Gg CO2 / year which is 1.3% of category 1 emissions. 2023 Emissions have
changed by -65.0% (-6590.07 Gg CO2 /
year). 1990-2023 Emissions have changed by -65.4% (-6617.68 Gg CO2 / year). For 2023
the changes per gas
are:
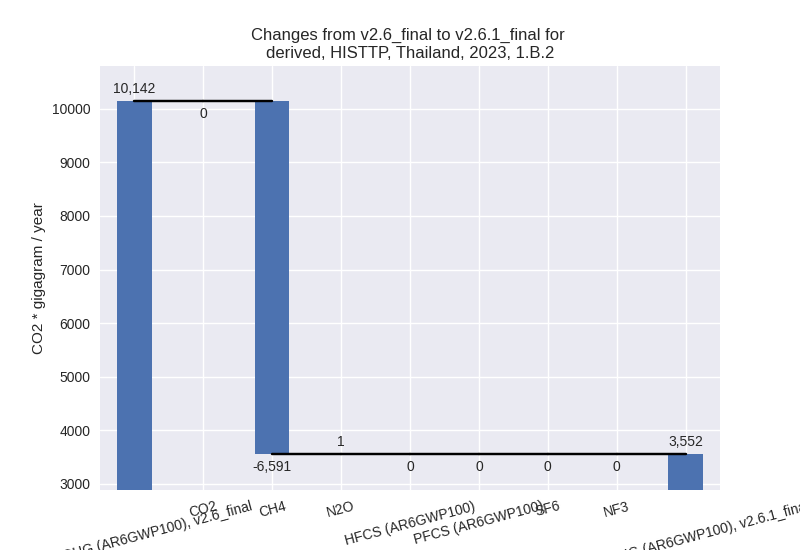
For 1990-2023 the changes per gas are: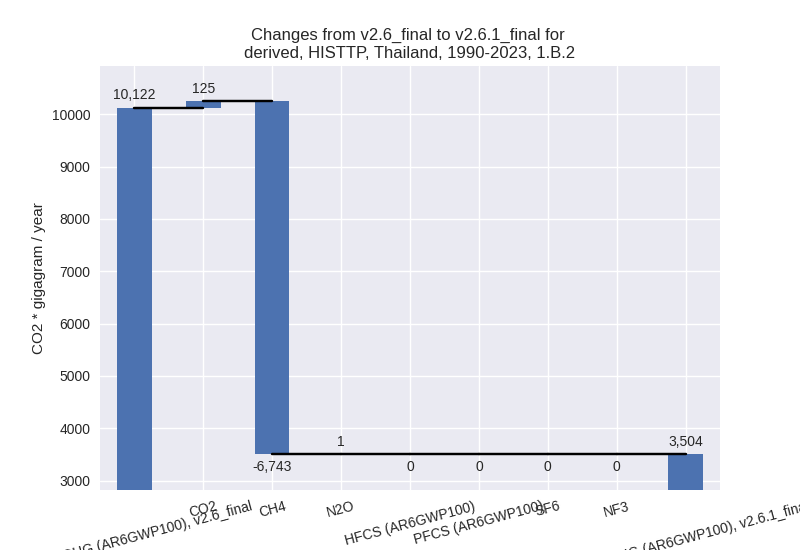
There is no subsector information available in PRIMAP-hist.
- 2: Total sectoral emissions in 2022 are 74569.88 Gg CO2 / year which is 16.5% of M.0.EL emissions. 2023 Emissions have changed by 0.4% (295.30 Gg CO2 / year). 1990-2023 Emissions have changed by -0.0% (-10.67 Gg CO2 / year).
- M.AG: Total sectoral emissions in 2022 are 77315.57
Gg CO2 / year which is 17.1% of M.0.EL emissions. 2023 Emissions have
changed by -6.4% (-5089.52 Gg CO2 /
year). 1990-2023 Emissions have changed by -0.2% (-141.57 Gg CO2 / year). For 2023
the changes per gas
are:

The changes come from the following subsectors:- 3.A: Total sectoral emissions in 2022 are 10874.58 Gg CO2 / year which is 14.1% of category M.AG emissions. 2023 Emissions have changed by 1.2% (125.45 Gg CO2 / year). 1990-2023 Emissions have changed by 0.3% (38.23 Gg CO2 / year).
- M.AG.ELV: Total sectoral emissions in 2022 are
66441.00 Gg CO2 / year which is 85.9% of category M.AG emissions. 2023
Emissions have changed by -7.5%
(-5214.97 Gg CO2 / year). 1990-2023 Emissions have changed by -0.3% (-179.80 Gg CO2 / year). For 2023
the changes per gas
are:
There is no subsector information available in PRIMAP-hist.
- 4: Total sectoral emissions in 2022 are 25654.88 Gg
CO2 / year which is 5.7% of M.0.EL emissions. 2023 Emissions have
changed by -17.8% (-5652.30 Gg CO2 /
year). 1990-2023 Emissions have changed by -22.9% (-5270.74 Gg CO2 / year). For 2023
the changes per gas
are:

For 1990-2023 the changes per gas are: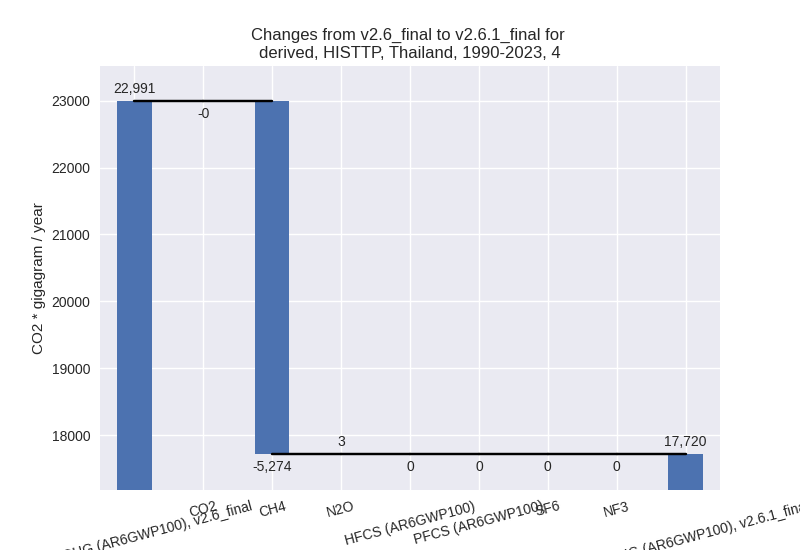
- 5: Total sectoral emissions in 2022 are 1630.76 Gg
CO2 / year which is 0.4% of M.0.EL emissions. 2023 Emissions have
changed by 2.3% (39.33 Gg CO2 /
year). 1990-2023 Emissions have changed by -0.0% (-0.11 Gg CO2 / year). For 2023 the
changes per gas
are: