Changes in PRIMAP-hist v2.6.1_final compared to v2.6_final for Turkmenistan
2025-03-19
Johannes Gütschow
Change analysis for Turkmenistan for PRIMAP-hist v2.6.1_final compared to v2.6_final
Overview over emissions by sector and gas
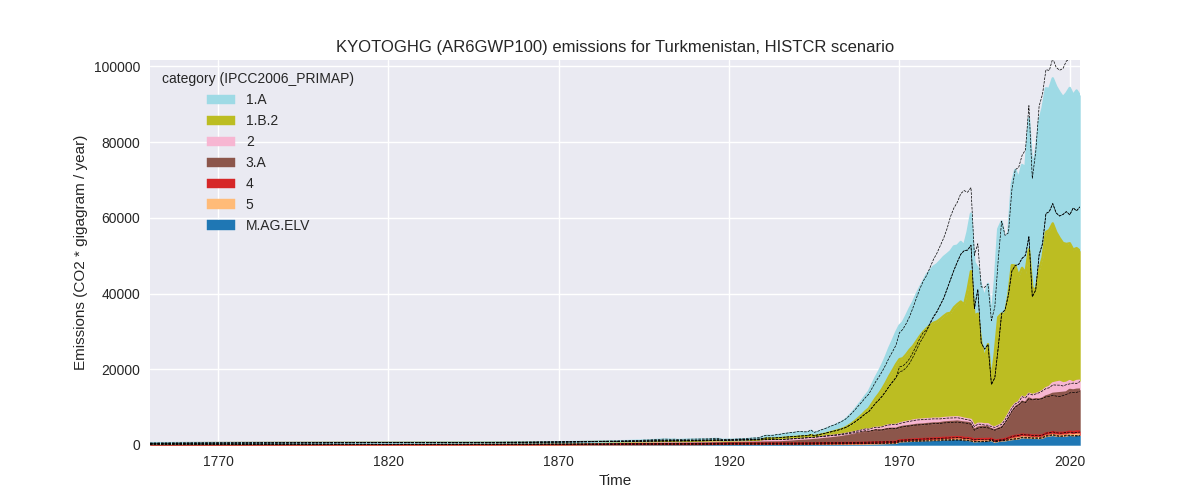
The following figures show the aggregate national total emissions excluding LULUCF AR6GWP100 for the country reported priority scenario. The dotted linesshow the v2.6_final data.
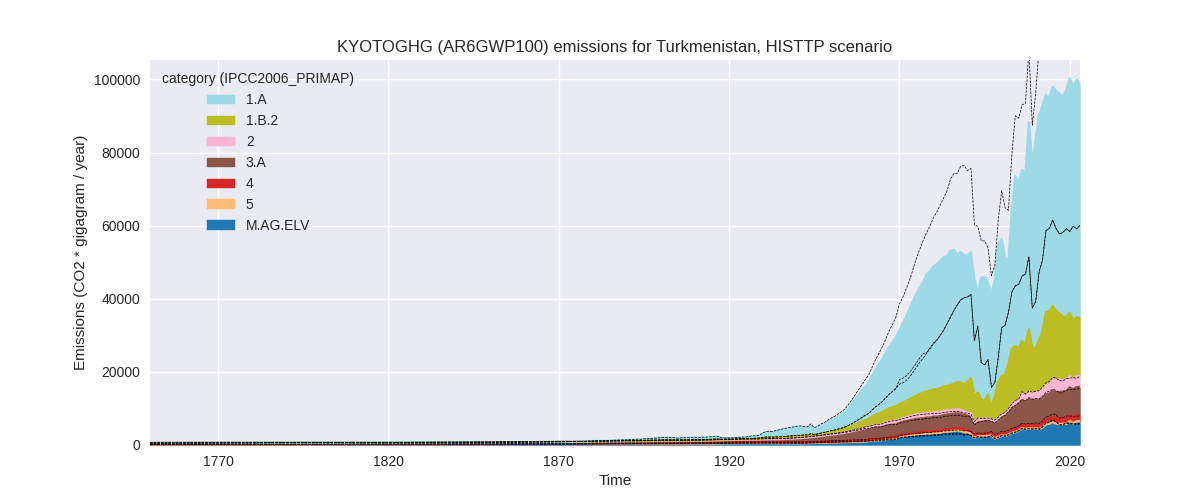
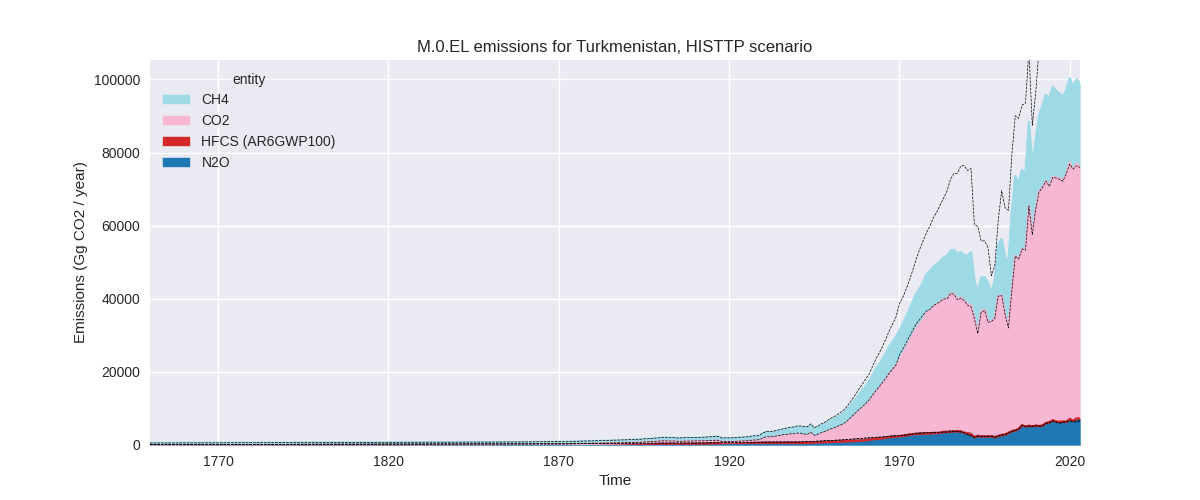
The following figures show the aggregate national total emissions excluding LULUCF AR6GWP100 for the third party priority scenario. The dotted linesshow the v2.6_final data.
Overview over changes
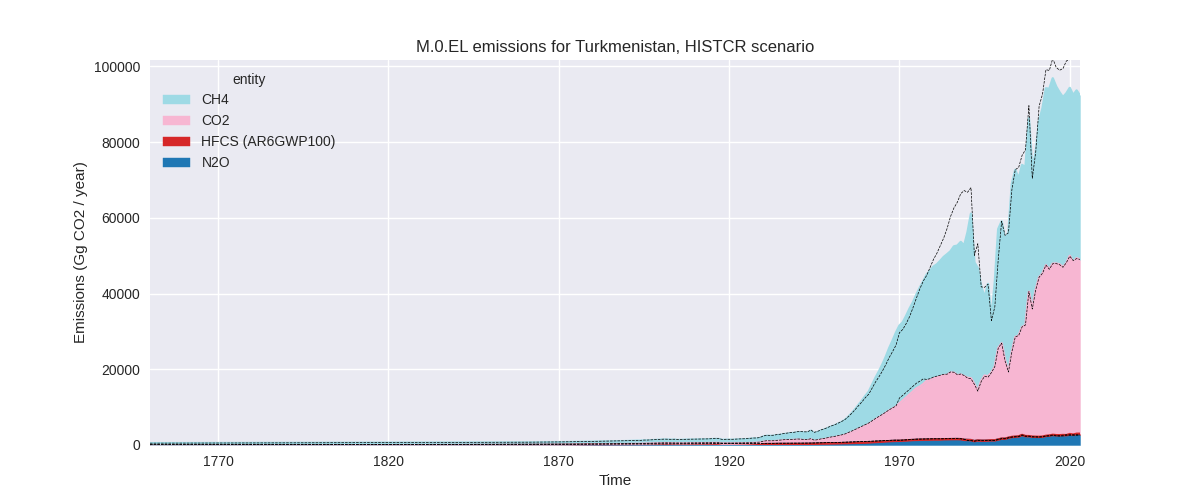
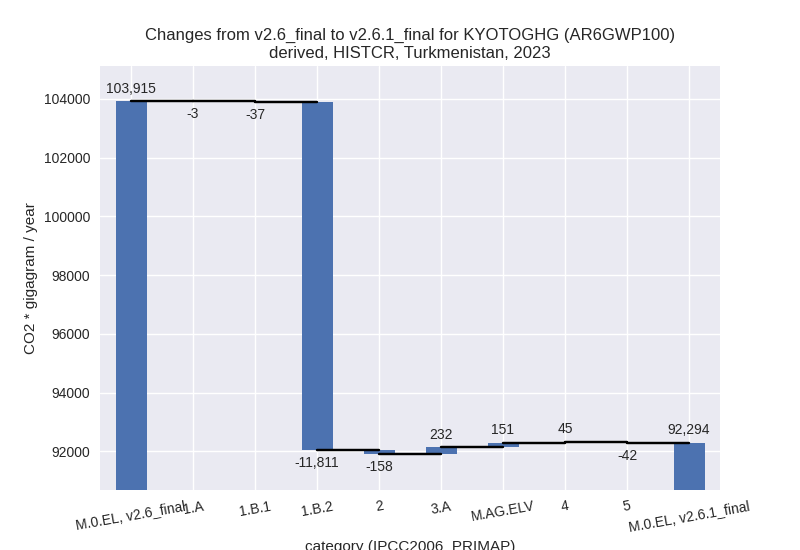
In the country reported priority scenario we have the following changes for aggregate Kyoto GHG and national total emissions excluding LULUCF (M.0.EL):
- Emissions in 2023 have changed by -11.2%% (-11621.03 Gg CO2 / year)
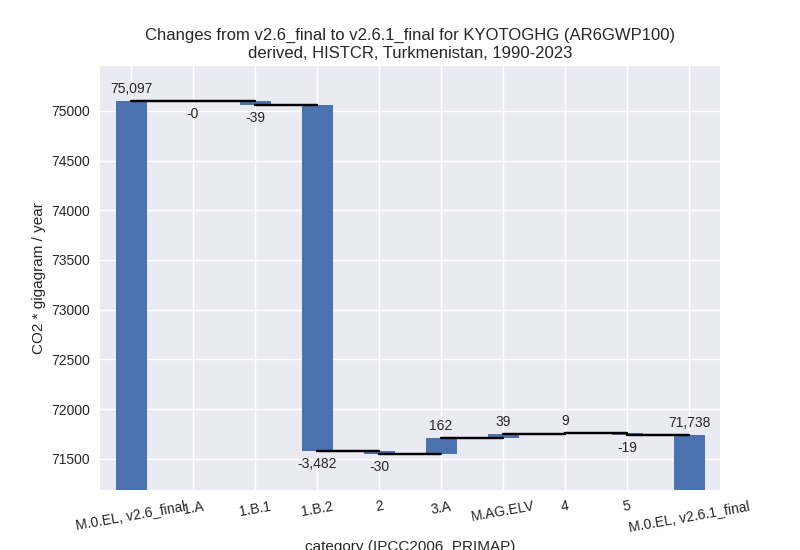
- Emissions in 1990-2023 have changed by -4.5%% (-3358.99 Gg CO2 / year)
In the third party priority scenario we have the following changes for aggregate Kyoto GHG and national total emissions excluding LULUCF (M.0.EL):
- Emissions in 2023 have changed by -20.4%% (-25392.11 Gg CO2 / year)
- Emissions in 1990-2023 have changed by -19.2%% (-17424.77 Gg CO2 / year)
Most important changes per scenario and time frame
In the country reported priority scenario the following sector-gas combinations have the highest absolute impact on national total KyotoGHG (AR6GWP100) emissions in 2023 (top 5):
- 1: 1.B.2, CH4 with -11812.56 Gg CO2 / year (-27.0%)
- 2: 3.A, CH4 with 249.60 Gg CO2 / year (2.4%)
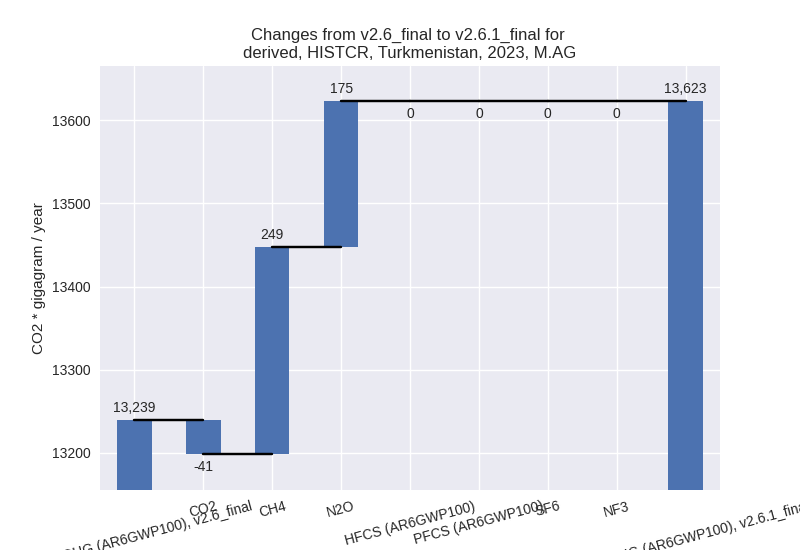
- 3: M.AG.ELV, N2O with 192.56 Gg CO2 / year (12.9%)
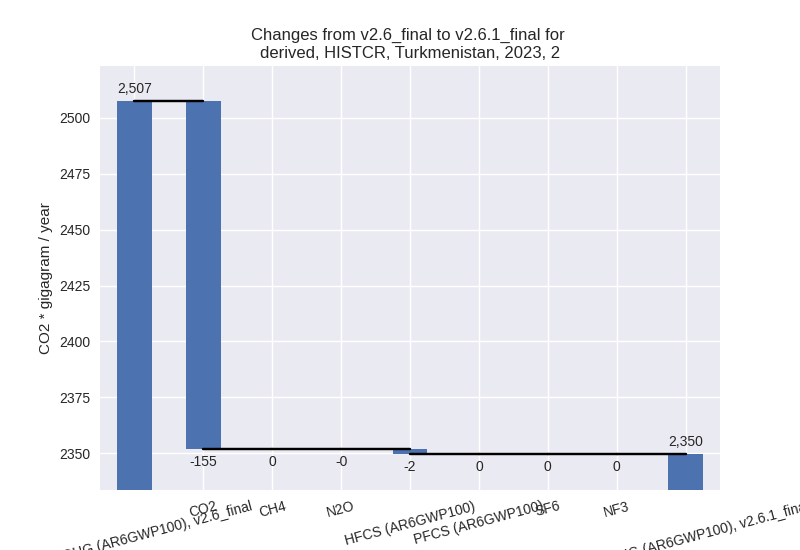
- 4: 2, CO2 with -155.37 Gg CO2 / year (-7.9%)
- 5: 4, CH4 with 44.61 Gg CO2 / year (6.1%)
In the country reported priority scenario the following sector-gas combinations have the highest absolute impact on national total KyotoGHG (AR6GWP100) emissions in 1990-2023 (top 5):
- 1: 1.B.2, CH4 with -3482.05 Gg CO2 / year (-10.1%)
- 2: 3.A, CH4 with 159.66 Gg CO2 / year (2.3%)
- 3: M.AG.ELV, N2O with 29.80 Gg CO2 / year (2.8%)
- 4: 2, CO2 with -29.34 Gg CO2 / year (-2.6%)
- 5: 1.B.1, CO2 with -27.38 Gg CO2 / year (-100.0%)
In the third party priority scenario the following sector-gas combinations have the highest absolute impact on national total KyotoGHG (AR6GWP100) emissions in 2023 (top 5):
- 1: 1.B.2, CH4 with -25413.71 Gg CO2 / year (-65.3%)
- 2: M.AG.ELV, N2O with 609.72 Gg CO2 / year (12.9%)
- 3: 4, CH4 with -412.14 Gg CO2 / year (-21.1%)
- 4: 2, CO2 with -202.37 Gg CO2 / year (-9.7%)
- 5: 3.A, CH4 with 171.91 Gg CO2 / year (2.4%)
In the third party priority scenario the following sector-gas combinations have the highest absolute impact on national total KyotoGHG (AR6GWP100) emissions in 1990-2023 (top 5):
- 1: 1.B.2, CH4 with -17152.54 Gg CO2 / year (-59.3%)
- 2: 4, CH4 with -332.74 Gg CO2 / year (-25.3%)
- 3: 3.A, CH4 with 109.97 Gg CO2 / year (2.1%)
- 4: M.AG.ELV, N2O with 94.76 Gg CO2 / year (3.0%)
- 5: M.AG.ELV, CH4 with -73.74 Gg CO2 / year (-21.8%)
Notes on data changes
Here we list notes explaining important emissions changes for the country.
- No new country reported data has been included
- Changes in the CR time-series are small for most sectors and gases with the exception of CH4 in 1.B.2 which is much lower due to a high change in EDGAR data which is used to extrapolate and interpolate the country reported data points.
- In the TP scenario the change through the new EDGAR data is even higher.
Changes by sector and gas
For each scenario and time frame the changes are displayed for all individual sectors and all individual gases. In the sector plot we use aggregate Kyoto GHGs in AR6GWP100. In the gas plot we usenational total emissions without LULUCF.
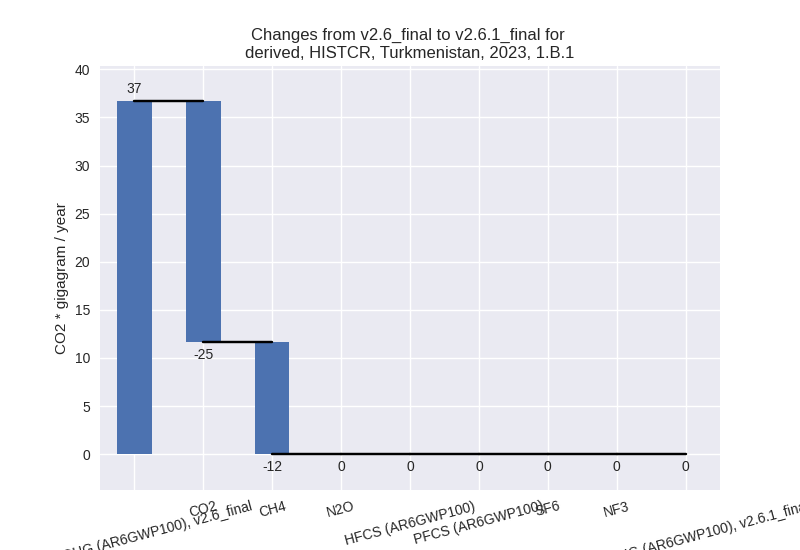
country reported scenario
2023

1990-2023

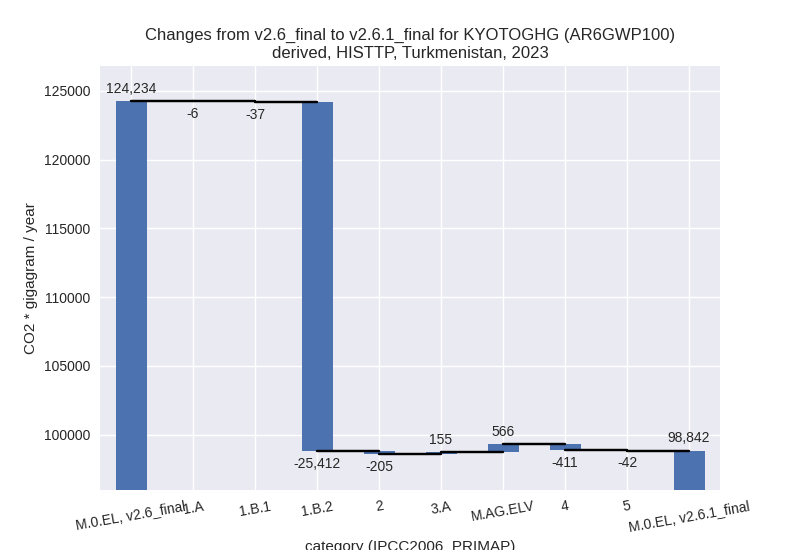
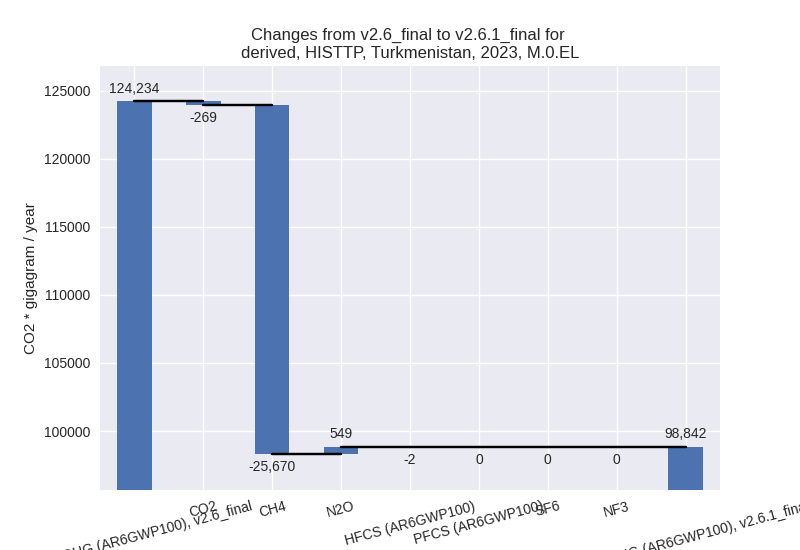
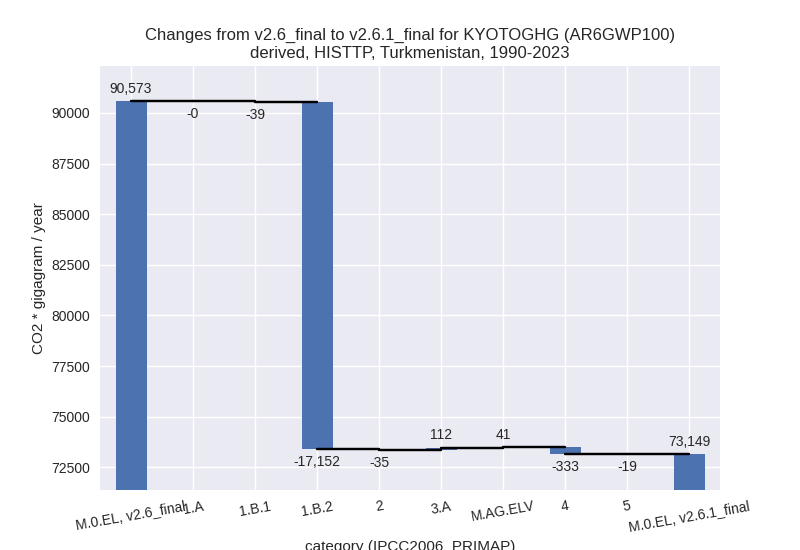
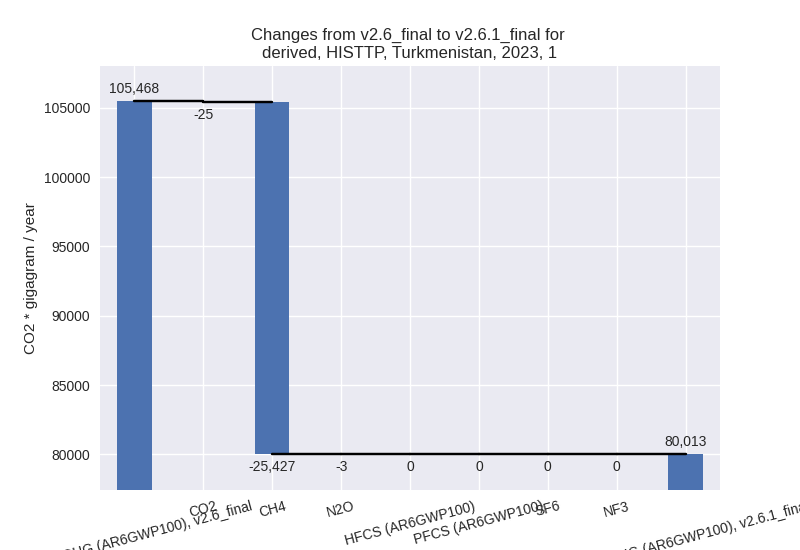
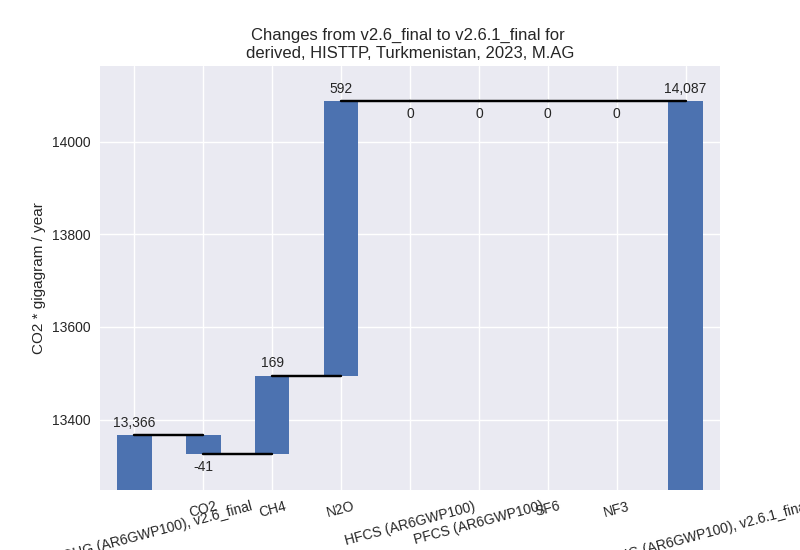
third party scenario
2023
1990-2023

Detailed changes for the scenarios:
country reported scenario (HISTCR):
Most important changes per time frame
For 2023 the following sector-gas combinations have the highest absolute impact on national total KyotoGHG (AR6GWP100) emissions in 2023 (top 5):
- 1: 1.B.2, CH4 with -11812.56 Gg CO2 / year (-27.0%)
- 2: 3.A, CH4 with 249.60 Gg CO2 / year (2.4%)
- 3: M.AG.ELV, N2O with 192.56 Gg CO2 / year (12.9%)
- 4: 2, CO2 with -155.37 Gg CO2 / year (-7.9%)
- 5: 4, CH4 with 44.61 Gg CO2 / year (6.1%)
For 1990-2023 the following sector-gas combinations have the highest absolute impact on national total KyotoGHG (AR6GWP100) emissions in 1990-2023 (top 5):
- 1: 1.B.2, CH4 with -3482.05 Gg CO2 / year (-10.1%)
- 2: 3.A, CH4 with 159.66 Gg CO2 / year (2.3%)
- 3: M.AG.ELV, N2O with 29.80 Gg CO2 / year (2.8%)
- 4: 2, CO2 with -29.34 Gg CO2 / year (-2.6%)
- 5: 1.B.1, CO2 with -27.38 Gg CO2 / year (-100.0%)
Changes in the main sectors for aggregate KyotoGHG (AR6GWP100) are
- 1: Total sectoral emissions in 2022 are 76760.49 Gg
CO2 / year which is 82.0% of M.0.EL emissions. 2023 Emissions have
changed by -13.6% (-11850.52 Gg CO2
/ year). 1990-2023 Emissions have changed by -5.5% (-3521.05 Gg CO2 / year). For 2023
the changes per gas
are:

For 1990-2023 the changes per gas are:
The changes come from the following subsectors:- 1.A: Total sectoral emissions in 2022 are 41649.68 Gg CO2 / year which is 54.3% of category 1 emissions. 2023 Emissions have changed by -0.0% (-2.88 Gg CO2 / year). 1990-2023 Emissions have changed by -0.0% (-0.27 Gg CO2 / year).
- 1.B.1: Total sectoral emissions in 2022 are nan Gg
CO2 / year which is nan% of category 1 emissions. 2023 Emissions have
changed by -100.0% (-36.67 Gg CO2 /
year). 1990-2023 Emissions have changed by -100.0% (-39.08 Gg CO2 / year). For 2023
the changes per gas
are:
For 1990-2023 the changes per gas are: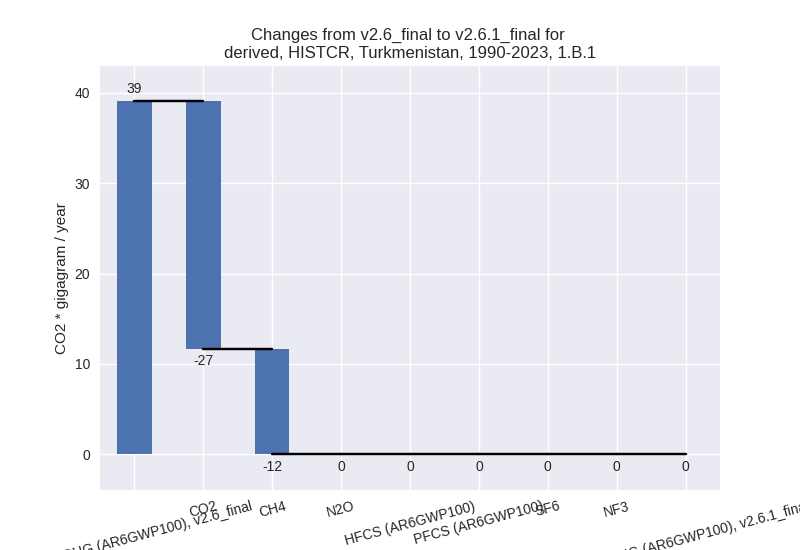
There is no subsector information available in PRIMAP-hist. - 1.B.2: Total sectoral emissions in 2022 are
35110.80 Gg CO2 / year which is 45.7% of category 1 emissions. 2023
Emissions have changed by -25.6%
(-11810.97 Gg CO2 / year). 1990-2023 Emissions have changed by -9.8% (-3481.70 Gg CO2 / year). For 2023
the changes per gas
are:

For 1990-2023 the changes per gas are:
There is no subsector information available in PRIMAP-hist.
- 2: Total sectoral emissions in 2022 are 2310.58 Gg
CO2 / year which is 2.5% of M.0.EL emissions. 2023 Emissions have
changed by -6.3% (-157.58 Gg CO2 /
year). 1990-2023 Emissions have changed by -2.0% (-29.50 Gg CO2 / year). For 2023 the
changes per gas
are:
- M.AG: Total sectoral emissions in 2022 are 13597.41
Gg CO2 / year which is 14.5% of M.0.EL emissions. 2023 Emissions have
changed by 2.9% (383.37 Gg CO2 /
year). 1990-2023 Emissions have changed by 2.3% (200.96 Gg CO2 / year). For 2023 the
changes per gas
are:
For 1990-2023 the changes per gas are: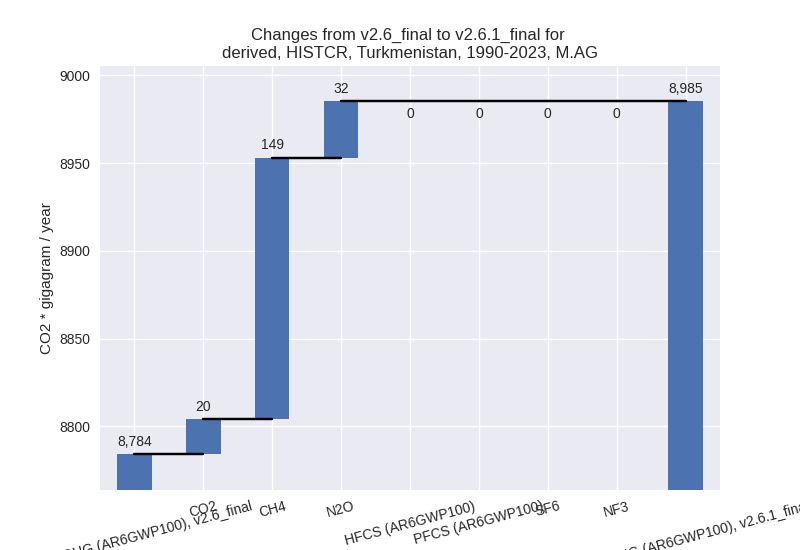
The changes come from the following subsectors:- 3.A: Total sectoral emissions in 2022 are 11019.40
Gg CO2 / year which is 81.0% of category M.AG emissions. 2023 Emissions
have changed by 2.1% (232.34 Gg CO2
/ year). 1990-2023 Emissions have changed by 2.3% (161.88 Gg CO2 / year). For 2023 the
changes per gas
are:
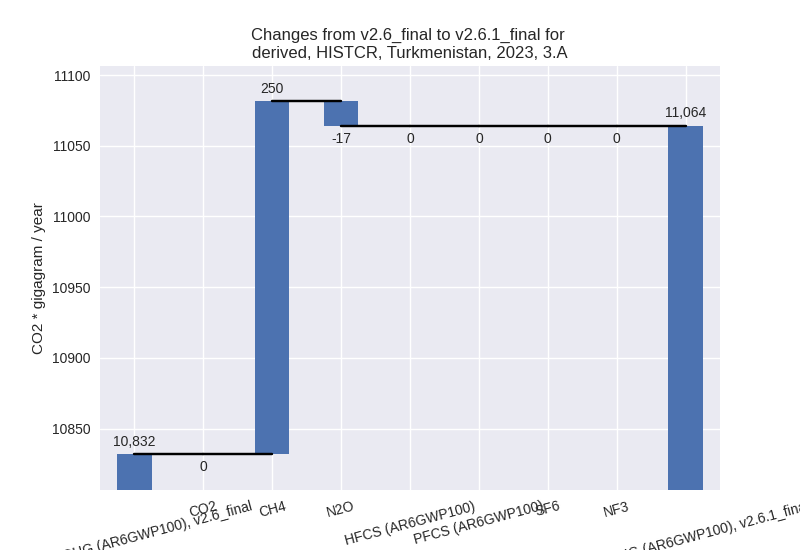
For 1990-2023 the changes per gas are: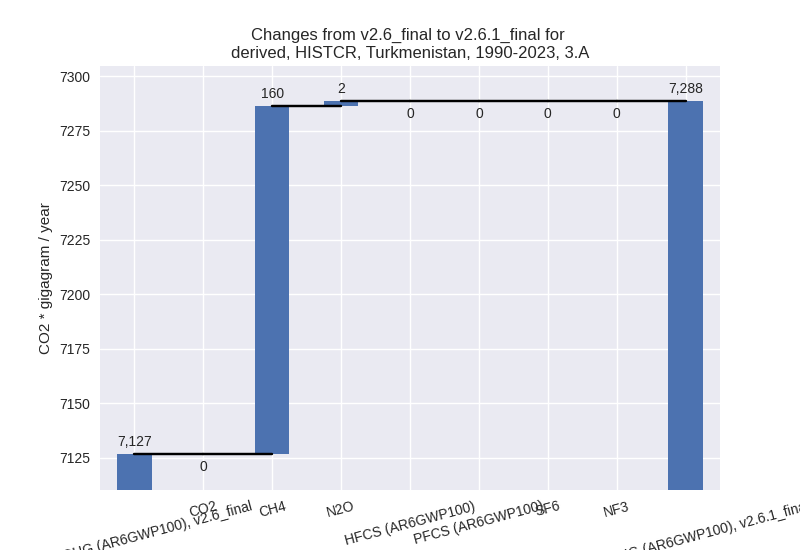
There is no subsector information available in PRIMAP-hist. - M.AG.ELV: Total sectoral emissions in 2022 are
2578.01 Gg CO2 / year which is 19.0% of category M.AG emissions. 2023
Emissions have changed by 6.3%
(151.03 Gg CO2 / year). 1990-2023 Emissions have changed by 2.4% (39.08 Gg CO2 / year). For 2023 the
changes per gas
are:
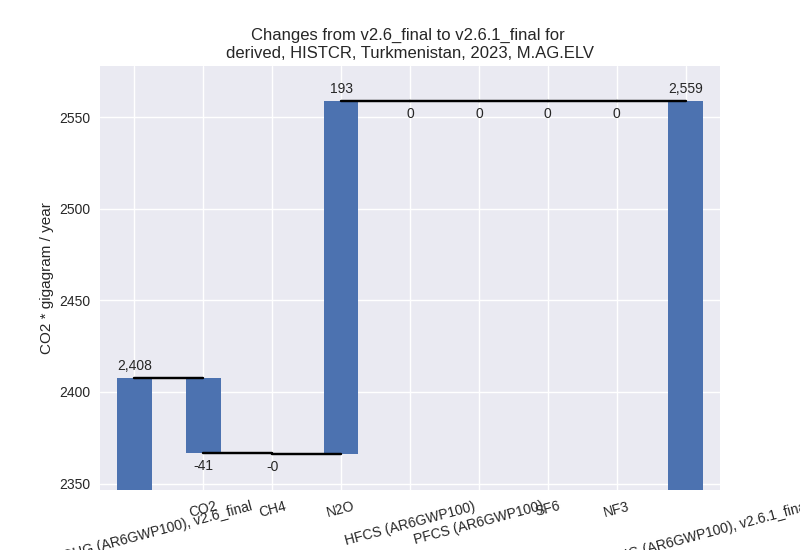
For 1990-2023 the changes per gas are: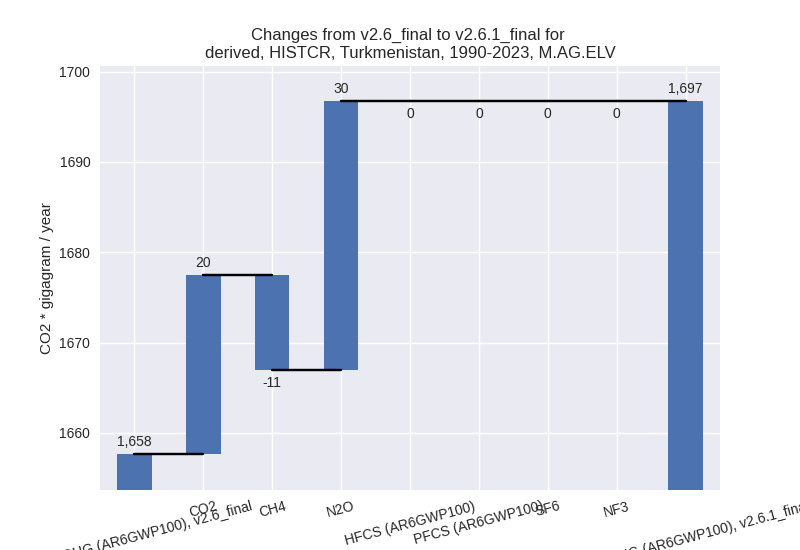
There is no subsector information available in PRIMAP-hist.
- 3.A: Total sectoral emissions in 2022 are 11019.40
Gg CO2 / year which is 81.0% of category M.AG emissions. 2023 Emissions
have changed by 2.1% (232.34 Gg CO2
/ year). 1990-2023 Emissions have changed by 2.3% (161.88 Gg CO2 / year). For 2023 the
changes per gas
are:
- 4: Total sectoral emissions in 2022 are 845.37 Gg
CO2 / year which is 0.9% of M.0.EL emissions. 2023 Emissions have
changed by 5.5% (45.49 Gg CO2 /
year). 1990-2023 Emissions have changed by 1.6% (9.16 Gg CO2 / year). For 2023 the
changes per gas
are:

- 5: Total sectoral emissions in 2022 are 141.84 Gg
CO2 / year which is 0.2% of M.0.EL emissions. 2023 Emissions have
changed by -22.9% (-41.79 Gg CO2 /
year). 1990-2023 Emissions have changed by -12.8% (-18.57 Gg CO2 / year). For 2023
the changes per gas
are:

For 1990-2023 the changes per gas are: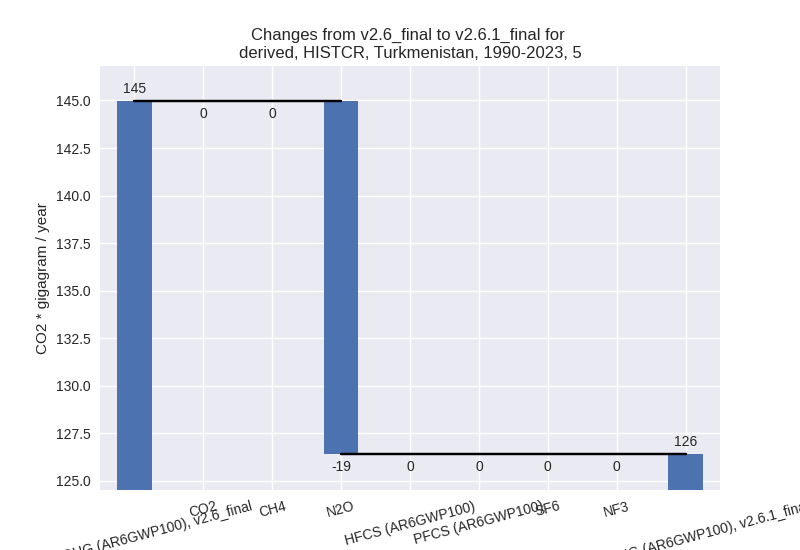
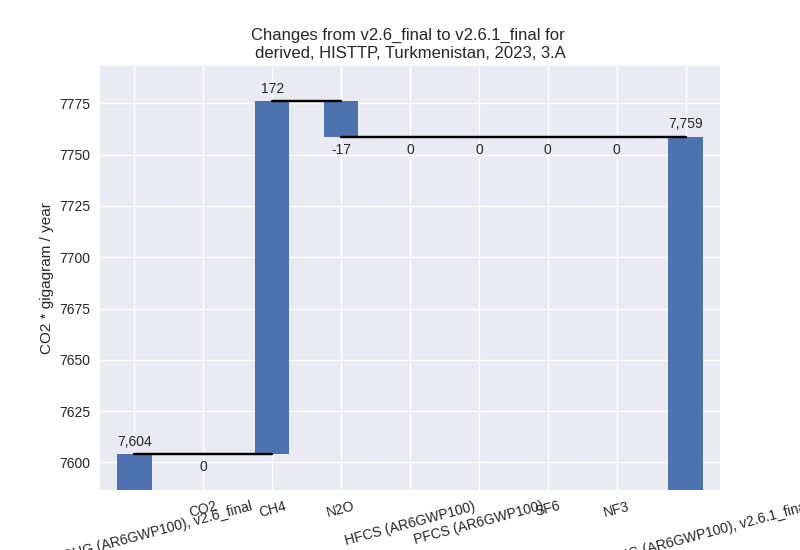
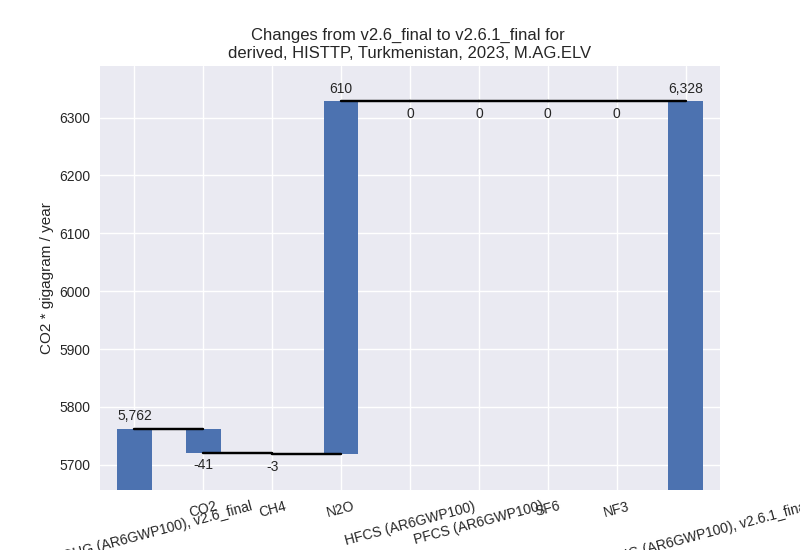
third party scenario (HISTTP):
Most important changes per time frame
For 2023 the following sector-gas combinations have the highest absolute impact on national total KyotoGHG (AR6GWP100) emissions in 2023 (top 5):
- 1: 1.B.2, CH4 with -25413.71 Gg CO2 / year (-65.3%)
- 2: M.AG.ELV, N2O with 609.72 Gg CO2 / year (12.9%)
- 3: 4, CH4 with -412.14 Gg CO2 / year (-21.1%)
- 4: 2, CO2 with -202.37 Gg CO2 / year (-9.7%)
- 5: 3.A, CH4 with 171.91 Gg CO2 / year (2.4%)
For 1990-2023 the following sector-gas combinations have the highest absolute impact on national total KyotoGHG (AR6GWP100) emissions in 1990-2023 (top 5):
- 1: 1.B.2, CH4 with -17152.54 Gg CO2 / year (-59.3%)
- 2: 4, CH4 with -332.74 Gg CO2 / year (-25.3%)
- 3: 3.A, CH4 with 109.97 Gg CO2 / year (2.1%)
- 4: M.AG.ELV, N2O with 94.76 Gg CO2 / year (3.0%)
- 5: M.AG.ELV, CH4 with -73.74 Gg CO2 / year (-21.8%)
Changes in the main sectors for aggregate KyotoGHG (AR6GWP100) are
- 1: Total sectoral emissions in 2022 are 81240.54 Gg
CO2 / year which is 81.2% of M.0.EL emissions. 2023 Emissions have
changed by -24.1% (-25454.85 Gg CO2
/ year). 1990-2023 Emissions have changed by -22.1% (-17191.41 Gg CO2 / year). For 2023
the changes per gas
are:
For 1990-2023 the changes per gas are:
The changes come from the following subsectors:- 1.A: Total sectoral emissions in 2022 are 65119.94 Gg CO2 / year which is 80.2% of category 1 emissions. 2023 Emissions have changed by -0.0% (-6.06 Gg CO2 / year). 1990-2023 Emissions have changed by -0.0% (-0.14 Gg CO2 / year).
- 1.B.1: Total sectoral emissions in 2022 are nan Gg
CO2 / year which is nan% of category 1 emissions. 2023 Emissions have
changed by -100.0% (-36.67 Gg CO2 /
year). 1990-2023 Emissions have changed by -100.0% (-39.08 Gg CO2 / year). For 2023
the changes per gas
are:

For 1990-2023 the changes per gas are:
There is no subsector information available in PRIMAP-hist. - 1.B.2: Total sectoral emissions in 2022 are
16120.60 Gg CO2 / year which is 19.8% of category 1 emissions. 2023
Emissions have changed by -61.5%
(-25412.11 Gg CO2 / year). 1990-2023 Emissions have changed by -56.7% (-17152.19 Gg CO2 / year). For 2023
the changes per gas
are:

For 1990-2023 the changes per gas are: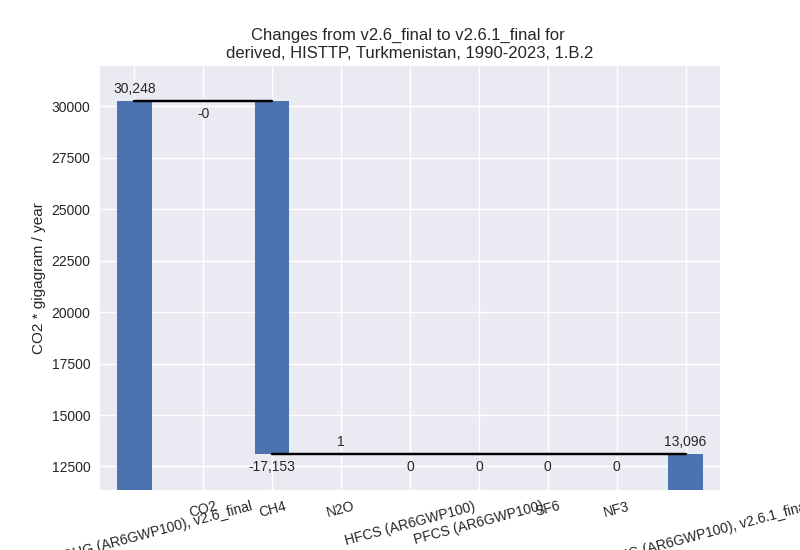
There is no subsector information available in PRIMAP-hist.
- 2: Total sectoral emissions in 2022 are 2920.04 Gg
CO2 / year which is 2.9% of M.0.EL emissions. 2023 Emissions have
changed by -6.5% (-204.58 Gg CO2 /
year). 1990-2023 Emissions have changed by -1.9% (-35.15 Gg CO2 / year). For 2023 the
changes per gas
are:

- M.AG: Total sectoral emissions in 2022 are 14097.50
Gg CO2 / year which is 14.1% of M.0.EL emissions. 2023 Emissions have
changed by 5.4% (720.38 Gg CO2 /
year). 1990-2023 Emissions have changed by 1.6% (152.99 Gg CO2 / year). For 2023 the
changes per gas
are:
The changes come from the following subsectors:- 3.A: Total sectoral emissions in 2022 are 7727.81
Gg CO2 / year which is 54.8% of category M.AG emissions. 2023 Emissions
have changed by 2.0% (154.65 Gg CO2
/ year). 1990-2023 Emissions have changed by 2.0% (112.19 Gg CO2 / year). For 2023 the
changes per gas
are:
For 1990-2023 the changes per gas are:
There is no subsector information available in PRIMAP-hist. - M.AG.ELV: Total sectoral emissions in 2022 are
6369.69 Gg CO2 / year which is 45.2% of category M.AG emissions. 2023
Emissions have changed by 9.8%
(565.73 Gg CO2 / year). 1990-2023 Emissions have changed by 1.0% (40.80 Gg CO2 / year). For 2023 the
changes per gas
are:
There is no subsector information available in PRIMAP-hist.
- 3.A: Total sectoral emissions in 2022 are 7727.81
Gg CO2 / year which is 54.8% of category M.AG emissions. 2023 Emissions
have changed by 2.0% (154.65 Gg CO2
/ year). 1990-2023 Emissions have changed by 2.0% (112.19 Gg CO2 / year). For 2023 the
changes per gas
are:
- 4: Total sectoral emissions in 2022 are 1591.56 Gg
CO2 / year which is 1.6% of M.0.EL emissions. 2023 Emissions have
changed by -20.1% (-411.26 Gg CO2 /
year). 1990-2023 Emissions have changed by -24.0% (-332.63 Gg CO2 / year). For 2023
the changes per gas
are:

For 1990-2023 the changes per gas are:
- 5: Total sectoral emissions in 2022 are 141.84 Gg
CO2 / year which is 0.1% of M.0.EL emissions. 2023 Emissions have
changed by -22.9% (-41.79 Gg CO2 /
year). 1990-2023 Emissions have changed by -12.8% (-18.57 Gg CO2 / year). For 2023
the changes per gas
are:

For 1990-2023 the changes per gas are: