Changes in PRIMAP-hist v2.6.1_final compared to v2.6_final for Timor-Leste
2025-03-19
Johannes Gütschow
Change analysis for Timor-Leste for PRIMAP-hist v2.6.1_final compared to v2.6_final
Overview over emissions by sector and gas
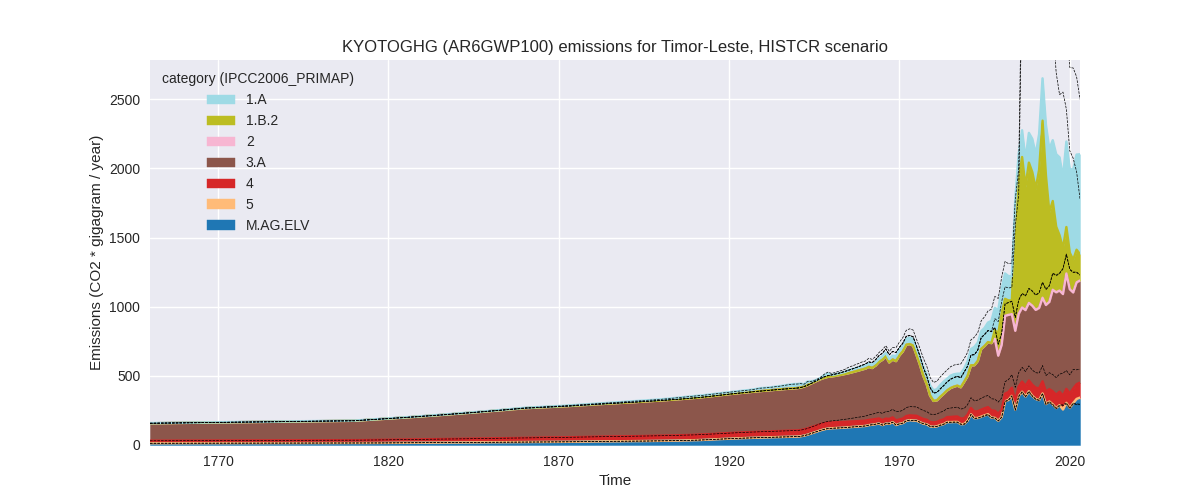
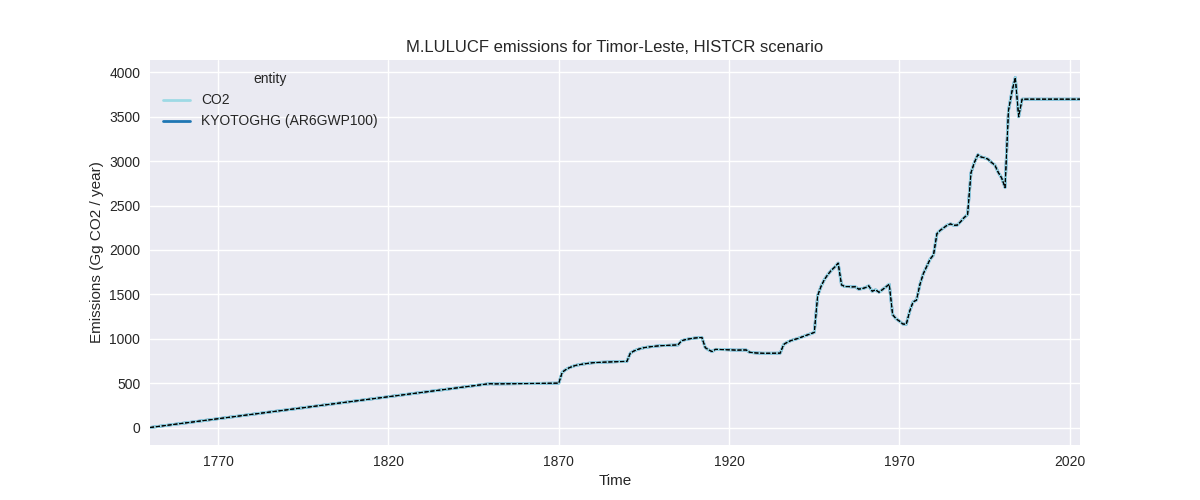
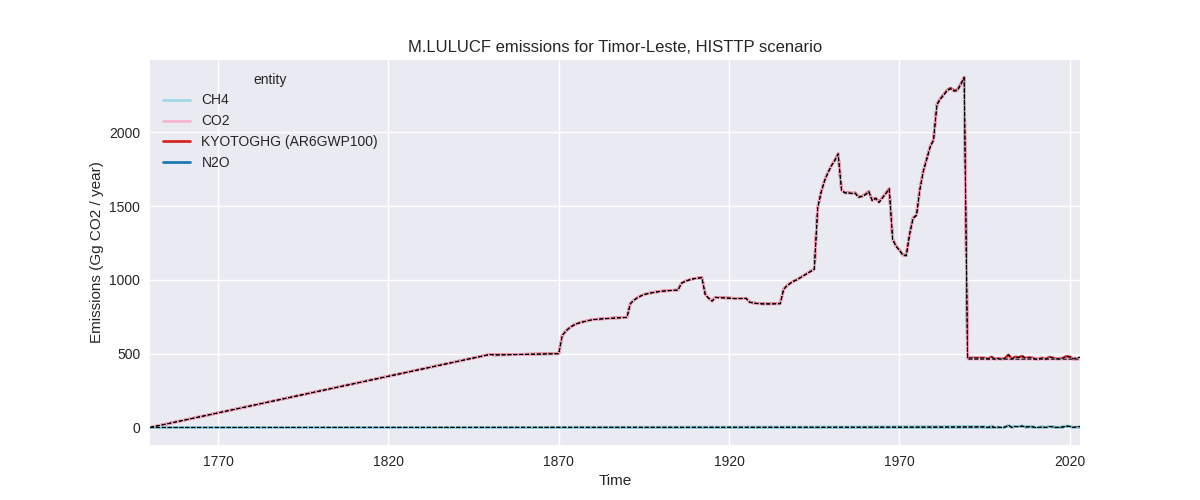
The following figures show the aggregate national total emissions excluding LULUCF AR6GWP100 for the country reported priority scenario. The dotted linesshow the v2.6_final data.

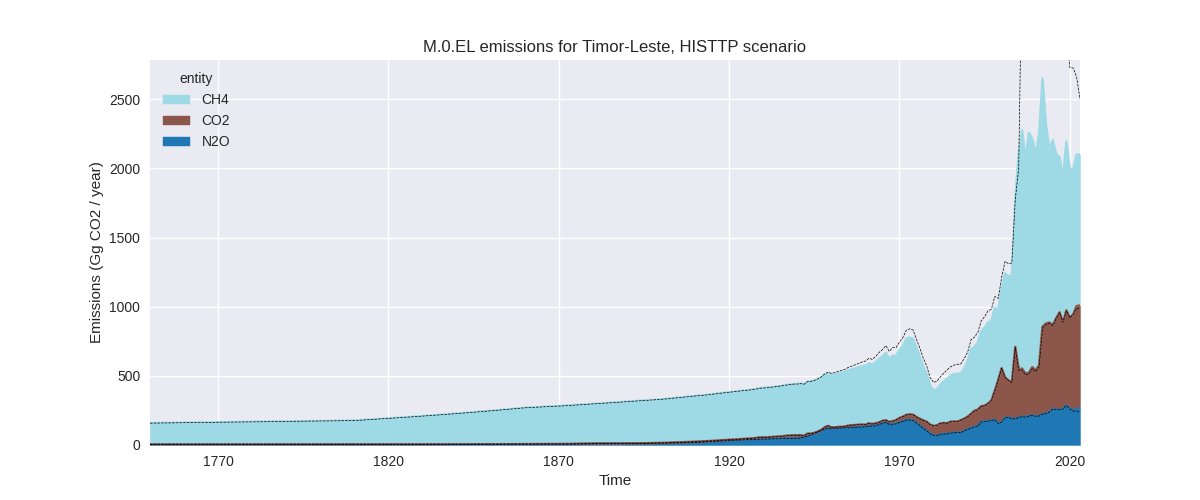
The following figures show the aggregate national total emissions excluding LULUCF AR6GWP100 for the third party priority scenario. The dotted linesshow the v2.6_final data.

Overview over changes
In the country reported priority scenario we have the following changes for aggregate Kyoto GHG and national total emissions excluding LULUCF (M.0.EL):
- Emissions in 2023 have changed by -15.9%% (-397.42 Gg CO2 / year)
- Emissions in 1990-2023 have changed by -30.4%% (-715.79 Gg CO2 / year)
In the third party priority scenario we have the following changes for aggregate Kyoto GHG and national total emissions excluding LULUCF (M.0.EL):
- Emissions in 2023 have changed by -15.9%% (-397.42 Gg CO2 / year)
- Emissions in 1990-2023 have changed by -30.4%% (-715.79 Gg CO2 / year)
Most important changes per scenario and time frame
In the country reported priority scenario the following sector-gas combinations have the highest absolute impact on national total KyotoGHG (AR6GWP100) emissions in 2023 (top 5):
- 1: 1.B.2, CH4 with -359.38 Gg CO2 / year (-69.7%)
- 2: 4, CH4 with -144.22 Gg CO2 / year (-60.2%)
- 3: 3.A, CH4 with 48.00 Gg CO2 / year (7.8%)
- 4: M.AG.ELV, CH4 with 32.36 Gg CO2 / year (23.1%)
- 5: M.AG.ELV, N2O with 12.09 Gg CO2 / year (8.0%)
In the country reported priority scenario the following sector-gas combinations have the highest absolute impact on national total KyotoGHG (AR6GWP100) emissions in 1990-2023 (top 5):
- 1: 1.B.2, CH4 with -618.76 Gg CO2 / year (-66.6%)
- 2: 4, CH4 with -104.40 Gg CO2 / year (-62.2%)
- 3: 1.B.2, CO2 with 3.32 Gg CO2 / year (3.1%)
- 4: 1.A, CH4 with 1.03 Gg CO2 / year (10.0%)
- 5: 3.A, CH4 with 0.93 Gg CO2 / year (0.2%)
In the third party priority scenario the following sector-gas combinations have the highest absolute impact on national total KyotoGHG (AR6GWP100) emissions in 2023 (top 5):
- 1: 1.B.2, CH4 with -359.38 Gg CO2 / year (-69.7%)
- 2: 4, CH4 with -144.22 Gg CO2 / year (-60.2%)
- 3: 3.A, CH4 with 48.00 Gg CO2 / year (7.8%)
- 4: M.AG.ELV, CH4 with 32.36 Gg CO2 / year (23.1%)
- 5: M.AG.ELV, N2O with 12.09 Gg CO2 / year (8.0%)
In the third party priority scenario the following sector-gas combinations have the highest absolute impact on national total KyotoGHG (AR6GWP100) emissions in 1990-2023 (top 5):
- 1: 1.B.2, CH4 with -618.76 Gg CO2 / year (-66.6%)
- 2: 4, CH4 with -104.40 Gg CO2 / year (-62.2%)
- 3: 1.B.2, CO2 with 3.32 Gg CO2 / year (3.1%)
- 4: 1.A, CH4 with 1.03 Gg CO2 / year (10.0%)
- 5: 3.A, CH4 with 0.93 Gg CO2 / year (0.2%)
Notes on data changes
Here we list notes explaining important emissions changes for the country.
- There is no usable country reported data for Timor-Leste, thus the CR and TP time-series are identical.
- The main changes, CH4 in sectors 1.B.2 and 4 come directly from EDGAR data where emissions have been reduced by over 60%
- For 2023 the new FAO data introduces some changes.
Changes by sector and gas
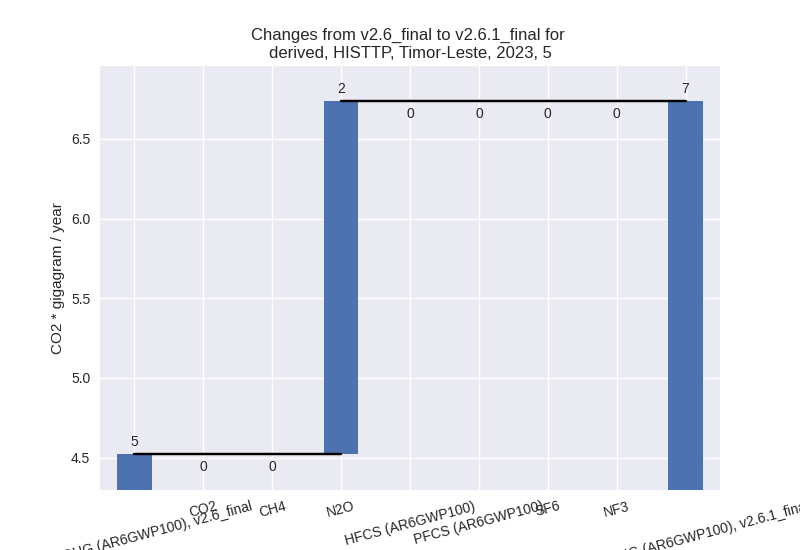
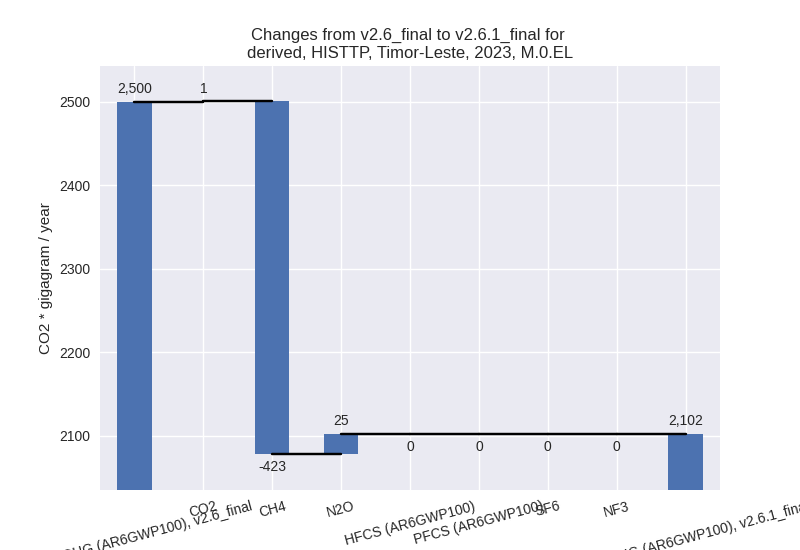
For each scenario and time frame the changes are displayed for all individual sectors and all individual gases. In the sector plot we use aggregate Kyoto GHGs in AR6GWP100. In the gas plot we usenational total emissions without LULUCF.
country reported scenario
2023

1990-2023


third party scenario
2023

1990-2023

Detailed changes for the scenarios:
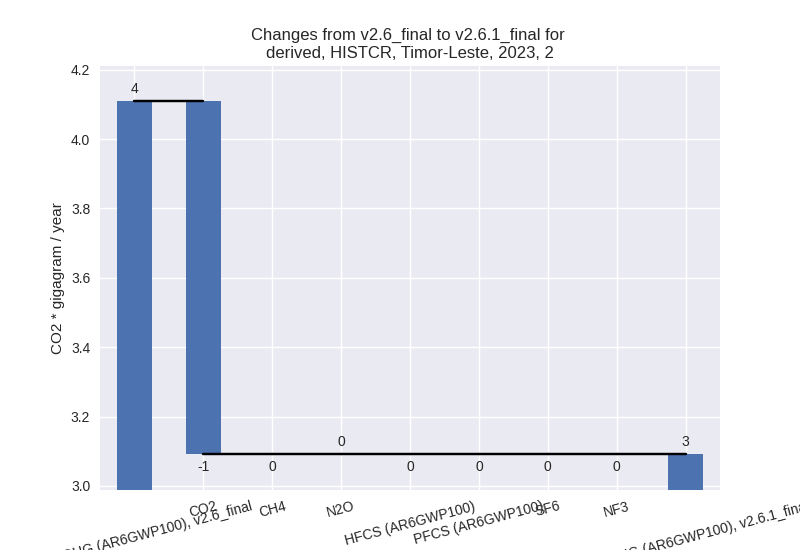
country reported scenario (HISTCR):
Most important changes per time frame
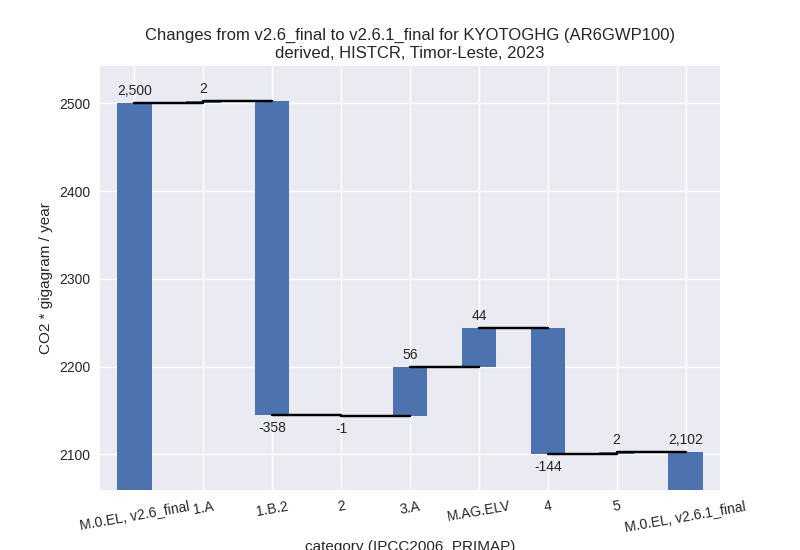
For 2023 the following sector-gas combinations have the highest absolute impact on national total KyotoGHG (AR6GWP100) emissions in 2023 (top 5):
- 1: 1.B.2, CH4 with -359.38 Gg CO2 / year (-69.7%)
- 2: 4, CH4 with -144.22 Gg CO2 / year (-60.2%)
- 3: 3.A, CH4 with 48.00 Gg CO2 / year (7.8%)
- 4: M.AG.ELV, CH4 with 32.36 Gg CO2 / year (23.1%)
- 5: M.AG.ELV, N2O with 12.09 Gg CO2 / year (8.0%)
For 1990-2023 the following sector-gas combinations have the highest absolute impact on national total KyotoGHG (AR6GWP100) emissions in 1990-2023 (top 5):
- 1: 1.B.2, CH4 with -618.76 Gg CO2 / year (-66.6%)
- 2: 4, CH4 with -104.40 Gg CO2 / year (-62.2%)
- 3: 1.B.2, CO2 with 3.32 Gg CO2 / year (3.1%)
- 4: 1.A, CH4 with 1.03 Gg CO2 / year (10.0%)
- 5: 3.A, CH4 with 0.93 Gg CO2 / year (0.2%)
Changes in the main sectors for aggregate KyotoGHG (AR6GWP100) are
- 1: Total sectoral emissions in 2022 are 924.13 Gg
CO2 / year which is 44.0% of M.0.EL emissions. 2023 Emissions have
changed by -28.0% (-355.20 Gg CO2 /
year). 1990-2023 Emissions have changed by -45.9% (-614.02 Gg CO2 / year). For 2023
the changes per gas
are:

For 1990-2023 the changes per gas are:
The changes come from the following subsectors:- 1.A: Total sectoral emissions in 2022 are 688.20 Gg CO2 / year which is 74.5% of category 1 emissions. 2023 Emissions have changed by 0.3% (2.43 Gg CO2 / year). 1990-2023 Emissions have changed by 0.4% (1.33 Gg CO2 / year).
- 1.B.2: Total sectoral emissions in 2022 are 235.92
Gg CO2 / year which is 25.5% of category 1 emissions. 2023 Emissions
have changed by -65.3% (-357.63 Gg
CO2 / year). 1990-2023 Emissions have changed by -59.4% (-615.35 Gg CO2 / year). For 2023
the changes per gas
are:

For 1990-2023 the changes per gas are:
There is no subsector information available in PRIMAP-hist.
- 2: Total sectoral emissions in 2022 are 3.23 Gg CO2
/ year which is 0.2% of M.0.EL emissions. 2023 Emissions have changed by
-24.8% (-1.02 Gg CO2 / year).
1990-2023 Emissions have changed by -3.5% (-0.11 Gg CO2 / year). For 2023 the
changes per gas
are:
For 1990-2023 the changes per gas are: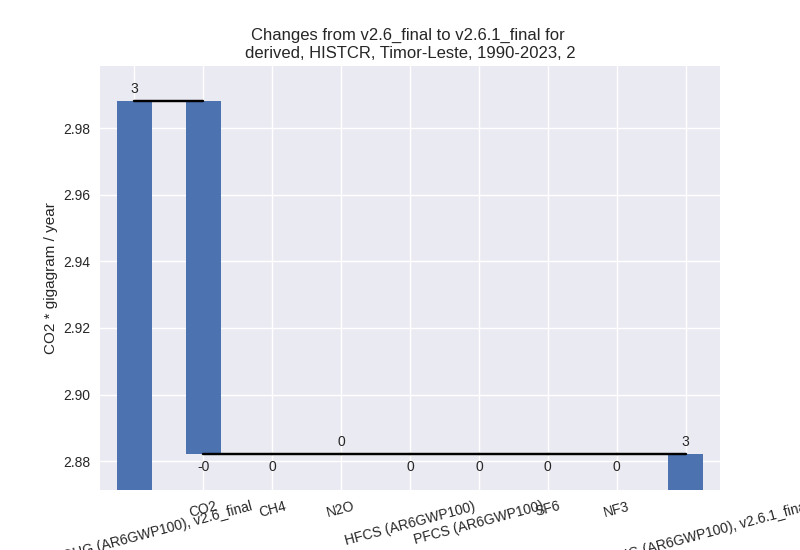
- M.AG: Total sectoral emissions in 2022 are 1060.30
Gg CO2 / year which is 50.5% of M.0.EL emissions. 2023 Emissions have
changed by 10.3% (100.22 Gg CO2 /
year). 1990-2023 Emissions have changed by 0.3% (2.62 Gg CO2 / year). For 2023 the
changes per gas
are:

The changes come from the following subsectors:- 3.A: Total sectoral emissions in 2022 are 733.23 Gg
CO2 / year which is 69.2% of category M.AG emissions. 2023 Emissions
have changed by 8.2% (55.77 Gg CO2 /
year). 1990-2023 Emissions have changed by 0.2% (1.29 Gg CO2 / year). For 2023 the
changes per gas
are:

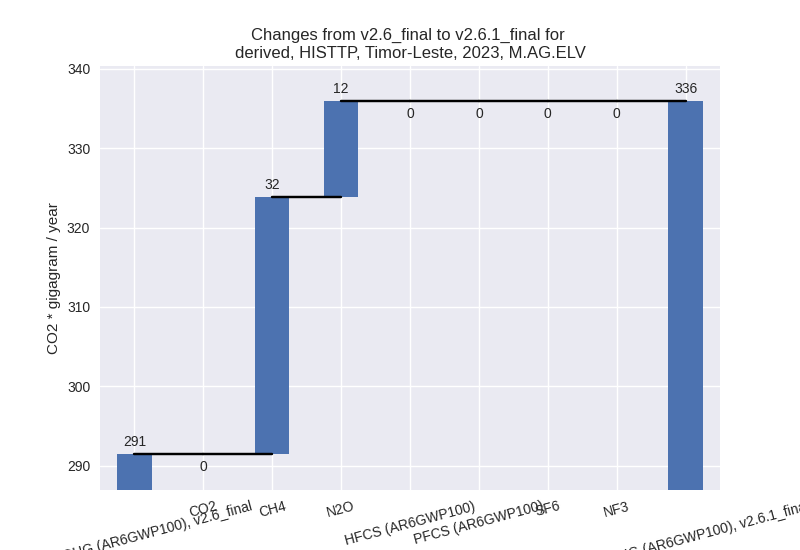
There is no subsector information available in PRIMAP-hist. - M.AG.ELV: Total sectoral emissions in 2022 are
327.07 Gg CO2 / year which is 30.8% of category M.AG emissions. 2023
Emissions have changed by 15.3%
(44.45 Gg CO2 / year). 1990-2023 Emissions have changed by 0.5% (1.33 Gg CO2 / year). For 2023 the
changes per gas
are:

There is no subsector information available in PRIMAP-hist.
- 3.A: Total sectoral emissions in 2022 are 733.23 Gg
CO2 / year which is 69.2% of category M.AG emissions. 2023 Emissions
have changed by 8.2% (55.77 Gg CO2 /
year). 1990-2023 Emissions have changed by 0.2% (1.29 Gg CO2 / year). For 2023 the
changes per gas
are:
- 4: Total sectoral emissions in 2022 are 106.41 Gg
CO2 / year which is 5.1% of M.0.EL emissions. 2023 Emissions have
changed by -57.0% (-143.64 Gg CO2 /
year). 1990-2023 Emissions have changed by -58.8% (-104.34 Gg CO2 / year). For 2023
the changes per gas
are:

For 1990-2023 the changes per gas are:
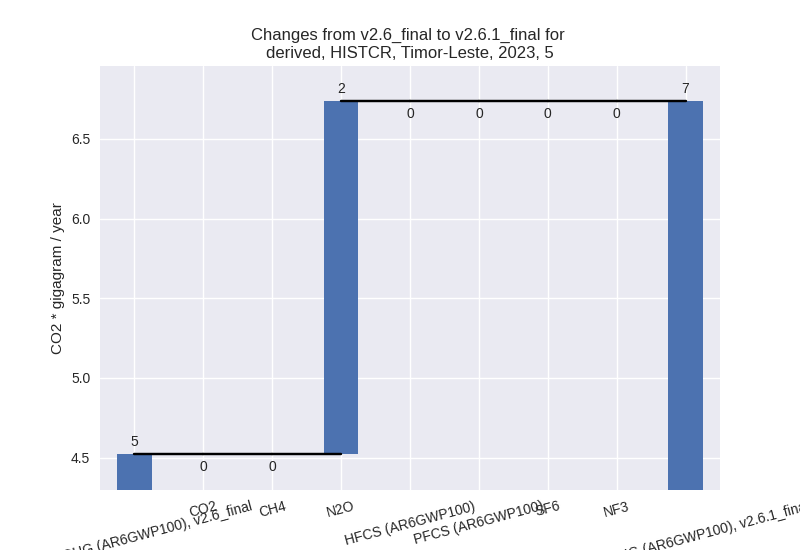
- 5: Total sectoral emissions in 2022 are 6.05 Gg CO2
/ year which is 0.3% of M.0.EL emissions. 2023 Emissions have changed by
49.0% (2.21 Gg CO2 / year).
1990-2023 Emissions have changed by 1.2% (0.05 Gg CO2 / year). For 2023 the
changes per gas
are:
third party scenario (HISTTP):
Most important changes per time frame
For 2023 the following sector-gas combinations have the highest absolute impact on national total KyotoGHG (AR6GWP100) emissions in 2023 (top 5):
- 1: 1.B.2, CH4 with -359.38 Gg CO2 / year (-69.7%)
- 2: 4, CH4 with -144.22 Gg CO2 / year (-60.2%)
- 3: 3.A, CH4 with 48.00 Gg CO2 / year (7.8%)
- 4: M.AG.ELV, CH4 with 32.36 Gg CO2 / year (23.1%)
- 5: M.AG.ELV, N2O with 12.09 Gg CO2 / year (8.0%)
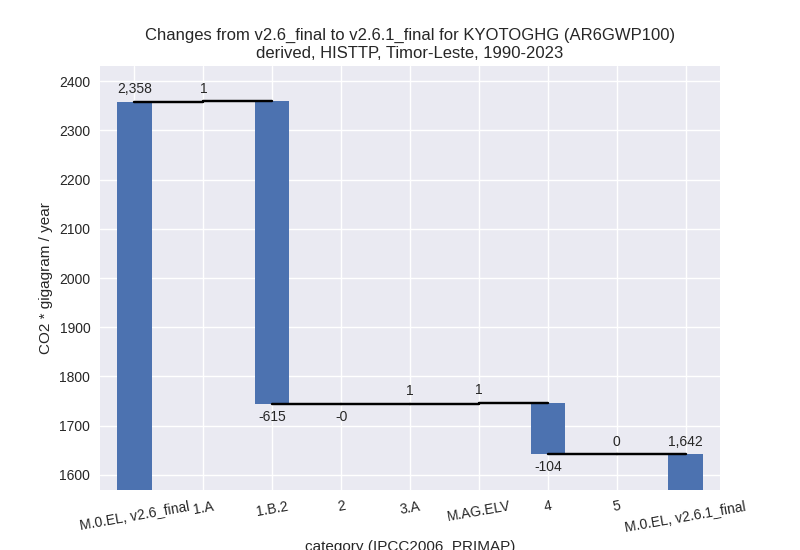
For 1990-2023 the following sector-gas combinations have the highest absolute impact on national total KyotoGHG (AR6GWP100) emissions in 1990-2023 (top 5):
- 1: 1.B.2, CH4 with -618.76 Gg CO2 / year (-66.6%)
- 2: 4, CH4 with -104.40 Gg CO2 / year (-62.2%)
- 3: 1.B.2, CO2 with 3.32 Gg CO2 / year (3.1%)
- 4: 1.A, CH4 with 1.03 Gg CO2 / year (10.0%)
- 5: 3.A, CH4 with 0.93 Gg CO2 / year (0.2%)
Changes in the main sectors for aggregate KyotoGHG (AR6GWP100) are
- 1: Total sectoral emissions in 2022 are 924.13 Gg
CO2 / year which is 44.0% of M.0.EL emissions. 2023 Emissions have
changed by -28.0% (-355.20 Gg CO2 /
year). 1990-2023 Emissions have changed by -45.9% (-614.02 Gg CO2 / year). For 2023
the changes per gas
are:

For 1990-2023 the changes per gas are:
The changes come from the following subsectors:- 1.A: Total sectoral emissions in 2022 are 688.20 Gg CO2 / year which is 74.5% of category 1 emissions. 2023 Emissions have changed by 0.3% (2.43 Gg CO2 / year). 1990-2023 Emissions have changed by 0.4% (1.33 Gg CO2 / year).
- 1.B.2: Total sectoral emissions in 2022 are 235.92
Gg CO2 / year which is 25.5% of category 1 emissions. 2023 Emissions
have changed by -65.3% (-357.63 Gg
CO2 / year). 1990-2023 Emissions have changed by -59.4% (-615.35 Gg CO2 / year). For 2023
the changes per gas
are:

For 1990-2023 the changes per gas are:
There is no subsector information available in PRIMAP-hist.
- 2: Total sectoral emissions in 2022 are 3.23 Gg CO2
/ year which is 0.2% of M.0.EL emissions. 2023 Emissions have changed by
-24.8% (-1.02 Gg CO2 / year).
1990-2023 Emissions have changed by -3.5% (-0.11 Gg CO2 / year). For 2023 the
changes per gas
are:

For 1990-2023 the changes per gas are:
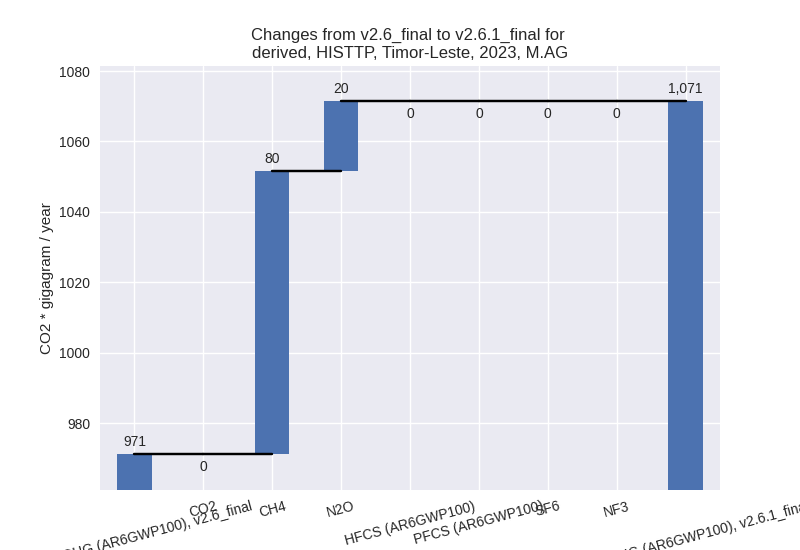
- M.AG: Total sectoral emissions in 2022 are 1060.30
Gg CO2 / year which is 50.5% of M.0.EL emissions. 2023 Emissions have
changed by 10.3% (100.22 Gg CO2 /
year). 1990-2023 Emissions have changed by 0.3% (2.62 Gg CO2 / year). For 2023 the
changes per gas
are:
The changes come from the following subsectors:- 3.A: Total sectoral emissions in 2022 are 733.23 Gg
CO2 / year which is 69.2% of category M.AG emissions. 2023 Emissions
have changed by 8.2% (55.77 Gg CO2 /
year). 1990-2023 Emissions have changed by 0.2% (1.29 Gg CO2 / year). For 2023 the
changes per gas
are:

There is no subsector information available in PRIMAP-hist. - M.AG.ELV: Total sectoral emissions in 2022 are
327.07 Gg CO2 / year which is 30.8% of category M.AG emissions. 2023
Emissions have changed by 15.3%
(44.45 Gg CO2 / year). 1990-2023 Emissions have changed by 0.5% (1.33 Gg CO2 / year). For 2023 the
changes per gas
are:
There is no subsector information available in PRIMAP-hist.
- 3.A: Total sectoral emissions in 2022 are 733.23 Gg
CO2 / year which is 69.2% of category M.AG emissions. 2023 Emissions
have changed by 8.2% (55.77 Gg CO2 /
year). 1990-2023 Emissions have changed by 0.2% (1.29 Gg CO2 / year). For 2023 the
changes per gas
are:
- 4: Total sectoral emissions in 2022 are 106.41 Gg
CO2 / year which is 5.1% of M.0.EL emissions. 2023 Emissions have
changed by -57.0% (-143.64 Gg CO2 /
year). 1990-2023 Emissions have changed by -58.8% (-104.34 Gg CO2 / year). For 2023
the changes per gas
are:

For 1990-2023 the changes per gas are: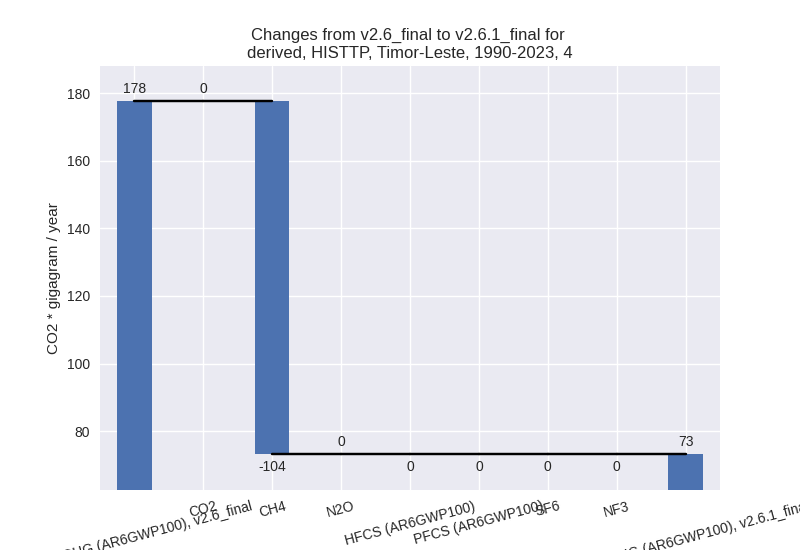
- 5: Total sectoral emissions in 2022 are 6.05 Gg CO2
/ year which is 0.3% of M.0.EL emissions. 2023 Emissions have changed by
49.0% (2.21 Gg CO2 / year).
1990-2023 Emissions have changed by 1.2% (0.05 Gg CO2 / year). For 2023 the
changes per gas
are: