Changes in PRIMAP-hist v2.6.1_final compared to v2.6_final for Trinidad and Tobago
2025-03-19
Johannes Gütschow
Change analysis for Trinidad and Tobago for PRIMAP-hist v2.6.1_final compared to v2.6_final
Overview over emissions by sector and gas
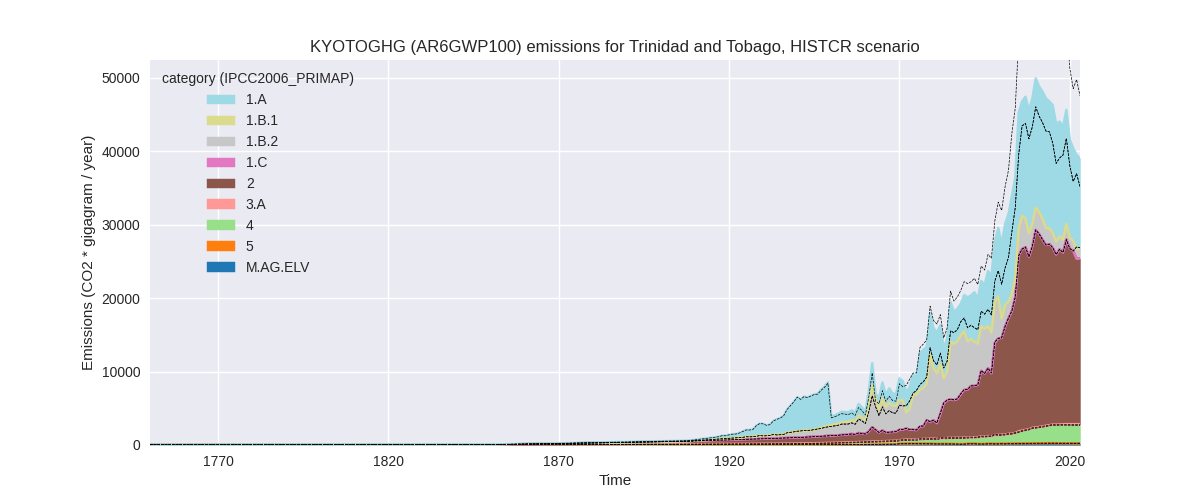
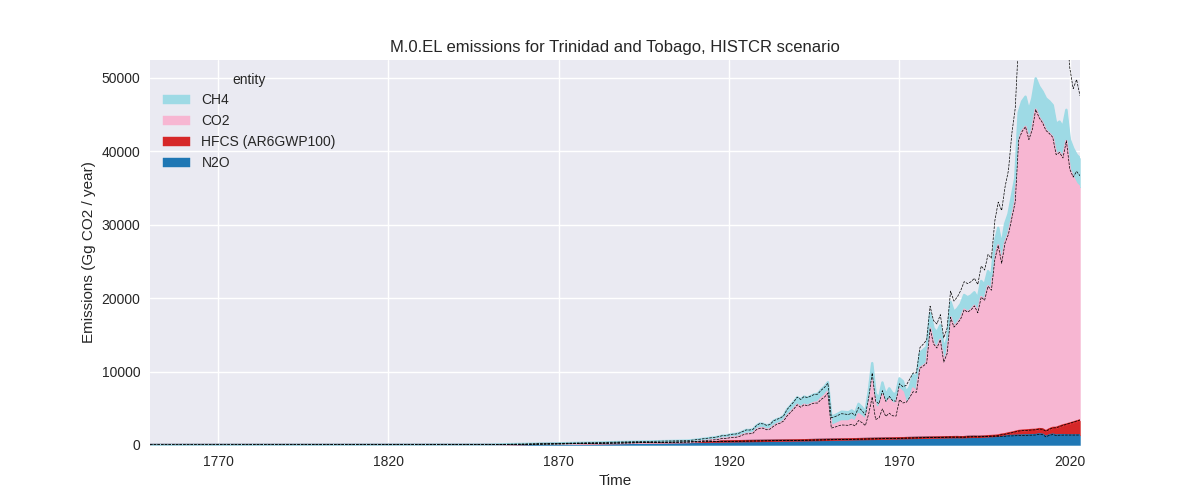
The following figures show the aggregate national total emissions excluding LULUCF AR6GWP100 for the country reported priority scenario. The dotted linesshow the v2.6_final data.
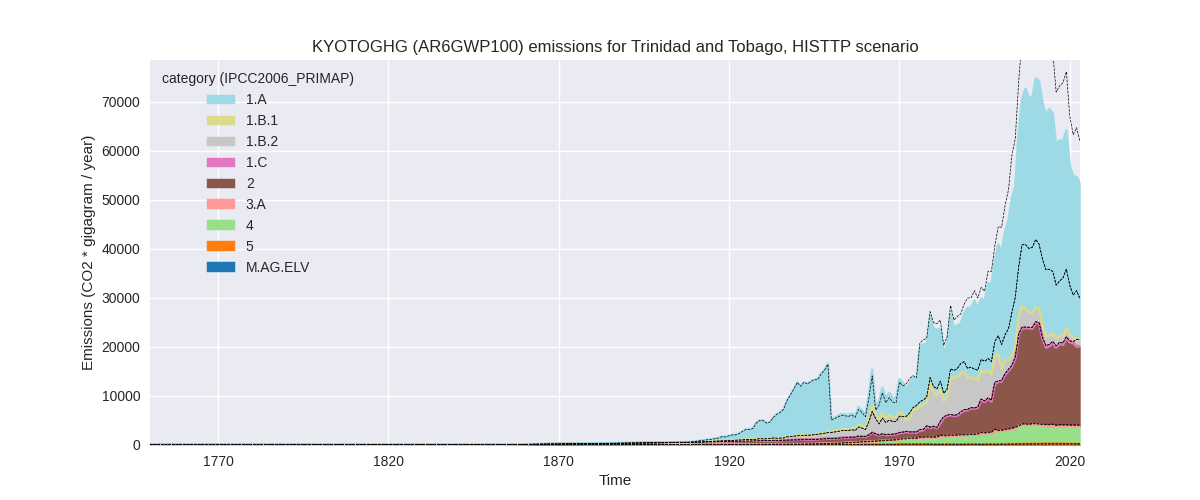
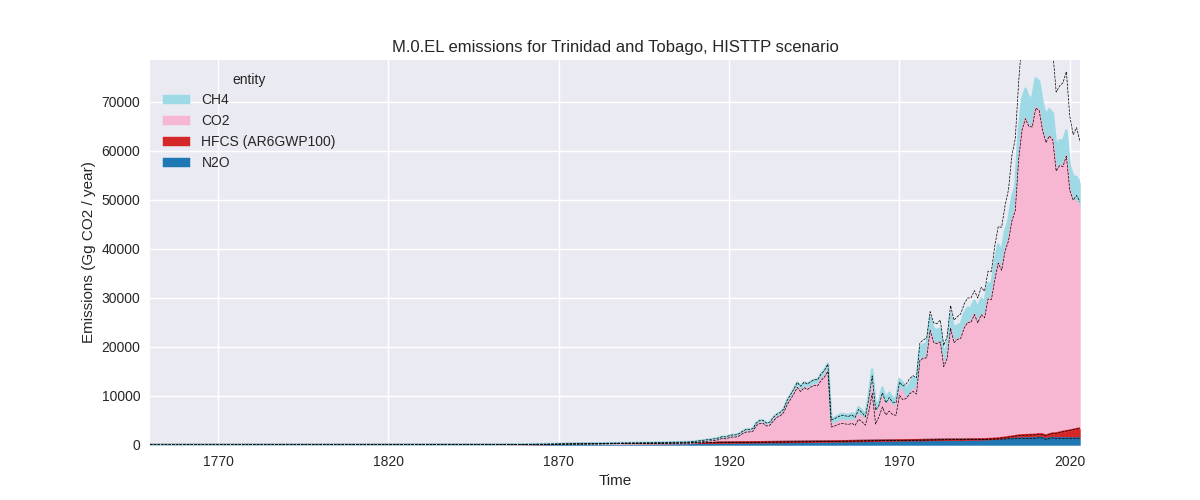
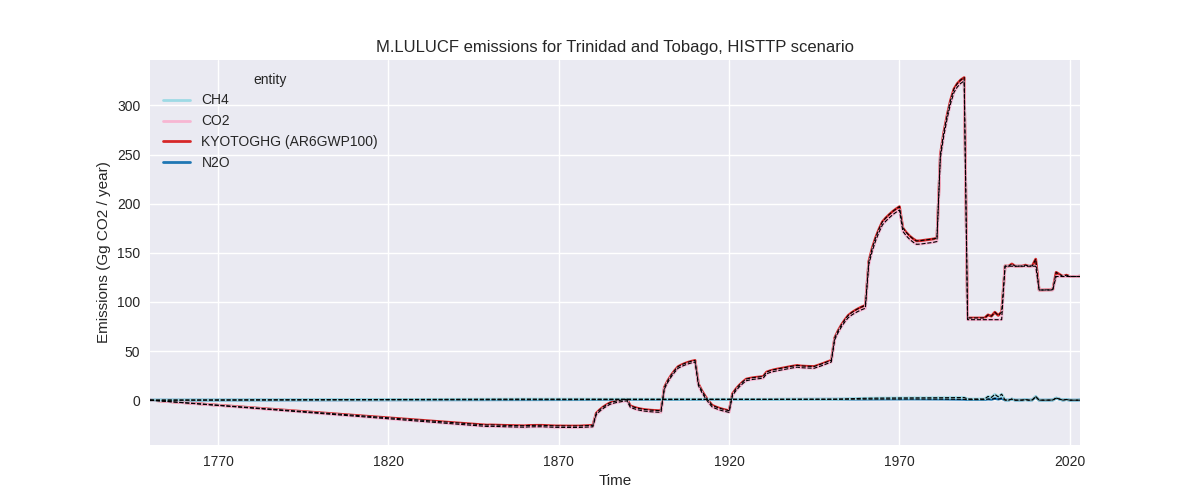
The following figures show the aggregate national total emissions excluding LULUCF AR6GWP100 for the third party priority scenario. The dotted linesshow the v2.6_final data.
Overview over changes
In the country reported priority scenario we have the following changes for aggregate Kyoto GHG and national total emissions excluding LULUCF (M.0.EL):
- Emissions in 2023 have changed by -17.9%% (-8522.35 Gg CO2 / year)
- Emissions in 1990-2023 have changed by -18.2%% (-8162.13 Gg CO2 / year)
In the third party priority scenario we have the following changes for aggregate Kyoto GHG and national total emissions excluding LULUCF (M.0.EL):
- Emissions in 2023 have changed by -13.6%% (-8392.07 Gg CO2 / year)
- Emissions in 1990-2023 have changed by -13.8%% (-8391.54 Gg CO2 / year)
Most important changes per scenario and time frame
In the country reported priority scenario the following sector-gas combinations have the highest absolute impact on national total KyotoGHG (AR6GWP100) emissions in 2023 (top 5):
- 1: 1.B.2, CH4 with -7064.49 Gg CO2 / year (-87.7%)
- 2: 2, CO2 with -1518.48 Gg CO2 / year (-7.3%)
- 3: 4, CH4 with 112.32 Gg CO2 / year (4.7%)
- 4: M.AG.ELV, N2O with -36.41 Gg CO2 / year (-20.3%)
- 5: 2, HFCS (AR6GWP100) with -14.92 Gg CO2 / year (-0.7%)
In the country reported priority scenario the following sector-gas combinations have the highest absolute impact on national total KyotoGHG (AR6GWP100) emissions in 1990-2023 (top 5):
- 1: 1.B.2, CH4 with -8058.01 Gg CO2 / year (-86.6%)
- 2: 2, CO2 with -89.27 Gg CO2 / year (-0.5%)
- 3: 5, N2O with -8.61 Gg CO2 / year (-13.7%)
- 4: M.AG.ELV, N2O with -4.65 Gg CO2 / year (-3.4%)
- 5: 4, CH4 with -1.20 Gg CO2 / year (-0.1%)
In the third party priority scenario the following sector-gas combinations have the highest absolute impact on national total KyotoGHG (AR6GWP100) emissions in 2023 (top 5):
- 1: 1.B.2, CH4 with -7064.49 Gg CO2 / year (-87.7%)
- 2: 2, CO2 with -1074.45 Gg CO2 / year (-7.7%)
- 3: 4, CH4 with -201.72 Gg CO2 / year (-5.4%)
- 4: M.AG.ELV, N2O with -36.41 Gg CO2 / year (-20.3%)
- 5: 2, HFCS (AR6GWP100) with -14.92 Gg CO2 / year (-0.7%)
In the third party priority scenario the following sector-gas combinations have the highest absolute impact on national total KyotoGHG (AR6GWP100) emissions in 1990-2023 (top 5):
- 1: 1.B.2, CH4 with -8058.01 Gg CO2 / year (-86.6%)
- 2: 4, CH4 with -236.23 Gg CO2 / year (-7.2%)
- 3: 2, CO2 with -82.92 Gg CO2 / year (-0.7%)
- 4: 5, N2O with -8.61 Gg CO2 / year (-13.7%)
- 5: M.AG.ELV, N2O with -4.65 Gg CO2 / year (-3.4%)
Notes on data changes
Here we list notes explaining important emissions changes for the country.
- No new country reported data has been included.
- The dominating change for both scenarios is a reduction in CH4 from oil and gas of over 85% in the new EDGAR data
- For 2023 CO2 from chemical industry (2.B) is lower because EDGAR data for 2022 has been changed.
- Further sectors have changed data which comes from updated EDGAR and FAO data.
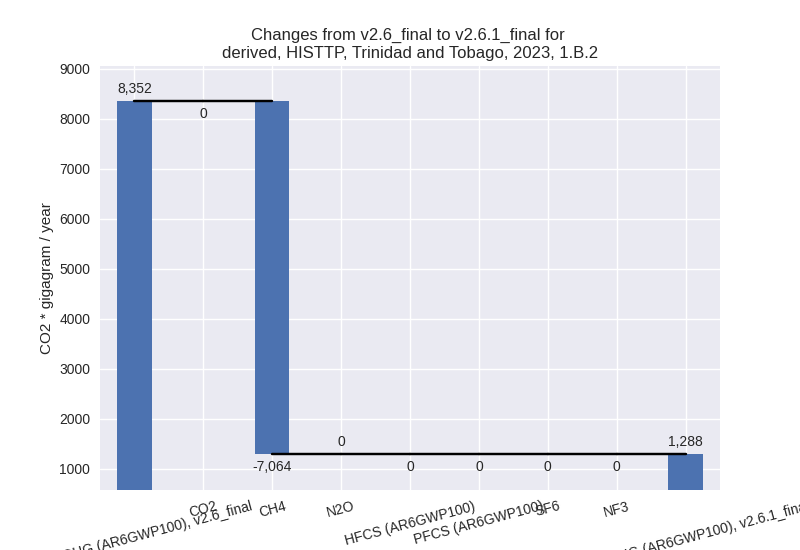
Changes by sector and gas
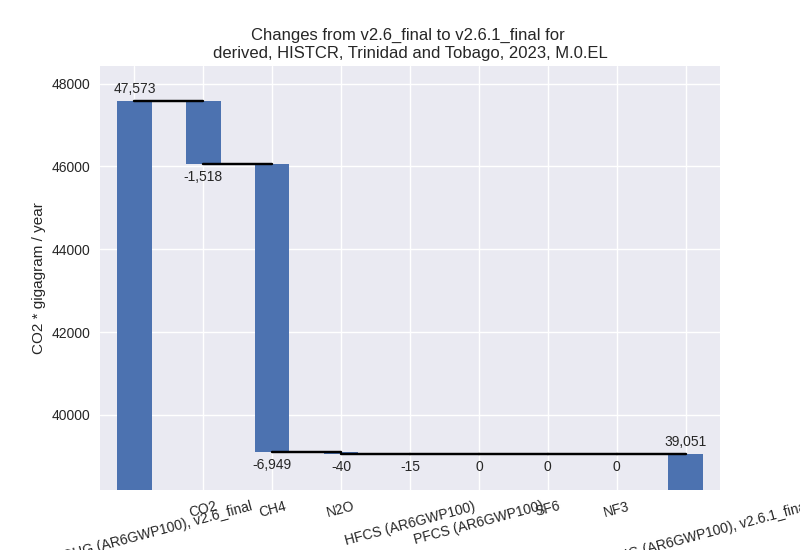
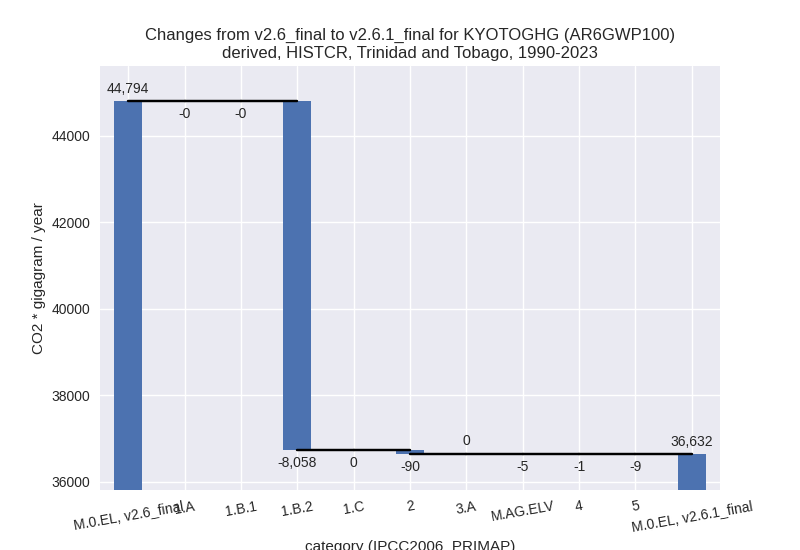
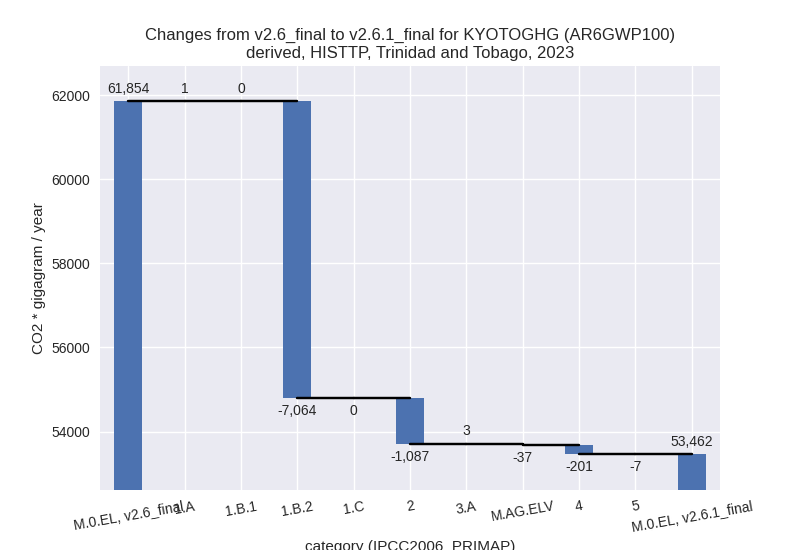
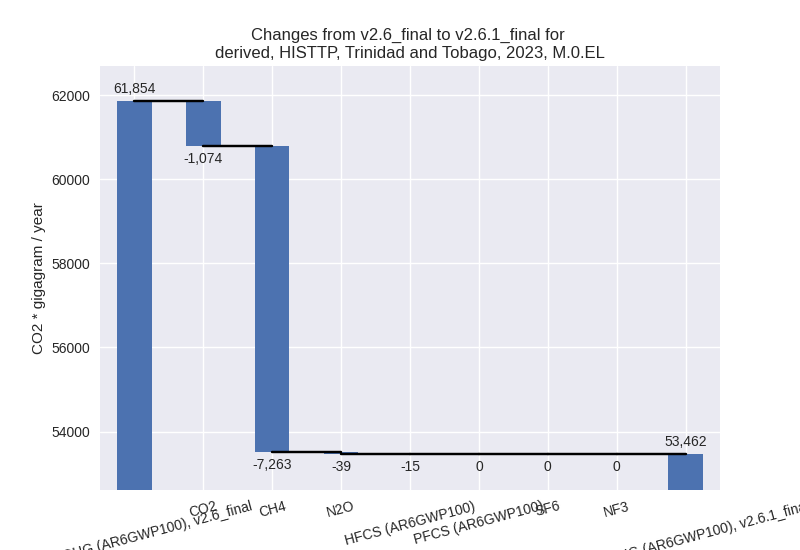
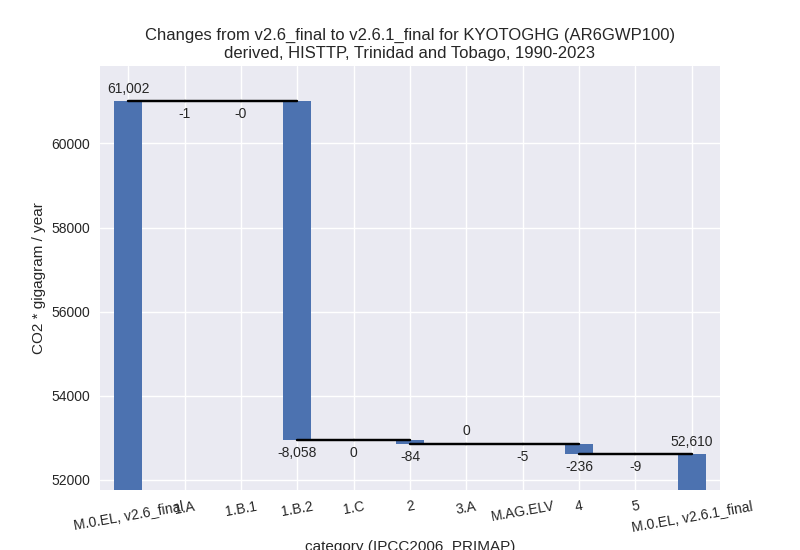
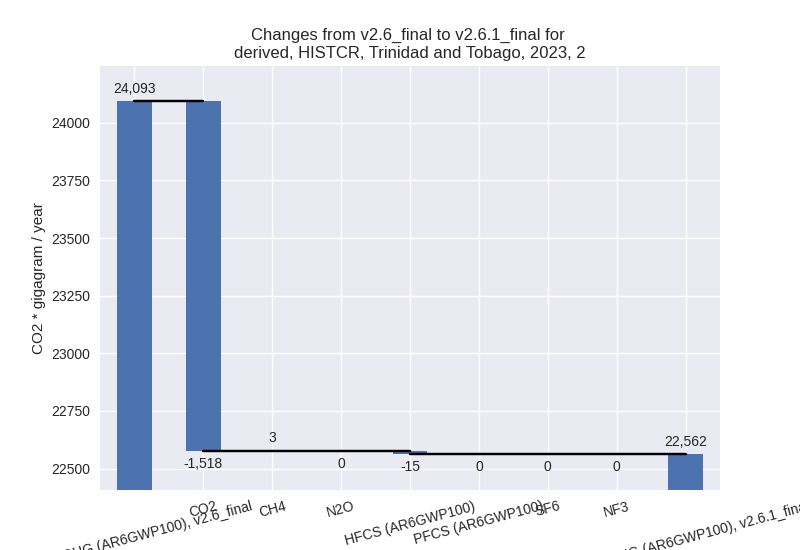
For each scenario and time frame the changes are displayed for all individual sectors and all individual gases. In the sector plot we use aggregate Kyoto GHGs in AR6GWP100. In the gas plot we usenational total emissions without LULUCF.
country reported scenario
2023

1990-2023

third party scenario
2023
1990-2023

Detailed changes for the scenarios:
country reported scenario (HISTCR):
Most important changes per time frame
For 2023 the following sector-gas combinations have the highest absolute impact on national total KyotoGHG (AR6GWP100) emissions in 2023 (top 5):
- 1: 1.B.2, CH4 with -7064.49 Gg CO2 / year (-87.7%)
- 2: 2, CO2 with -1518.48 Gg CO2 / year (-7.3%)
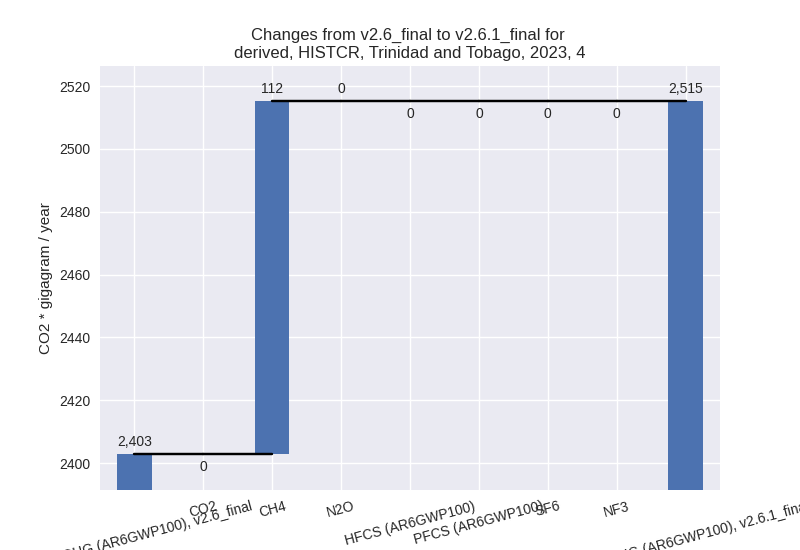
- 3: 4, CH4 with 112.32 Gg CO2 / year (4.7%)
- 4: M.AG.ELV, N2O with -36.41 Gg CO2 / year (-20.3%)
- 5: 2, HFCS (AR6GWP100) with -14.92 Gg CO2 / year (-0.7%)
For 1990-2023 the following sector-gas combinations have the highest absolute impact on national total KyotoGHG (AR6GWP100) emissions in 1990-2023 (top 5):
- 1: 1.B.2, CH4 with -8058.01 Gg CO2 / year (-86.6%)
- 2: 2, CO2 with -89.27 Gg CO2 / year (-0.5%)
- 3: 5, N2O with -8.61 Gg CO2 / year (-13.7%)
- 4: M.AG.ELV, N2O with -4.65 Gg CO2 / year (-3.4%)
- 5: 4, CH4 with -1.20 Gg CO2 / year (-0.1%)
Changes in the main sectors for aggregate KyotoGHG (AR6GWP100) are
- 1: Total sectoral emissions in 2022 are 14174.03 Gg
CO2 / year which is 35.9% of M.0.EL emissions. 2023 Emissions have
changed by -34.1% (-7062.37 Gg CO2 /
year). 1990-2023 Emissions have changed by -33.3% (-8057.70 Gg CO2 / year). For 2023
the changes per gas
are:

For 1990-2023 the changes per gas are:
The changes come from the following subsectors:- 1.A: Total sectoral emissions in 2022 are 12818.11 Gg CO2 / year which is 90.4% of category 1 emissions. 2023 Emissions have changed by 0.0% (1.64 Gg CO2 / year). 1990-2023 Emissions have changed by -0.0% (-0.17 Gg CO2 / year).
- 1.B.1: Total sectoral emissions in 2022 are 4.87 Gg CO2 / year which is 0.0% of category 1 emissions. 2023 Emissions have changed by 0.1% (0.00 Gg CO2 / year). 1990-2023 Emissions have changed by -0.0% (-0.00 Gg CO2 / year).
- 1.B.2: Total sectoral emissions in 2022 are 1351.05
Gg CO2 / year which is 9.5% of category 1 emissions. 2023 Emissions have
changed by -84.6% (-7064.01 Gg CO2 /
year). 1990-2023 Emissions have changed by -69.7% (-8057.53 Gg CO2 / year). For 2023
the changes per gas
are:

For 1990-2023 the changes per gas are:
There is no subsector information available in PRIMAP-hist.
- 2: Total sectoral emissions in 2022 are 22520.94 Gg
CO2 / year which is 57.0% of M.0.EL emissions. 2023 Emissions have
changed by -6.4% (-1530.69 Gg CO2 /
year). 1990-2023 Emissions have changed by -0.5% (-90.25 Gg CO2 / year). For 2023 the
changes per gas
are:
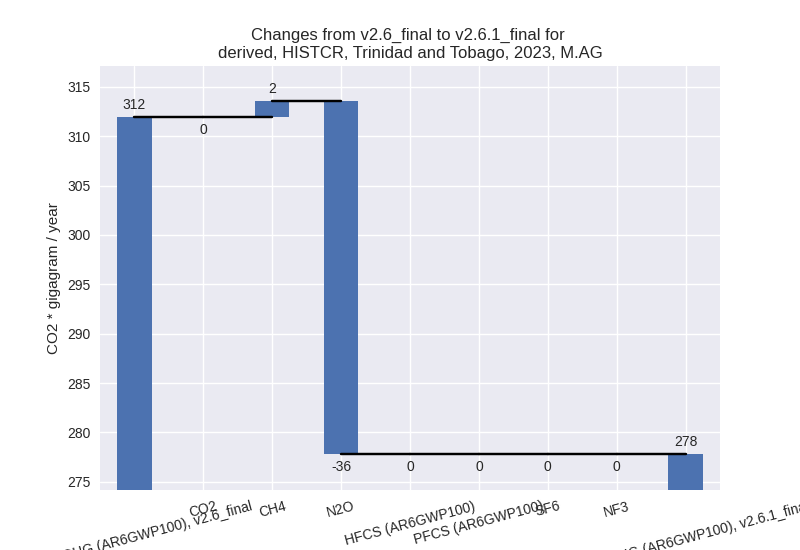
- M.AG: Total sectoral emissions in 2022 are 274.62
Gg CO2 / year which is 0.7% of M.0.EL emissions. 2023 Emissions have
changed by -10.9% (-34.14 Gg CO2 /
year). 1990-2023 Emissions have changed by -1.6% (-4.36 Gg CO2 / year). For 2023 the
changes per gas
are:
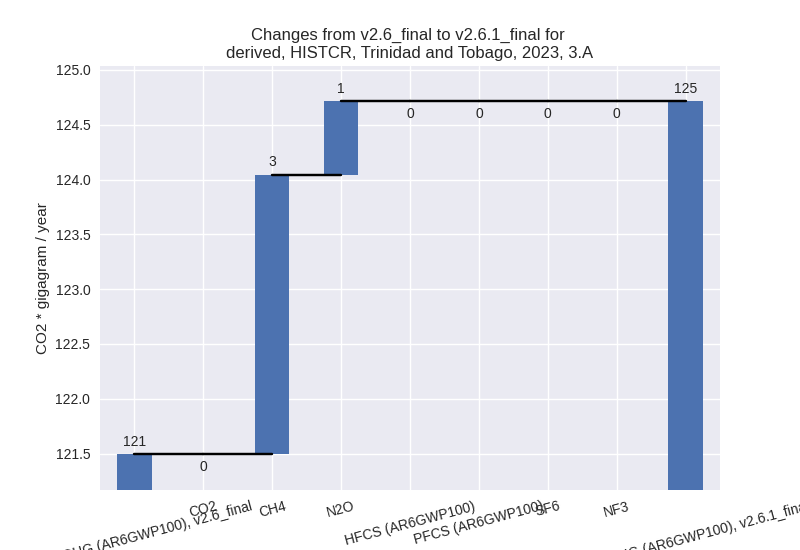
The changes come from the following subsectors:- 3.A: Total sectoral emissions in 2022 are 123.28 Gg
CO2 / year which is 44.9% of category M.AG emissions. 2023 Emissions
have changed by 2.6% (3.22 Gg CO2 /
year). 1990-2023 Emissions have changed by 0.3% (0.35 Gg CO2 / year). For 2023 the
changes per gas
are:
There is no subsector information available in PRIMAP-hist. - M.AG.ELV: Total sectoral emissions in 2022 are
151.34 Gg CO2 / year which is 55.1% of category M.AG emissions. 2023
Emissions have changed by -19.6%
(-37.36 Gg CO2 / year). 1990-2023 Emissions have changed by -3.1% (-4.71 Gg CO2 / year). For 2023 the
changes per gas
are:

For 1990-2023 the changes per gas are:
There is no subsector information available in PRIMAP-hist.
- 3.A: Total sectoral emissions in 2022 are 123.28 Gg
CO2 / year which is 44.9% of category M.AG emissions. 2023 Emissions
have changed by 2.6% (3.22 Gg CO2 /
year). 1990-2023 Emissions have changed by 0.3% (0.35 Gg CO2 / year). For 2023 the
changes per gas
are:
- 4: Total sectoral emissions in 2022 are 2512.35 Gg
CO2 / year which is 6.4% of M.0.EL emissions. 2023 Emissions have
changed by 4.7% (112.32 Gg CO2 /
year). 1990-2023 Emissions have changed by -0.1% (-1.20 Gg CO2 / year). For 2023 the
changes per gas
are:
- 5: Total sectoral emissions in 2022 are 50.33 Gg
CO2 / year which is 0.1% of M.0.EL emissions. 2023 Emissions have
changed by -13.0% (-7.47 Gg CO2 /
year). 1990-2023 Emissions have changed by -13.7% (-8.61 Gg CO2 / year). For 2023 the
changes per gas
are:
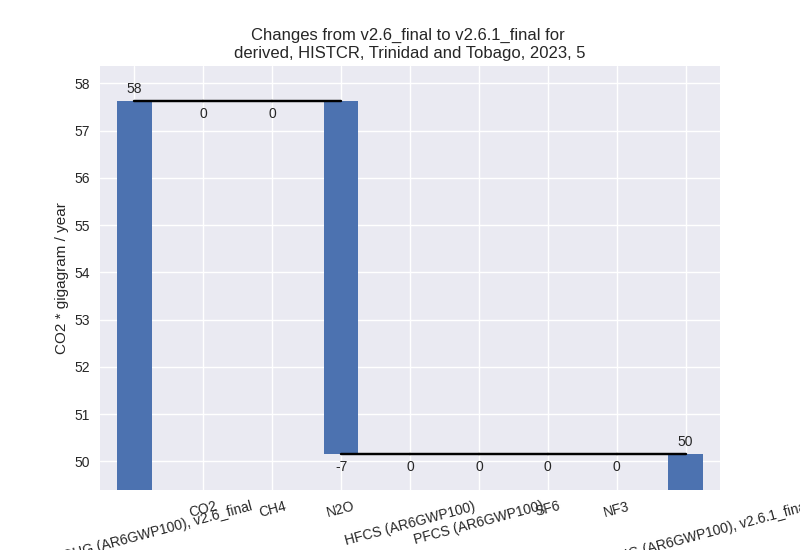
For 1990-2023 the changes per gas are:
third party scenario (HISTTP):
Most important changes per time frame
For 2023 the following sector-gas combinations have the highest absolute impact on national total KyotoGHG (AR6GWP100) emissions in 2023 (top 5):
- 1: 1.B.2, CH4 with -7064.49 Gg CO2 / year (-87.7%)
- 2: 2, CO2 with -1074.45 Gg CO2 / year (-7.7%)
- 3: 4, CH4 with -201.72 Gg CO2 / year (-5.4%)
- 4: M.AG.ELV, N2O with -36.41 Gg CO2 / year (-20.3%)
- 5: 2, HFCS (AR6GWP100) with -14.92 Gg CO2 / year (-0.7%)
For 1990-2023 the following sector-gas combinations have the highest absolute impact on national total KyotoGHG (AR6GWP100) emissions in 1990-2023 (top 5):
- 1: 1.B.2, CH4 with -8058.01 Gg CO2 / year (-86.6%)
- 2: 4, CH4 with -236.23 Gg CO2 / year (-7.2%)
- 3: 2, CO2 with -82.92 Gg CO2 / year (-0.7%)
- 4: 5, N2O with -8.61 Gg CO2 / year (-13.7%)
- 5: M.AG.ELV, N2O with -4.65 Gg CO2 / year (-3.4%)
Changes in the main sectors for aggregate KyotoGHG (AR6GWP100) are
- 1: Total sectoral emissions in 2022 are 34589.18 Gg
CO2 / year which is 63.3% of M.0.EL emissions. 2023 Emissions have
changed by -17.5% (-7063.17 Gg CO2 /
year). 1990-2023 Emissions have changed by -18.5% (-8058.53 Gg CO2 / year). For 2023
the changes per gas
are:

For 1990-2023 the changes per gas are:
The changes come from the following subsectors:- 1.A: Total sectoral emissions in 2022 are 33233.25 Gg CO2 / year which is 96.1% of category 1 emissions. 2023 Emissions have changed by 0.0% (0.84 Gg CO2 / year). 1990-2023 Emissions have changed by -0.0% (-1.00 Gg CO2 / year).
- 1.B.1: Total sectoral emissions in 2022 are 4.87 Gg CO2 / year which is 0.0% of category 1 emissions. 2023 Emissions have changed by 0.1% (0.00 Gg CO2 / year). 1990-2023 Emissions have changed by -0.0% (-0.00 Gg CO2 / year).
- 1.B.2: Total sectoral emissions in 2022 are 1351.05
Gg CO2 / year which is 3.9% of category 1 emissions. 2023 Emissions have
changed by -84.6% (-7064.01 Gg CO2 /
year). 1990-2023 Emissions have changed by -69.7% (-8057.53 Gg CO2 / year). For 2023
the changes per gas
are:
For 1990-2023 the changes per gas are:
There is no subsector information available in PRIMAP-hist.
- 2: Total sectoral emissions in 2022 are 16213.58 Gg
CO2 / year which is 29.7% of M.0.EL emissions. 2023 Emissions have
changed by -6.3% (-1086.67 Gg CO2 /
year). 1990-2023 Emissions have changed by -0.6% (-83.91 Gg CO2 / year). For 2023 the
changes per gas
are:

- M.AG: Total sectoral emissions in 2022 are 274.62
Gg CO2 / year which is 0.5% of M.0.EL emissions. 2023 Emissions have
changed by -10.9% (-34.14 Gg CO2 /
year). 1990-2023 Emissions have changed by -1.6% (-4.36 Gg CO2 / year). For 2023 the
changes per gas
are:

The changes come from the following subsectors:- 3.A: Total sectoral emissions in 2022 are 123.28 Gg
CO2 / year which is 44.9% of category M.AG emissions. 2023 Emissions
have changed by 2.6% (3.22 Gg CO2 /
year). 1990-2023 Emissions have changed by 0.3% (0.35 Gg CO2 / year). For 2023 the
changes per gas
are:

There is no subsector information available in PRIMAP-hist. - M.AG.ELV: Total sectoral emissions in 2022 are
151.34 Gg CO2 / year which is 55.1% of category M.AG emissions. 2023
Emissions have changed by -19.6%
(-37.36 Gg CO2 / year). 1990-2023 Emissions have changed by -3.1% (-4.71 Gg CO2 / year). For 2023 the
changes per gas
are:

For 1990-2023 the changes per gas are:
There is no subsector information available in PRIMAP-hist.
- 3.A: Total sectoral emissions in 2022 are 123.28 Gg
CO2 / year which is 44.9% of category M.AG emissions. 2023 Emissions
have changed by 2.6% (3.22 Gg CO2 /
year). 1990-2023 Emissions have changed by 0.3% (0.35 Gg CO2 / year). For 2023 the
changes per gas
are:
- 4: Total sectoral emissions in 2022 are 3521.50 Gg
CO2 / year which is 6.4% of M.0.EL emissions. 2023 Emissions have
changed by -5.4% (-200.62 Gg CO2 /
year). 1990-2023 Emissions have changed by -7.2% (-236.14 Gg CO2 / year). For 2023
the changes per gas
are:

For 1990-2023 the changes per gas are:
- 5: Total sectoral emissions in 2022 are 50.33 Gg
CO2 / year which is 0.1% of M.0.EL emissions. 2023 Emissions have
changed by -13.0% (-7.47 Gg CO2 /
year). 1990-2023 Emissions have changed by -13.7% (-8.61 Gg CO2 / year). For 2023 the
changes per gas
are:

For 1990-2023 the changes per gas are: