Changes in PRIMAP-hist v2.6.1_final compared to v2.6_final for Türkiye
2025-03-19
Johannes Gütschow
Change analysis for Türkiye for PRIMAP-hist v2.6.1_final compared to v2.6_final
Overview over emissions by sector and gas
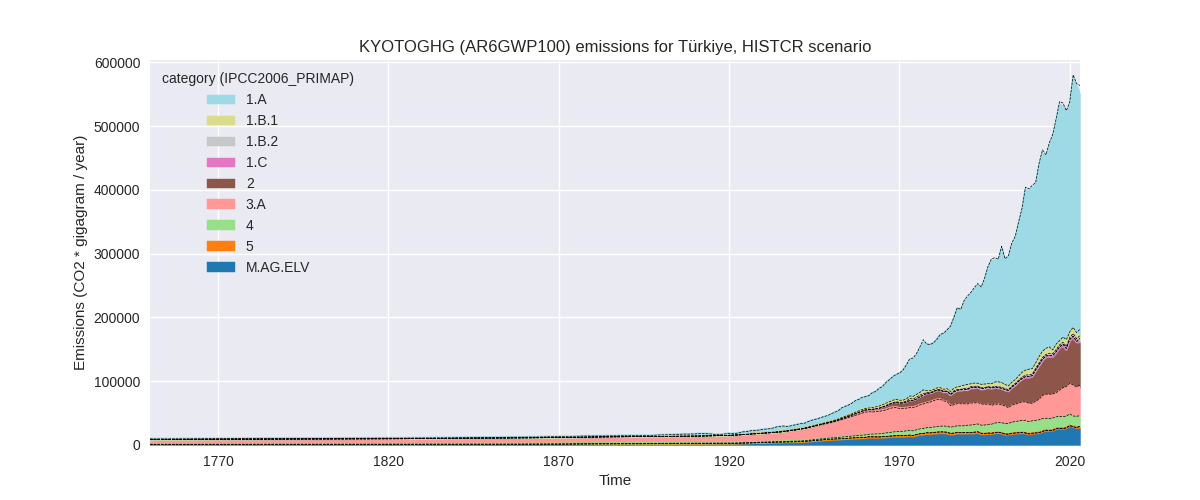
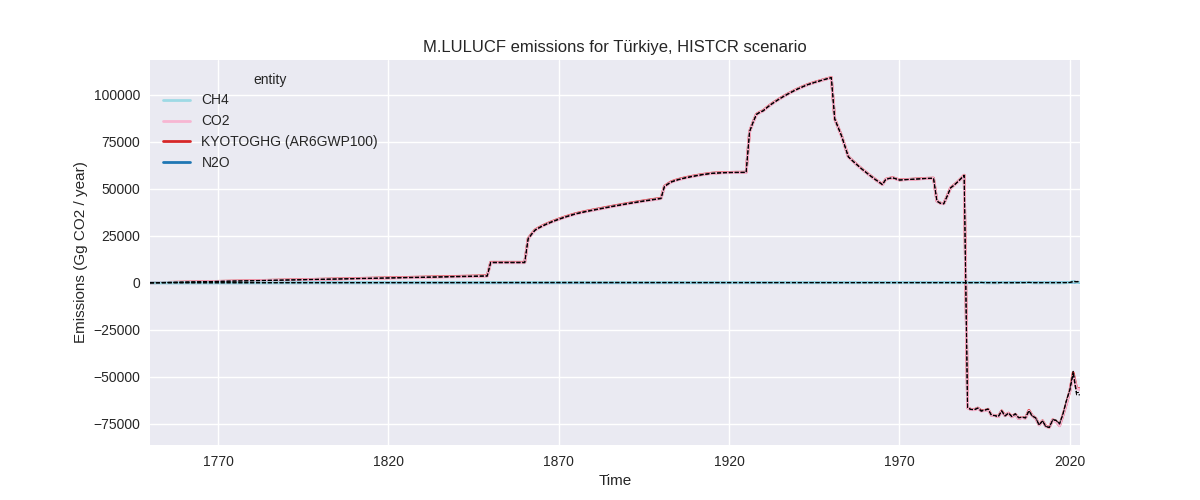
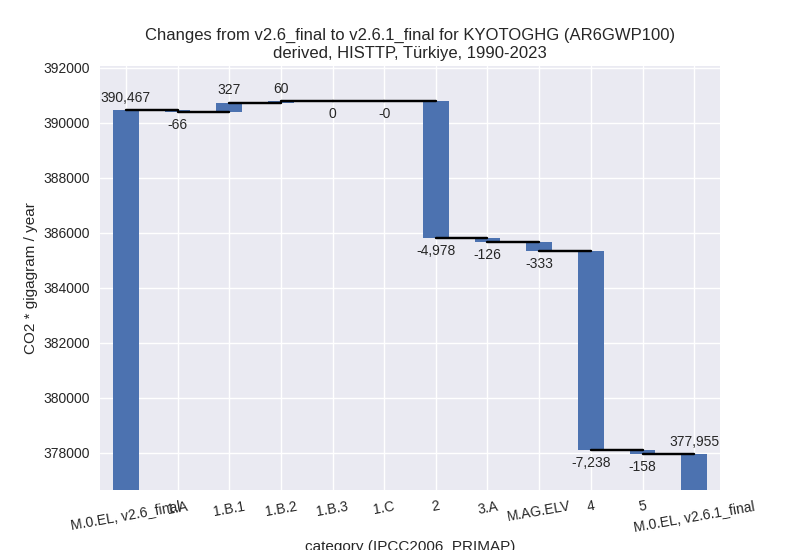
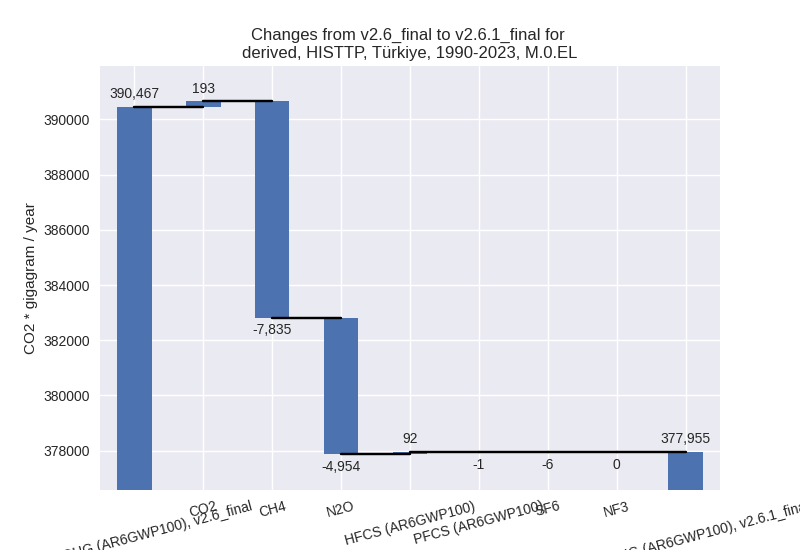
The following figures show the aggregate national total emissions excluding LULUCF AR6GWP100 for the country reported priority scenario. The dotted linesshow the v2.6_final data.
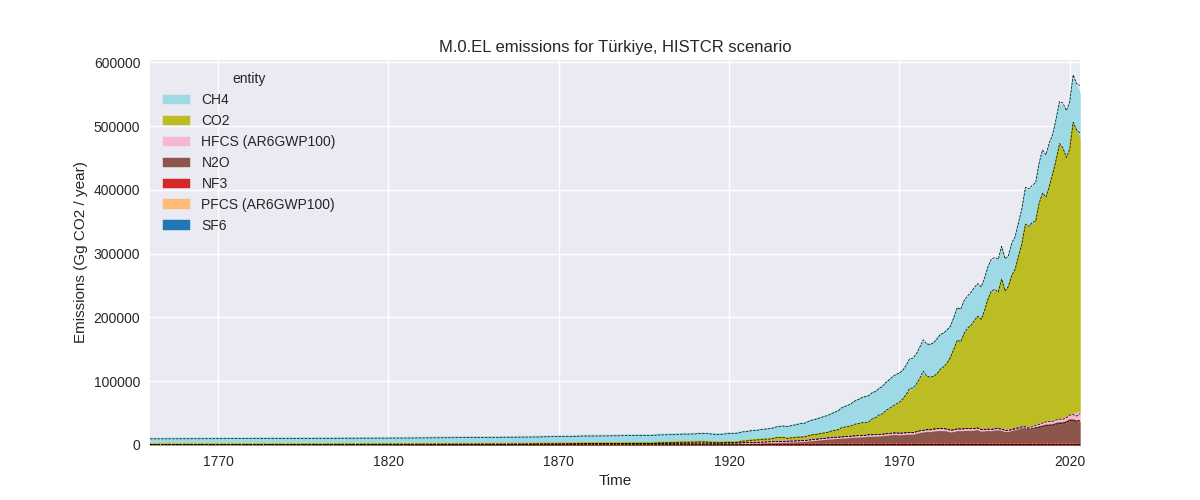
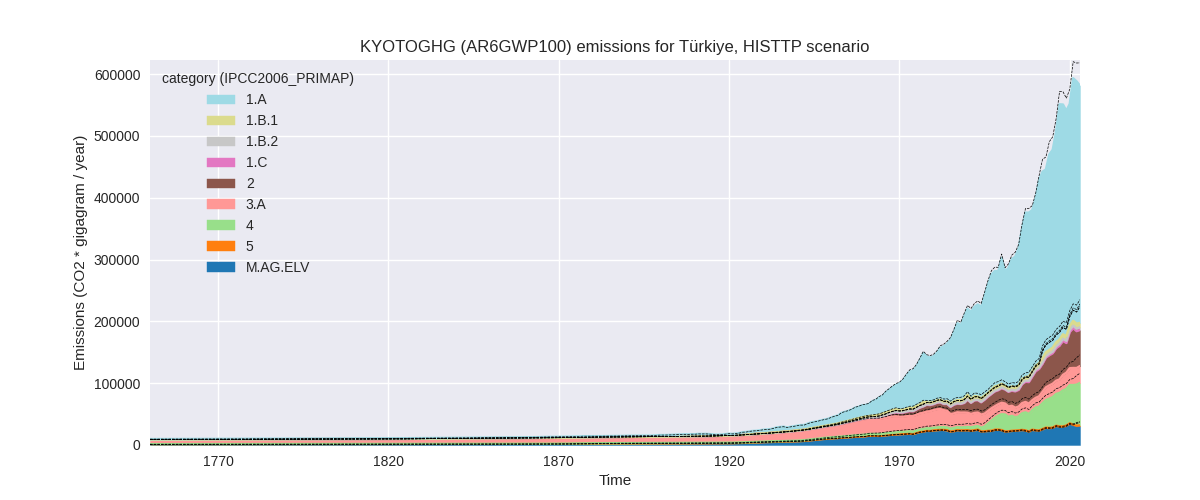
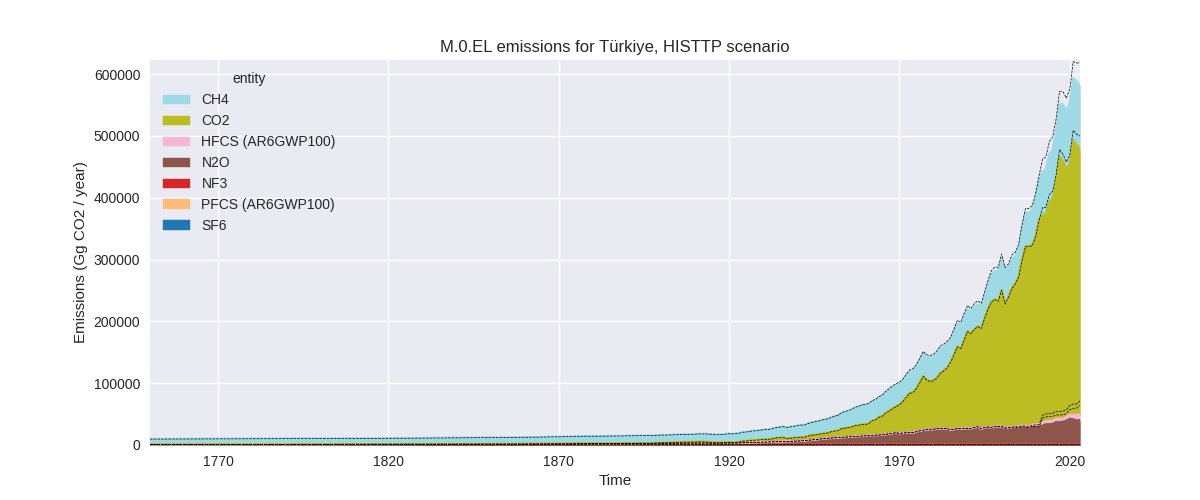
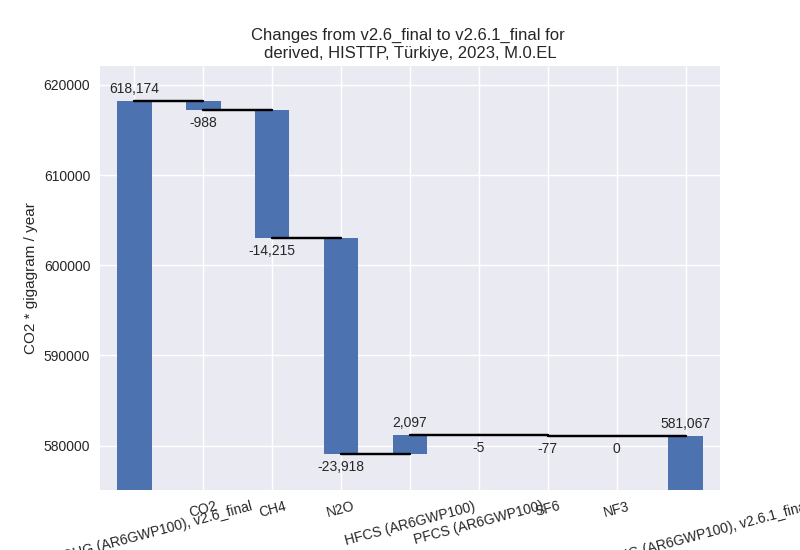
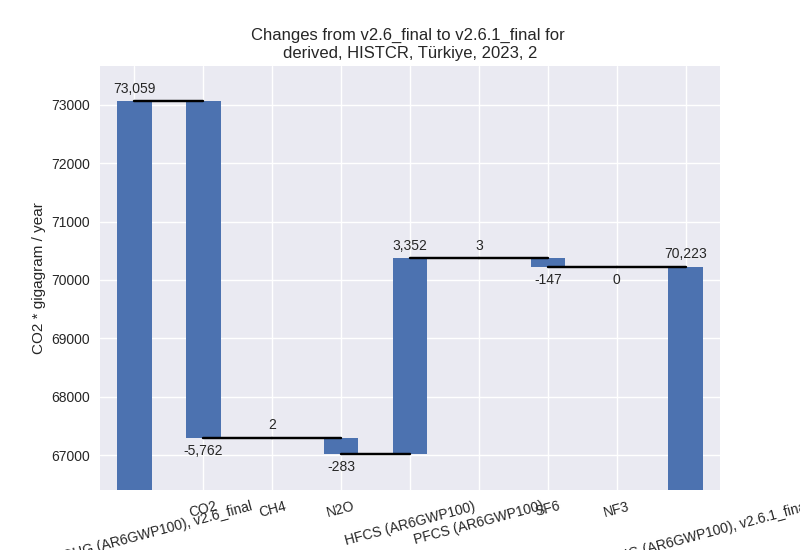
The following figures show the aggregate national total emissions excluding LULUCF AR6GWP100 for the third party priority scenario. The dotted linesshow the v2.6_final data.
Overview over changes
In the country reported priority scenario we have the following changes for aggregate Kyoto GHG and national total emissions excluding LULUCF (M.0.EL):
- Emissions in 2023 have changed by -2.2%% (-12158.24 Gg CO2 / year)
- Emissions in 1990-2023 have changed by -1.2%% (-4518.31 Gg CO2 / year)
In the third party priority scenario we have the following changes for aggregate Kyoto GHG and national total emissions excluding LULUCF (M.0.EL):
- Emissions in 2023 have changed by -6.0%% (-37106.63 Gg CO2 / year)
- Emissions in 1990-2023 have changed by -3.2%% (-12511.29 Gg CO2 / year)
Most important changes per scenario and time frame
In the country reported priority scenario the following sector-gas combinations have the highest absolute impact on national total KyotoGHG (AR6GWP100) emissions in 2023 (top 5):
- 1: 2, CO2 with -5761.63 Gg CO2 / year (-9.4%)
- 2: 2, HFCS (AR6GWP100) with 3351.86 Gg CO2 / year (34.4%)
- 3: M.AG.ELV, N2O with -2321.70 Gg CO2 / year (-8.4%)
- 4: 1.B.1, CO2 with -2231.23 Gg CO2 / year (-100.0%)
- 5: 1.B.1, CH4 with -1634.92 Gg CO2 / year (-21.2%)
In the country reported priority scenario the following sector-gas combinations have the highest absolute impact on national total KyotoGHG (AR6GWP100) emissions in 1990-2023 (top 5):
- 1: 1.B.1, CO2 with -2094.57 Gg CO2 / year (-100.0%)
- 2: M.AG.ELV, N2O with -1435.48 Gg CO2 / year (-7.2%)
- 3: 4, CH4 with -1325.29 Gg CO2 / year (-8.8%)
- 4: 1.A, CO2 with -1130.63 Gg CO2 / year (-0.4%)
- 5: 5, N2O with 1021.98 Gg CO2 / year (inf%)
In the third party priority scenario the following sector-gas combinations have the highest absolute impact on national total KyotoGHG (AR6GWP100) emissions in 2023 (top 5):
- 1: 2, N2O with -20607.33 Gg CO2 / year (-79.8%)
- 2: 4, CH4 with -9664.12 Gg CO2 / year (-12.6%)
- 3: M.AG.ELV, N2O with -4045.68 Gg CO2 / year (-13.0%)
- 4: 3.A, CH4 with -2299.89 Gg CO2 / year (-7.8%)
- 5: 2, HFCS (AR6GWP100) with 2096.87 Gg CO2 / year (29.1%)
In the third party priority scenario the following sector-gas combinations have the highest absolute impact on national total KyotoGHG (AR6GWP100) emissions in 1990-2023 (top 5):
- 1: 4, CH4 with -7236.91 Gg CO2 / year (-18.8%)
- 2: 2, N2O with -5077.13 Gg CO2 / year (-53.5%)
- 3: 1.A, CH4 with -570.64 Gg CO2 / year (-16.6%)
- 4: 1.A, N2O with 504.99 Gg CO2 / year (21.0%)
- 5: 1.B.1, CH4 with 236.02 Gg CO2 / year (6.0%)
Notes on data changes
Here we list notes explaining important emissions changes for the country.
- CRT data has been included but replaces official data. The data
shows some differences, especially for gases and subsectors as the data
used in PRIMAP-hist v2.6 was only available on a level of the top
sectors and aggregate Kyoto greenhouse gases and was downscaled using
the 2023 CRF data. Thus total emissions have changed much less than gas
and sector time-series
- Some sectors, e.g. waste have changes time-series for aggregate Kyoto gases because the time-series reported to the UN differ from those used in the inventory.
- Changes in the TP scenario are much higher, mostly due much lower emissions for N2O in 2.B and CH4 from waste. For 2023 the additional year in FAOSTAT data impacts agricultural emissions
Changes by sector and gas
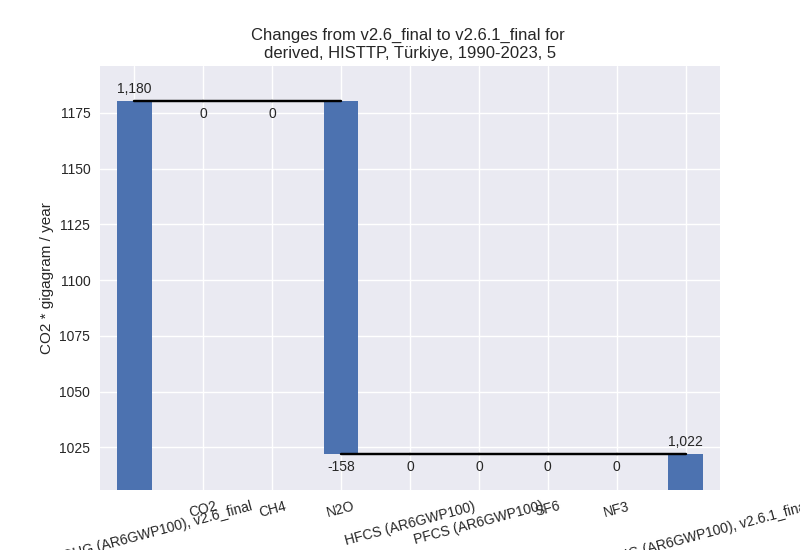
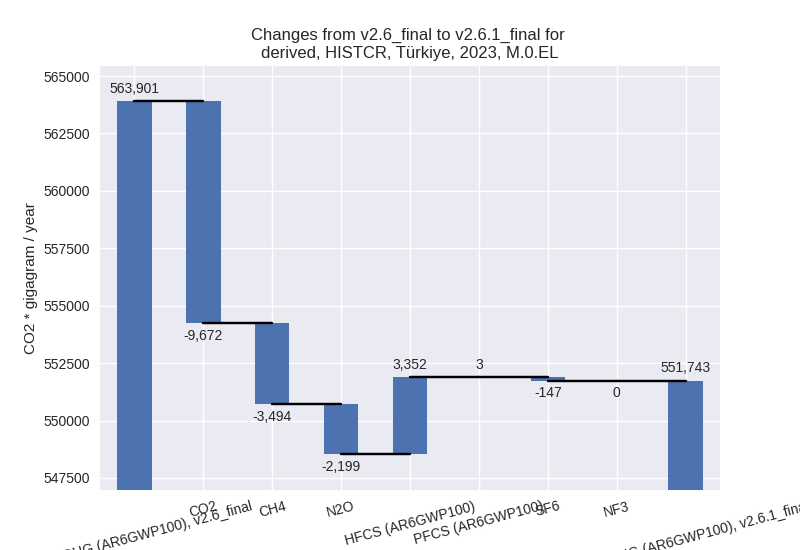
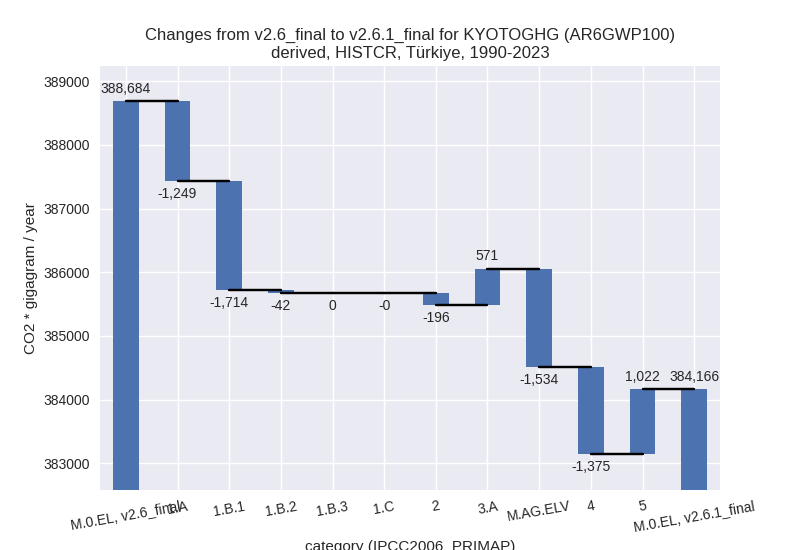
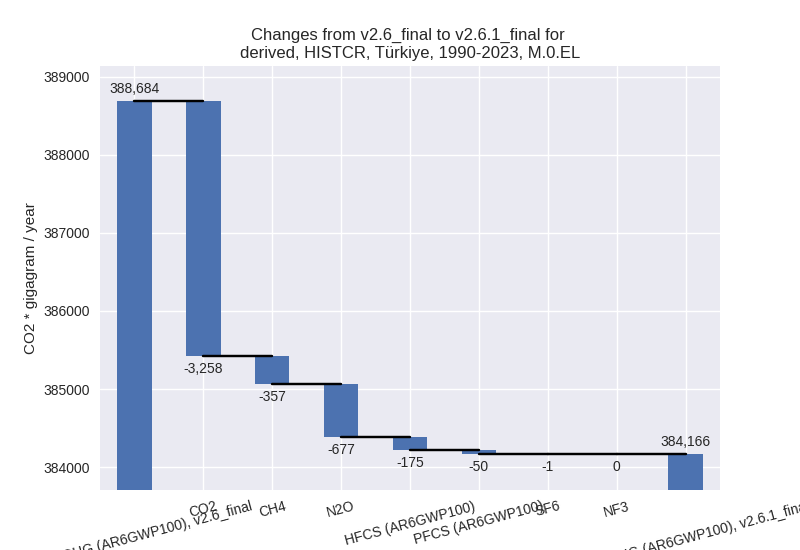
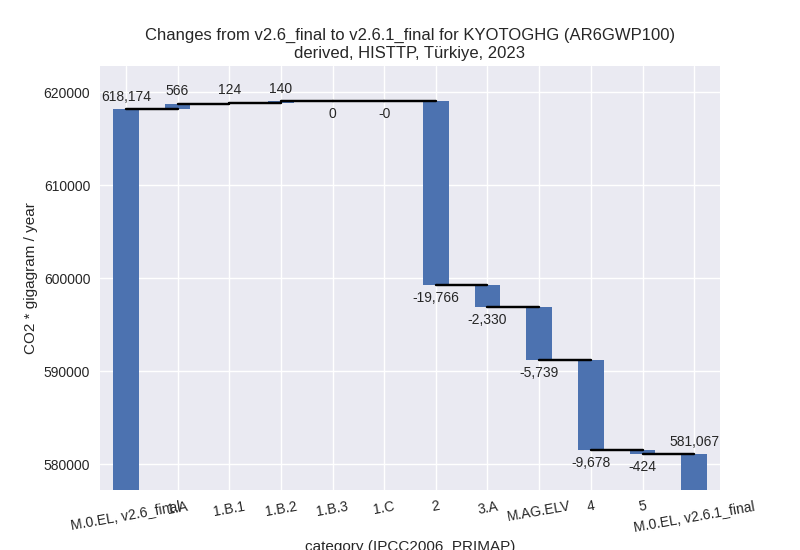
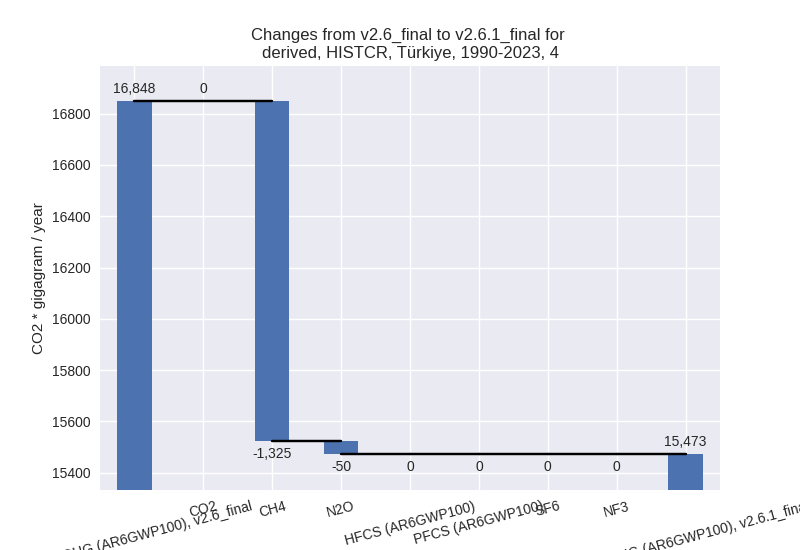
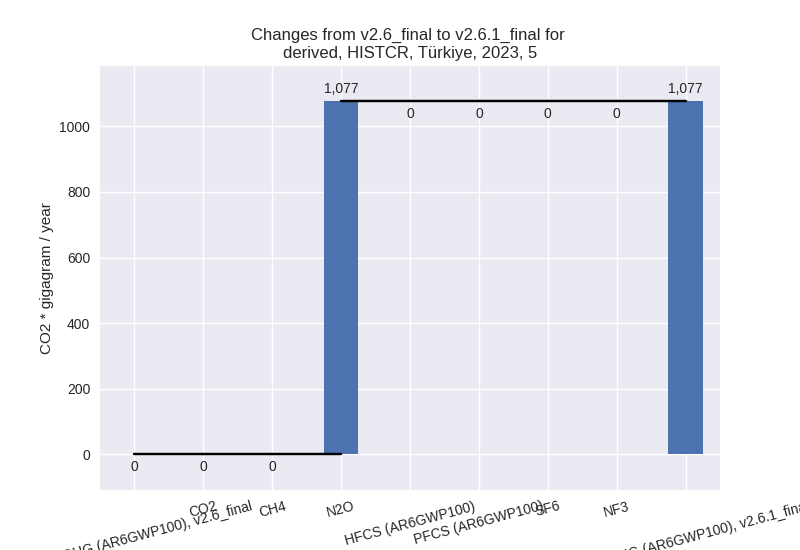
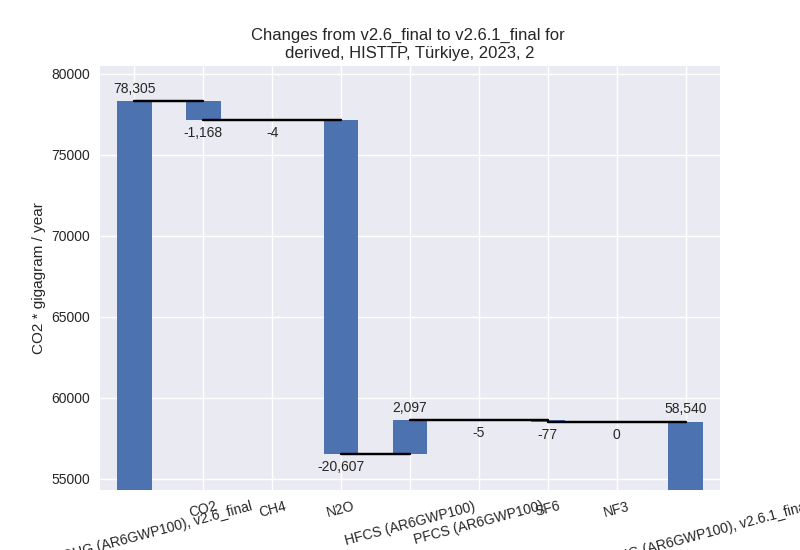
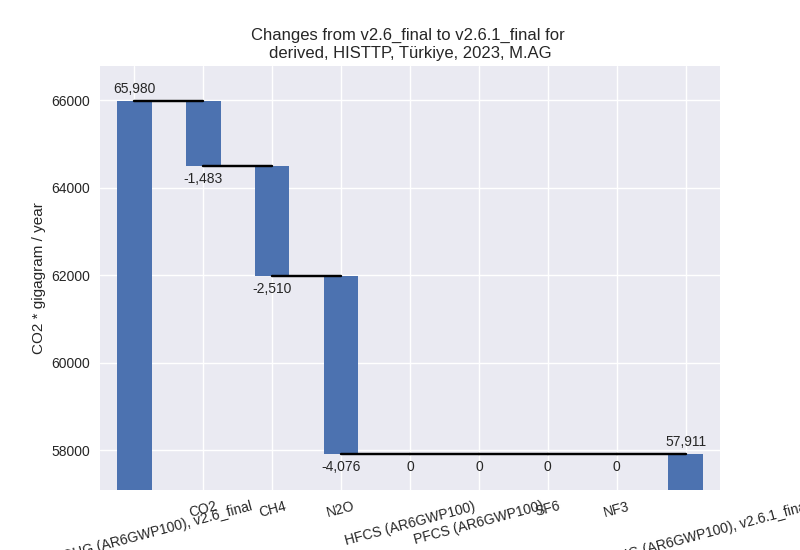
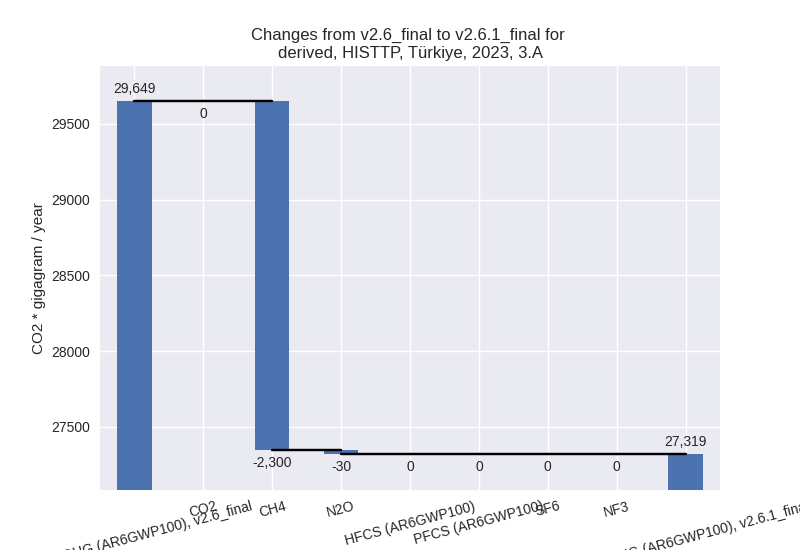
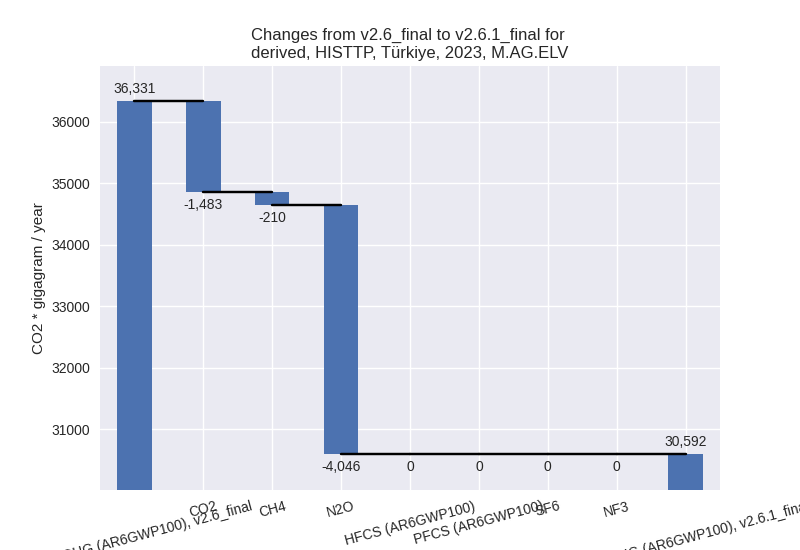
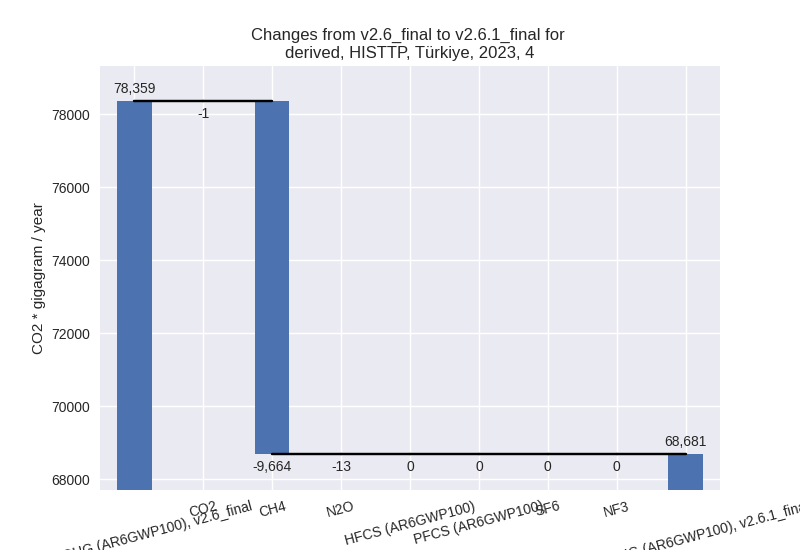
For each scenario and time frame the changes are displayed for all individual sectors and all individual gases. In the sector plot we use aggregate Kyoto GHGs in AR6GWP100. In the gas plot we usenational total emissions without LULUCF.
country reported scenario
2023
1990-2023
third party scenario
2023
1990-2023
Detailed changes for the scenarios:
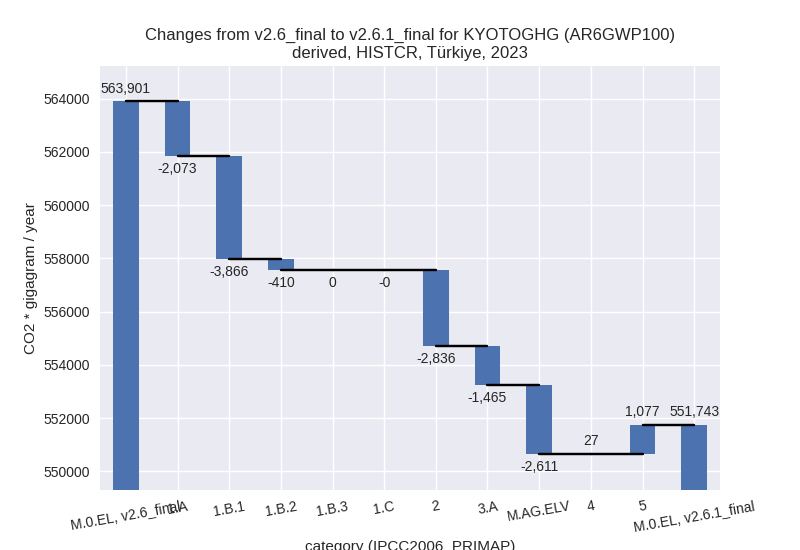
country reported scenario (HISTCR):
Most important changes per time frame
For 2023 the following sector-gas combinations have the highest absolute impact on national total KyotoGHG (AR6GWP100) emissions in 2023 (top 5):
- 1: 2, CO2 with -5761.63 Gg CO2 / year (-9.4%)
- 2: 2, HFCS (AR6GWP100) with 3351.86 Gg CO2 / year (34.4%)
- 3: M.AG.ELV, N2O with -2321.70 Gg CO2 / year (-8.4%)
- 4: 1.B.1, CO2 with -2231.23 Gg CO2 / year (-100.0%)
- 5: 1.B.1, CH4 with -1634.92 Gg CO2 / year (-21.2%)
For 1990-2023 the following sector-gas combinations have the highest absolute impact on national total KyotoGHG (AR6GWP100) emissions in 1990-2023 (top 5):
- 1: 1.B.1, CO2 with -2094.57 Gg CO2 / year (-100.0%)
- 2: M.AG.ELV, N2O with -1435.48 Gg CO2 / year (-7.2%)
- 3: 4, CH4 with -1325.29 Gg CO2 / year (-8.8%)
- 4: 1.A, CO2 with -1130.63 Gg CO2 / year (-0.4%)
- 5: 5, N2O with 1021.98 Gg CO2 / year (inf%)
Changes in the main sectors for aggregate KyotoGHG (AR6GWP100) are
- 1: Total sectoral emissions in 2022 are 400650.60 Gg CO2 / year which is 71.3% of M.0.EL emissions. 2023 Emissions have changed by -1.6% (-6349.27 Gg CO2 / year). 1990-2023 Emissions have changed by -1.1% (-3005.60 Gg CO2 / year).
- 2: Total sectoral emissions in 2022 are 71736.39 Gg
CO2 / year which is 12.8% of M.0.EL emissions. 2023 Emissions have
changed by -3.9% (-2836.01 Gg CO2 /
year). 1990-2023 Emissions have changed by -0.5% (-196.04 Gg CO2 / year). For 2023
the changes per gas
are:
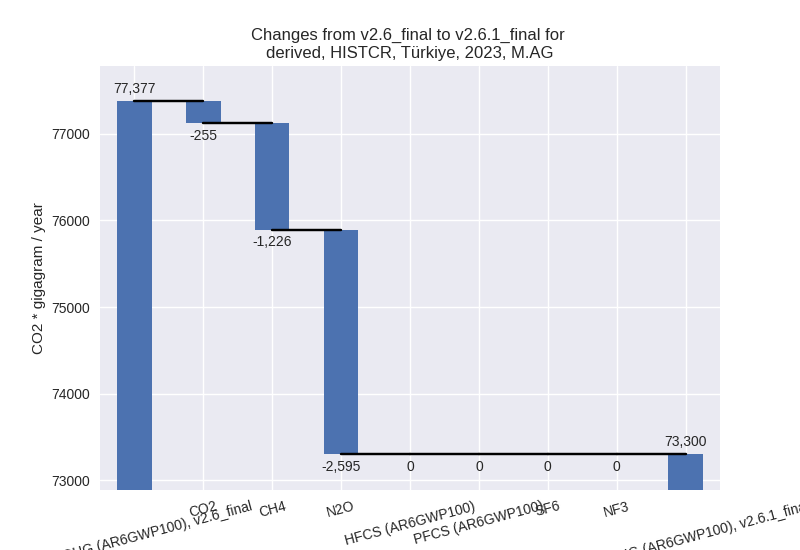
- M.AG: Total sectoral emissions in 2022 are 72162.29
Gg CO2 / year which is 12.8% of M.0.EL emissions. 2023 Emissions have
changed by -5.3% (-4076.22 Gg CO2 /
year). 1990-2023 Emissions have changed by -1.7% (-963.42 Gg CO2 / year). For 2023
the changes per gas
are:
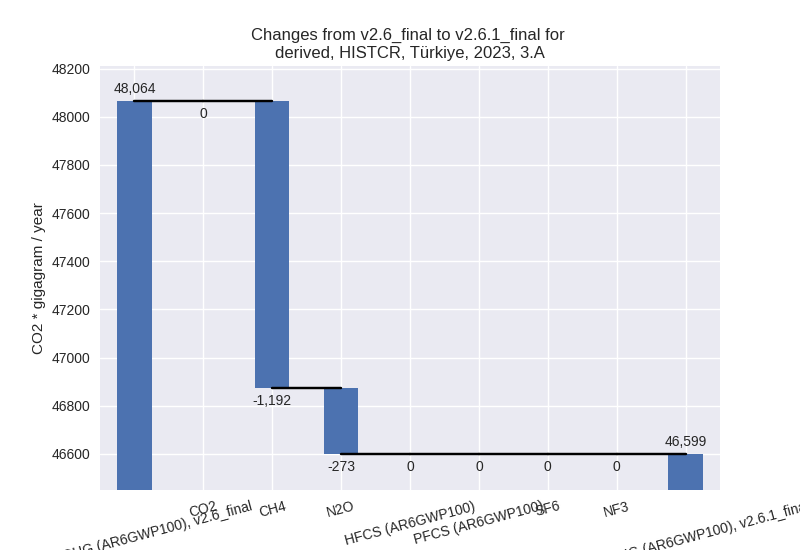
The changes come from the following subsectors:- 3.A: Total sectoral emissions in 2022 are 45958.77
Gg CO2 / year which is 63.7% of category M.AG emissions. 2023 Emissions
have changed by -3.0% (-1465.04 Gg
CO2 / year). 1990-2023 Emissions have changed by 1.7% (570.57 Gg CO2 / year). For 2023 the
changes per gas
are:
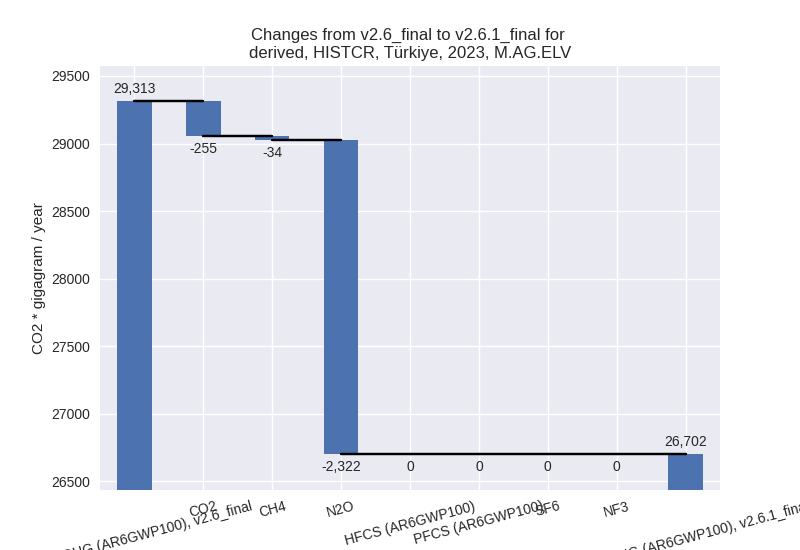
There is no subsector information available in PRIMAP-hist. - M.AG.ELV: Total sectoral emissions in 2022 are
26203.52 Gg CO2 / year which is 36.3% of category M.AG emissions. 2023
Emissions have changed by -8.9%
(-2611.17 Gg CO2 / year). 1990-2023 Emissions have changed by -7.2% (-1533.99 Gg CO2 / year). For 2023
the changes per gas
are:
For 1990-2023 the changes per gas are: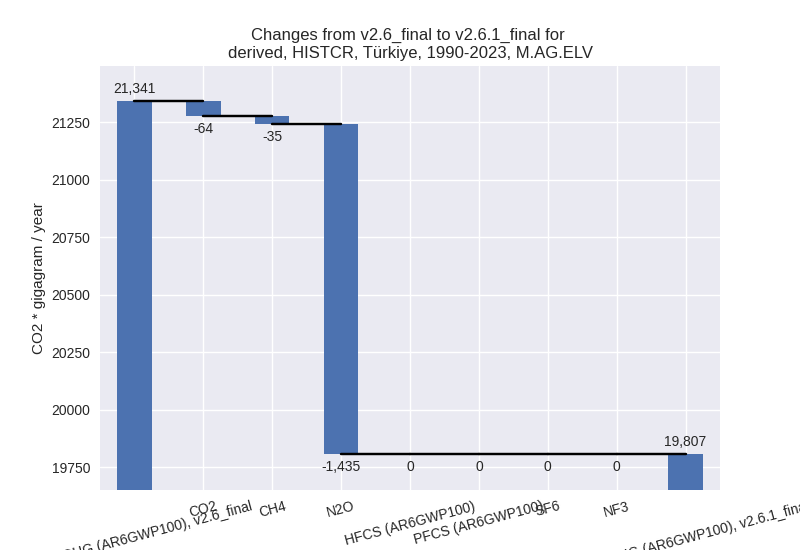
There is no subsector information available in PRIMAP-hist.
- 3.A: Total sectoral emissions in 2022 are 45958.77
Gg CO2 / year which is 63.7% of category M.AG emissions. 2023 Emissions
have changed by -3.0% (-1465.04 Gg
CO2 / year). 1990-2023 Emissions have changed by 1.7% (570.57 Gg CO2 / year). For 2023 the
changes per gas
are:
- 4: Total sectoral emissions in 2022 are 16279.05 Gg
CO2 / year which is 2.9% of M.0.EL emissions. 2023 Emissions have
changed by 0.2% (26.52 Gg CO2 /
year). 1990-2023 Emissions have changed by -8.2% (-1375.23 Gg CO2 / year). For
1990-2023 the changes per gas
are:
- 5: Total sectoral emissions in 2022 are 1092.10 Gg
CO2 / year which is 0.2% of M.0.EL emissions. 2023 Emissions have
changed by inf% (1076.74 Gg CO2 /
year). 1990-2023 Emissions have changed by inf% (1021.98 Gg CO2 / year). For 2023 the
changes per gas
are:
For 1990-2023 the changes per gas are: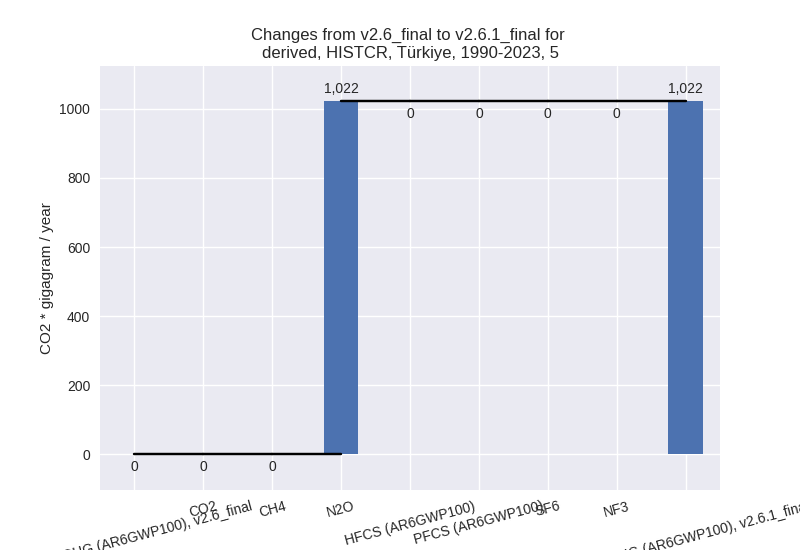
third party scenario (HISTTP):
Most important changes per time frame
For 2023 the following sector-gas combinations have the highest absolute impact on national total KyotoGHG (AR6GWP100) emissions in 2023 (top 5):
- 1: 2, N2O with -20607.33 Gg CO2 / year (-79.8%)
- 2: 4, CH4 with -9664.12 Gg CO2 / year (-12.6%)
- 3: M.AG.ELV, N2O with -4045.68 Gg CO2 / year (-13.0%)
- 4: 3.A, CH4 with -2299.89 Gg CO2 / year (-7.8%)
- 5: 2, HFCS (AR6GWP100) with 2096.87 Gg CO2 / year (29.1%)
For 1990-2023 the following sector-gas combinations have the highest absolute impact on national total KyotoGHG (AR6GWP100) emissions in 1990-2023 (top 5):
- 1: 4, CH4 with -7236.91 Gg CO2 / year (-18.8%)
- 2: 2, N2O with -5077.13 Gg CO2 / year (-53.5%)
- 3: 1.A, CH4 with -570.64 Gg CO2 / year (-16.6%)
- 4: 1.A, N2O with 504.99 Gg CO2 / year (21.0%)
- 5: 1.B.1, CH4 with 236.02 Gg CO2 / year (6.0%)
Changes in the main sectors for aggregate KyotoGHG (AR6GWP100) are
- 1: Total sectoral emissions in 2022 are 404002.52 Gg CO2 / year which is 68.7% of M.0.EL emissions. 2023 Emissions have changed by 0.2% (830.15 Gg CO2 / year). 1990-2023 Emissions have changed by 0.1% (321.52 Gg CO2 / year).
- 2: Total sectoral emissions in 2022 are 59759.14 Gg
CO2 / year which is 10.2% of M.0.EL emissions. 2023 Emissions have
changed by -25.2% (-19765.58 Gg CO2
/ year). 1990-2023 Emissions have changed by -12.1% (-4977.57 Gg CO2 / year). For 2023
the changes per gas
are:
For 1990-2023 the changes per gas are: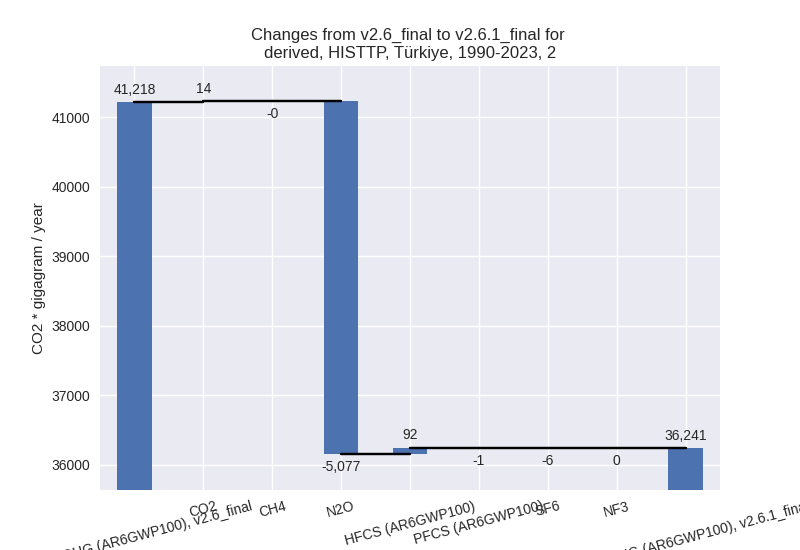
- M.AG: Total sectoral emissions in 2022 are 57007.10
Gg CO2 / year which is 9.7% of M.0.EL emissions. 2023 Emissions have
changed by -12.2% (-8069.24 Gg CO2 /
year). 1990-2023 Emissions have changed by -1.0% (-459.26 Gg CO2 / year). For 2023
the changes per gas
are:
The changes come from the following subsectors:- 3.A: Total sectoral emissions in 2022 are 26923.69
Gg CO2 / year which is 47.2% of category M.AG emissions. 2023 Emissions
have changed by -7.9% (-2329.94 Gg
CO2 / year). 1990-2023 Emissions have changed by -0.6% (-125.93 Gg CO2 / year). For 2023
the changes per gas
are:
There is no subsector information available in PRIMAP-hist. - M.AG.ELV: Total sectoral emissions in 2022 are
30083.40 Gg CO2 / year which is 52.8% of category M.AG emissions. 2023
Emissions have changed by -15.8%
(-5739.30 Gg CO2 / year). 1990-2023 Emissions have changed by -1.3% (-333.34 Gg CO2 / year). For 2023
the changes per gas
are:
There is no subsector information available in PRIMAP-hist.
- 3.A: Total sectoral emissions in 2022 are 26923.69
Gg CO2 / year which is 47.2% of category M.AG emissions. 2023 Emissions
have changed by -7.9% (-2329.94 Gg
CO2 / year). 1990-2023 Emissions have changed by -0.6% (-125.93 Gg CO2 / year). For 2023
the changes per gas
are:
- 4: Total sectoral emissions in 2022 are 66341.53 Gg
CO2 / year which is 11.3% of M.0.EL emissions. 2023 Emissions have
changed by -12.4% (-9677.63 Gg CO2 /
year). 1990-2023 Emissions have changed by -18.2% (-7237.81 Gg CO2 / year). For 2023
the changes per gas
are:
For 1990-2023 the changes per gas are:
- 5: Total sectoral emissions in 2022 are 1092.10 Gg
CO2 / year which is 0.2% of M.0.EL emissions. 2023 Emissions have
changed by -28.3% (-424.33 Gg CO2 /
year). 1990-2023 Emissions have changed by -13.4% (-158.16 Gg CO2 / year). For 2023
the changes per gas
are:

For 1990-2023 the changes per gas are: