Changes in PRIMAP-hist v2.6.1_final compared to v2.6_final for Taiwan, Province of China
2025-03-19
Johannes Gütschow
Change analysis for Taiwan, Province of China for PRIMAP-hist v2.6.1_final compared to v2.6_final
Overview over emissions by sector and gas
The following figures show the aggregate national total emissions excluding LULUCF AR6GWP100 for the country reported priority scenario. The dotted linesshow the v2.6_final data.
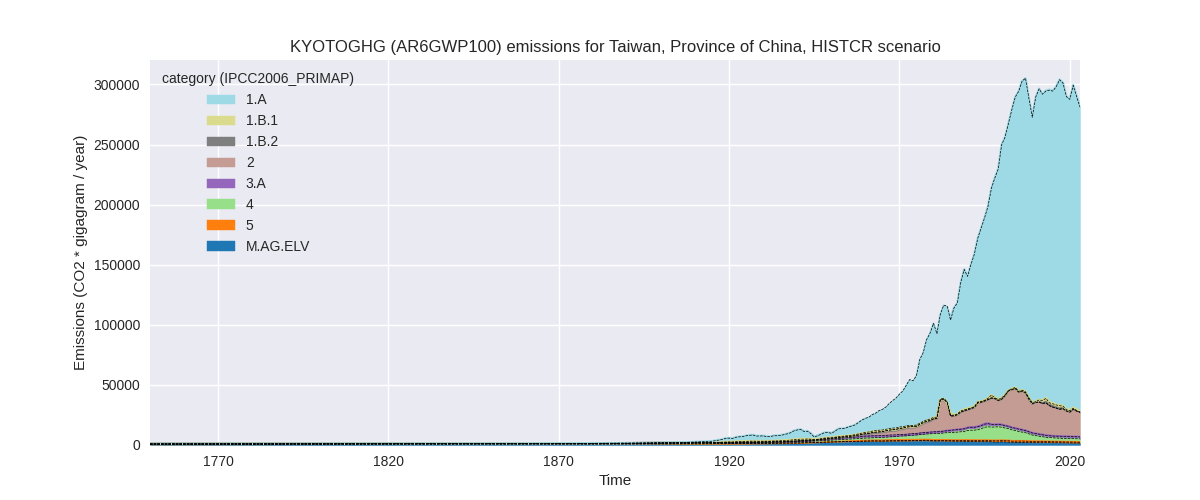

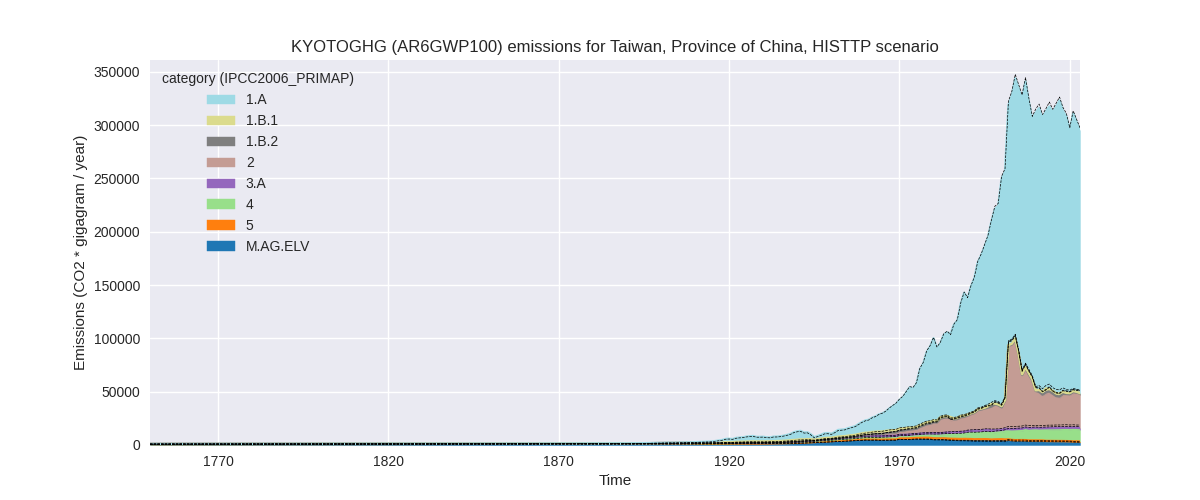
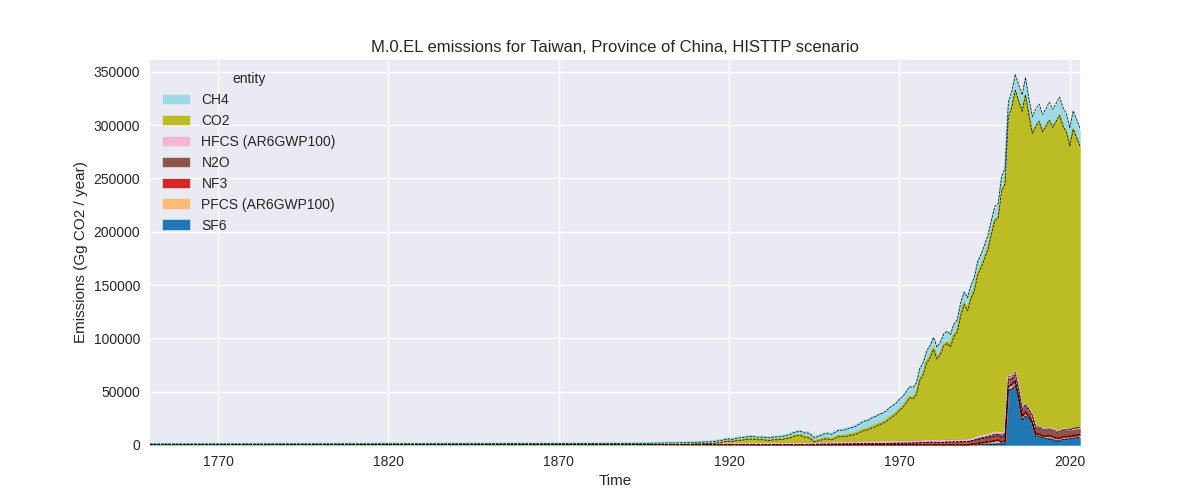
The following figures show the aggregate national total emissions excluding LULUCF AR6GWP100 for the third party priority scenario. The dotted linesshow the v2.6_final data.
Overview over changes
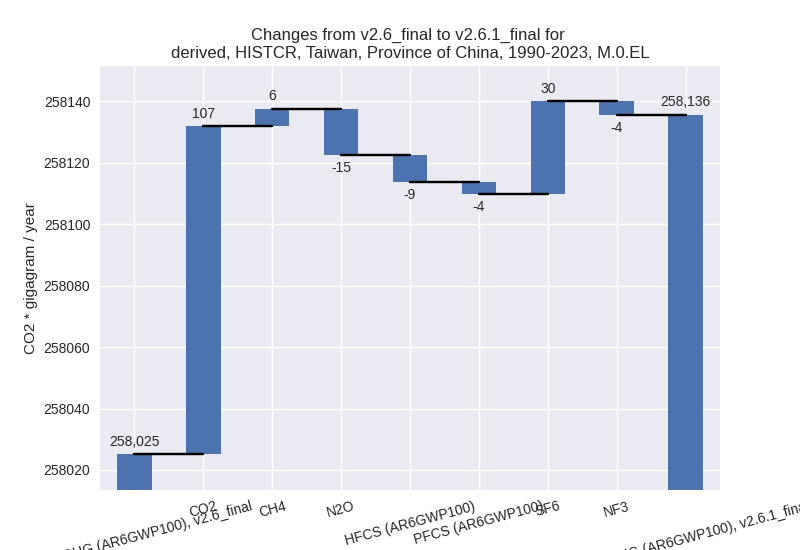
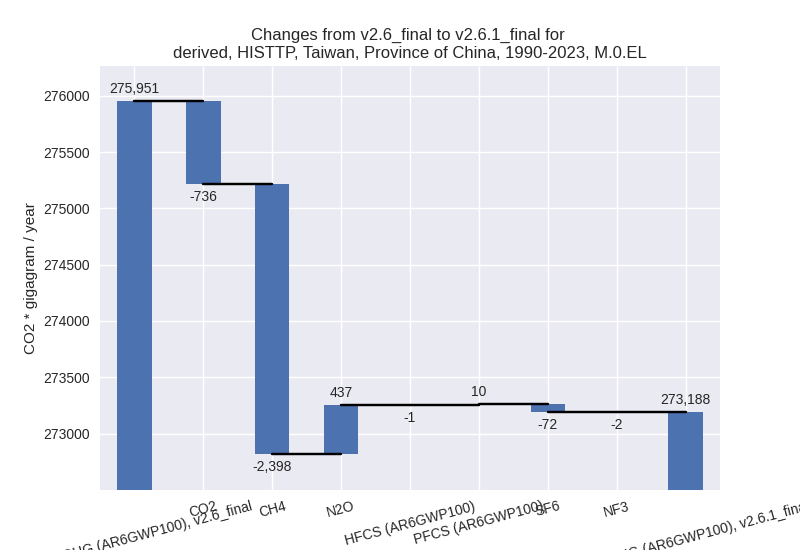
In the country reported priority scenario we have the following changes for aggregate Kyoto GHG and national total emissions excluding LULUCF (M.0.EL):
- Emissions in 2023 have changed by 0.2%% (632.96 Gg CO2 / year)
- Emissions in 1990-2023 have changed by 0.0%% (110.50 Gg CO2 / year)
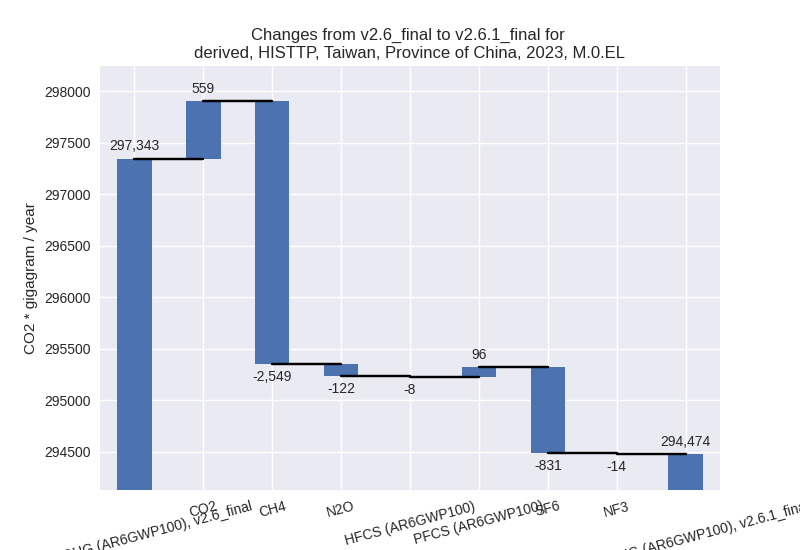
In the third party priority scenario we have the following changes for aggregate Kyoto GHG and national total emissions excluding LULUCF (M.0.EL):
- Emissions in 2023 have changed by -1.0%% (-2868.98 Gg CO2 / year)
- Emissions in 1990-2023 have changed by -1.0%% (-2762.85 Gg CO2 / year)
Most important changes per scenario and time frame
In the country reported priority scenario the following sector-gas combinations have the highest absolute impact on national total KyotoGHG (AR6GWP100) emissions in 2023 (top 5):
- 1: 2, SF6 with 636.92 Gg CO2 / year (131.2%)
- 2: 1.B.2, CO2 with 602.18 Gg CO2 / year (2252245.2%)
- 3: 2, HFCS (AR6GWP100) with -204.18 Gg CO2 / year (-14.3%)
- 4: 4, CH4 with 153.23 Gg CO2 / year (8.4%)
- 5: 2, CO2 with -150.88 Gg CO2 / year (-1.1%)
In the country reported priority scenario the following sector-gas combinations have the highest absolute impact on national total KyotoGHG (AR6GWP100) emissions in 1990-2023 (top 5):
- 1: 1.B.2, CO2 with 287.28 Gg CO2 / year (258159.2%)
- 2: 1.B.1, CO2 with -172.37 Gg CO2 / year (-15.7%)
- 3: 2, SF6 with 30.32 Gg CO2 / year (1.8%)
- 4: 5, N2O with -16.40 Gg CO2 / year (-1.9%)
- 5: 2, HFCS (AR6GWP100) with -8.68 Gg CO2 / year (-0.6%)
In the third party priority scenario the following sector-gas combinations have the highest absolute impact on national total KyotoGHG (AR6GWP100) emissions in 2023 (top 5):
- 1: 4, CH4 with -2777.70 Gg CO2 / year (-20.4%)
- 2: 2, SF6 with -831.28 Gg CO2 / year (-10.9%)
- 3: 1.B.2, CO2 with 602.18 Gg CO2 / year (2252245.2%)
- 4: 1.B.1, CH4 with 134.46 Gg CO2 / year (63.6%)
- 5: 5, N2O with -118.65 Gg CO2 / year (-17.0%)
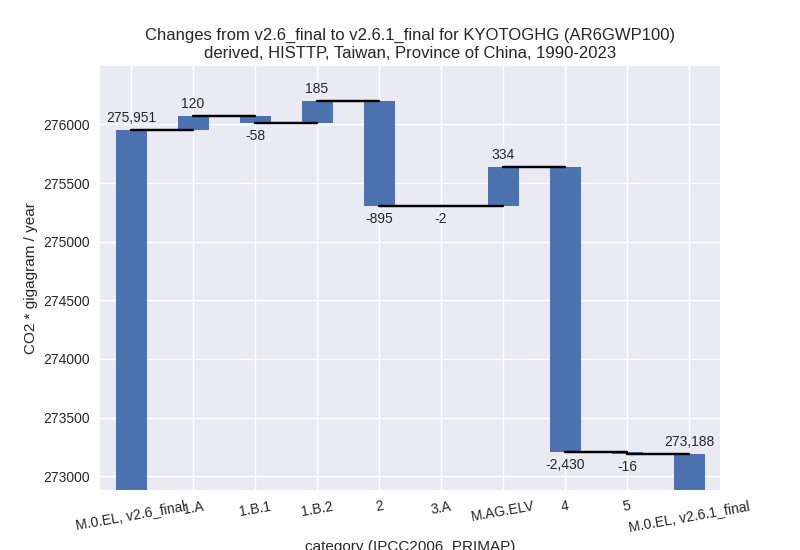
In the third party priority scenario the following sector-gas combinations have the highest absolute impact on national total KyotoGHG (AR6GWP100) emissions in 1990-2023 (top 5):
- 1: 4, CH4 with -2430.36 Gg CO2 / year (-22.6%)
- 2: 2, CO2 with -826.09 Gg CO2 / year (-4.3%)
- 3: M.AG.ELV, N2O with 352.67 Gg CO2 / year (26.4%)
- 4: 1.B.2, CO2 with 287.28 Gg CO2 / year (258159.2%)
- 5: 1.B.1, CO2 with -172.37 Gg CO2 / year (-15.7%)
Notes on data changes
Here we list notes explaining important emissions changes for the country.
- No new country reported data has been included
- The high relative change in SF6 emissions comes from EDGAR data which shows increasing emissions and replaces numerical extrapolation which continued the downward trend in emissions. For HFCs the situation is similar, but with decreasing EDGAR emissions replacing a slightly increasing trend.
- For 1.B.2, CH4 there is no country reported data and EDGAR emissions have increased by four orders of magnitude thus the relative change is very high.
- In the TP scenario the changes are for similar sectors with the addition of a high reduction of waste CH4 emissions from EDGAR data.
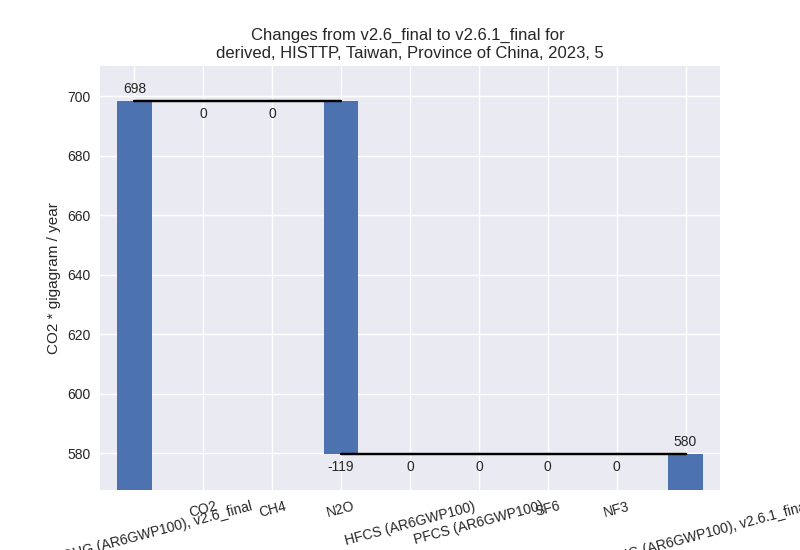
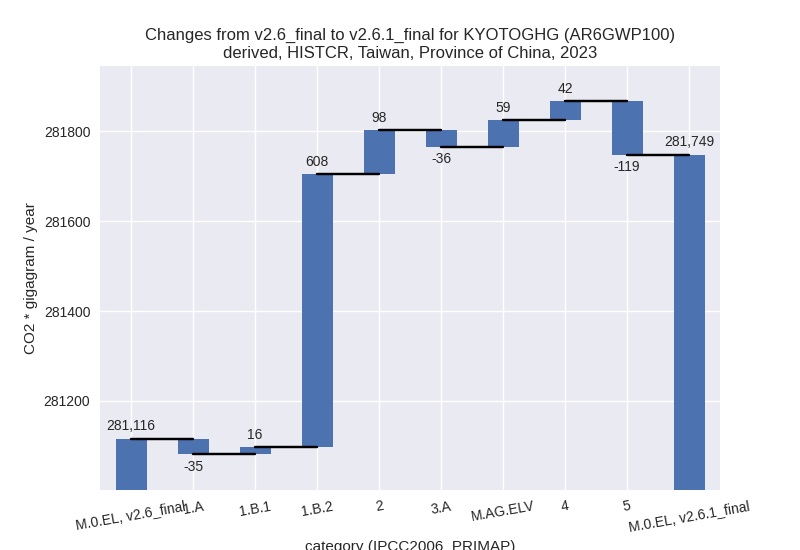
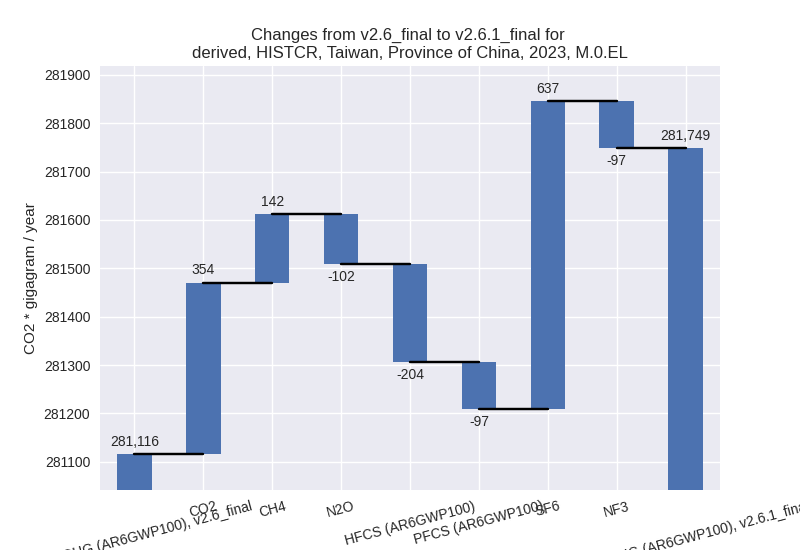
Changes by sector and gas
For each scenario and time frame the changes are displayed for all individual sectors and all individual gases. In the sector plot we use aggregate Kyoto GHGs in AR6GWP100. In the gas plot we usenational total emissions without LULUCF.
country reported scenario
2023
1990-2023
third party scenario
2023
1990-2023
Detailed changes for the scenarios:
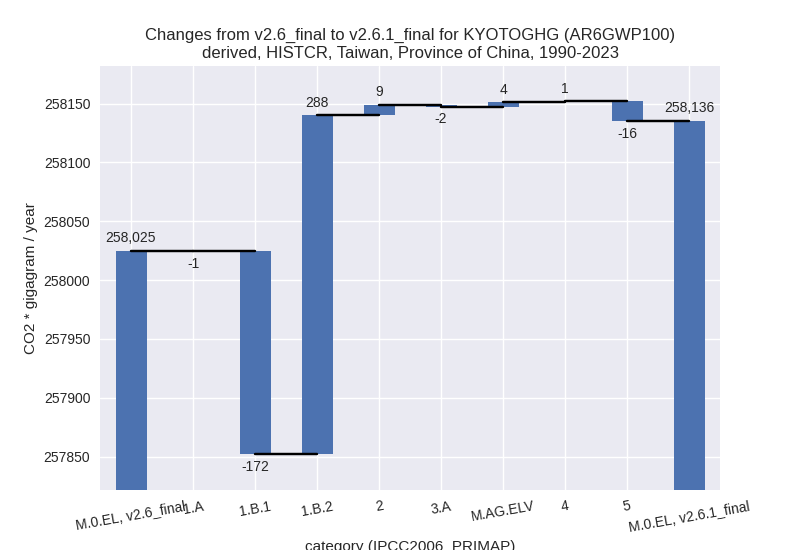
country reported scenario (HISTCR):
Most important changes per time frame
For 2023 the following sector-gas combinations have the highest absolute impact on national total KyotoGHG (AR6GWP100) emissions in 2023 (top 5):
- 1: 2, SF6 with 636.92 Gg CO2 / year (131.2%)
- 2: 1.B.2, CO2 with 602.18 Gg CO2 / year (2252245.2%)
- 3: 2, HFCS (AR6GWP100) with -204.18 Gg CO2 / year (-14.3%)
- 4: 4, CH4 with 153.23 Gg CO2 / year (8.4%)
- 5: 2, CO2 with -150.88 Gg CO2 / year (-1.1%)
For 1990-2023 the following sector-gas combinations have the highest absolute impact on national total KyotoGHG (AR6GWP100) emissions in 1990-2023 (top 5):
- 1: 1.B.2, CO2 with 287.28 Gg CO2 / year (258159.2%)
- 2: 1.B.1, CO2 with -172.37 Gg CO2 / year (-15.7%)
- 3: 2, SF6 with 30.32 Gg CO2 / year (1.8%)
- 4: 5, N2O with -16.40 Gg CO2 / year (-1.9%)
- 5: 2, HFCS (AR6GWP100) with -8.68 Gg CO2 / year (-0.6%)
Changes in the main sectors for aggregate KyotoGHG (AR6GWP100) are
- 1: Total sectoral emissions in 2022 are 262422.68 Gg CO2 / year which is 90.3% of M.0.EL emissions. 2023 Emissions have changed by 0.2% (589.10 Gg CO2 / year). 1990-2023 Emissions have changed by 0.1% (115.09 Gg CO2 / year).
- 2: Total sectoral emissions in 2022 are 21444.20 Gg CO2 / year which is 7.4% of M.0.EL emissions. 2023 Emissions have changed by 0.5% (97.53 Gg CO2 / year). 1990-2023 Emissions have changed by 0.0% (9.04 Gg CO2 / year).
- M.AG: Total sectoral emissions in 2022 are 3338.86 Gg CO2 / year which is 1.1% of M.0.EL emissions. 2023 Emissions have changed by 0.7% (22.98 Gg CO2 / year). 1990-2023 Emissions have changed by 0.0% (1.98 Gg CO2 / year).
- 4: Total sectoral emissions in 2022 are 2860.21 Gg CO2 / year which is 1.0% of M.0.EL emissions. 2023 Emissions have changed by 1.5% (41.99 Gg CO2 / year). 1990-2023 Emissions have changed by 0.0% (0.80 Gg CO2 / year).
- 5: Total sectoral emissions in 2022 are 603.51 Gg
CO2 / year which is 0.2% of M.0.EL emissions. 2023 Emissions have
changed by -17.0% (-118.65 Gg CO2 /
year). 1990-2023 Emissions have changed by -1.9% (-16.40 Gg CO2 / year). For 2023 the
changes per gas
are:

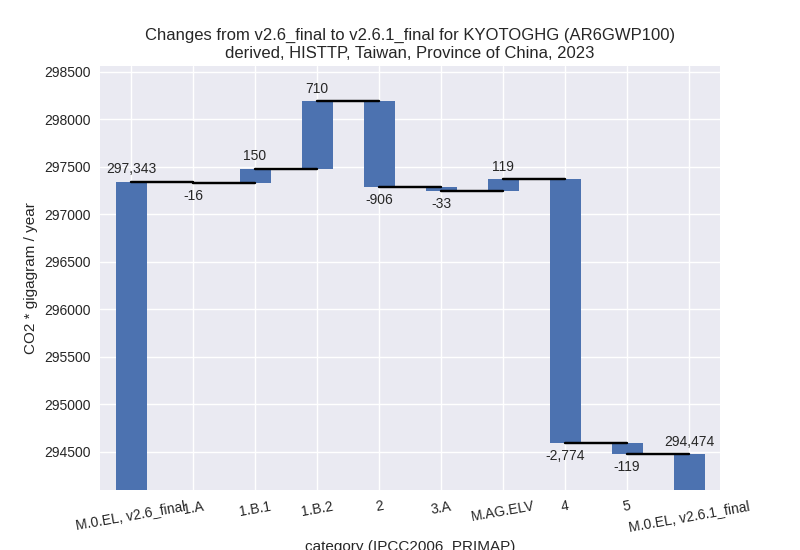
third party scenario (HISTTP):
Most important changes per time frame
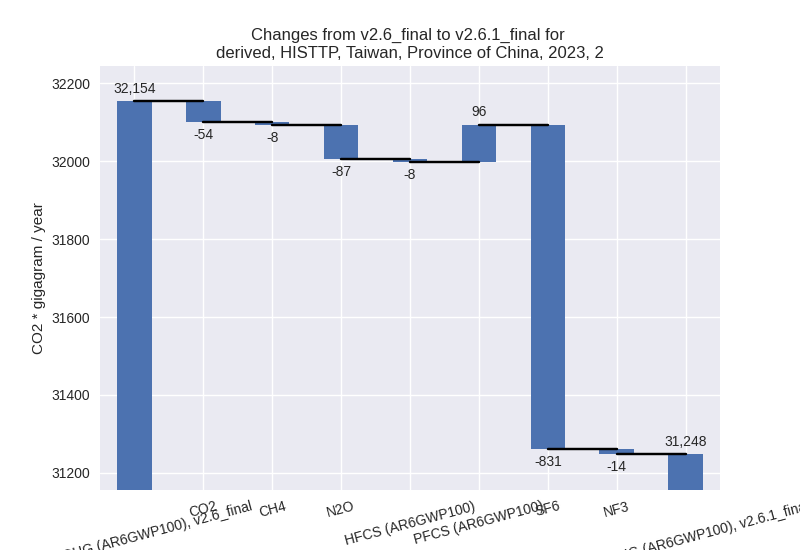
For 2023 the following sector-gas combinations have the highest absolute impact on national total KyotoGHG (AR6GWP100) emissions in 2023 (top 5):
- 1: 4, CH4 with -2777.70 Gg CO2 / year (-20.4%)
- 2: 2, SF6 with -831.28 Gg CO2 / year (-10.9%)
- 3: 1.B.2, CO2 with 602.18 Gg CO2 / year (2252245.2%)
- 4: 1.B.1, CH4 with 134.46 Gg CO2 / year (63.6%)
- 5: 5, N2O with -118.65 Gg CO2 / year (-17.0%)
For 1990-2023 the following sector-gas combinations have the highest absolute impact on national total KyotoGHG (AR6GWP100) emissions in 1990-2023 (top 5):
- 1: 4, CH4 with -2430.36 Gg CO2 / year (-22.6%)
- 2: 2, CO2 with -826.09 Gg CO2 / year (-4.3%)
- 3: M.AG.ELV, N2O with 352.67 Gg CO2 / year (26.4%)
- 4: 1.B.2, CO2 with 287.28 Gg CO2 / year (258159.2%)
- 5: 1.B.1, CO2 with -172.37 Gg CO2 / year (-15.7%)
Changes in the main sectors for aggregate KyotoGHG (AR6GWP100) are
- 1: Total sectoral emissions in 2022 are 254827.79 Gg CO2 / year which is 84.1% of M.0.EL emissions. 2023 Emissions have changed by 0.3% (844.32 Gg CO2 / year). 1990-2023 Emissions have changed by 0.1% (246.63 Gg CO2 / year).
- 2: Total sectoral emissions in 2022 are 31921.51 Gg
CO2 / year which is 10.5% of M.0.EL emissions. 2023 Emissions have
changed by -2.8% (-905.99 Gg CO2 /
year). 1990-2023 Emissions have changed by -2.5% (-895.38 Gg CO2 / year). For 2023
the changes per gas
are:
For 1990-2023 the changes per gas are: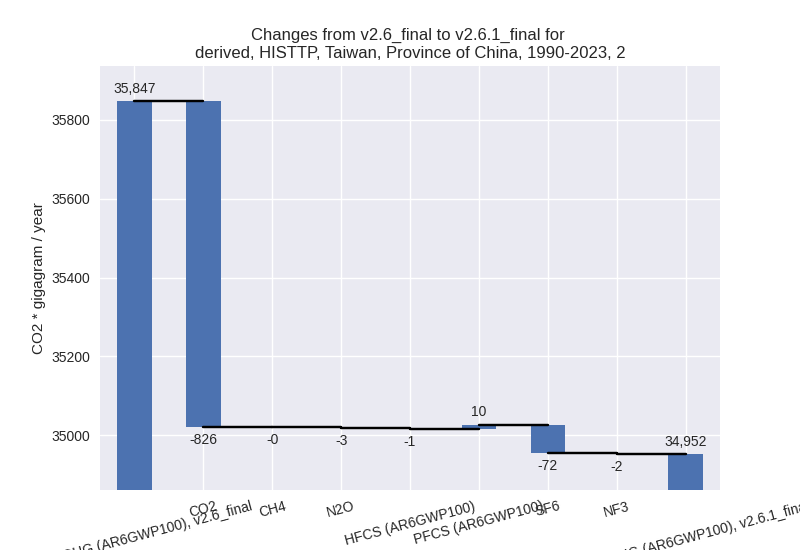
- M.AG: Total sectoral emissions in 2022 are 4213.43
Gg CO2 / year which is 1.4% of M.0.EL emissions. 2023 Emissions have
changed by 2.1% (85.57 Gg CO2 /
year). 1990-2023 Emissions have changed by 6.5% (332.31 Gg CO2 / year). For 2023 the
changes per gas
are:

For 1990-2023 the changes per gas are: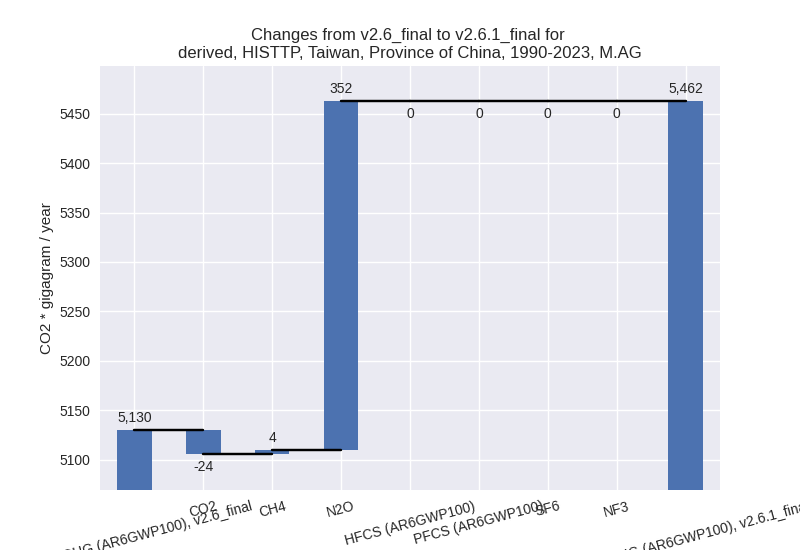
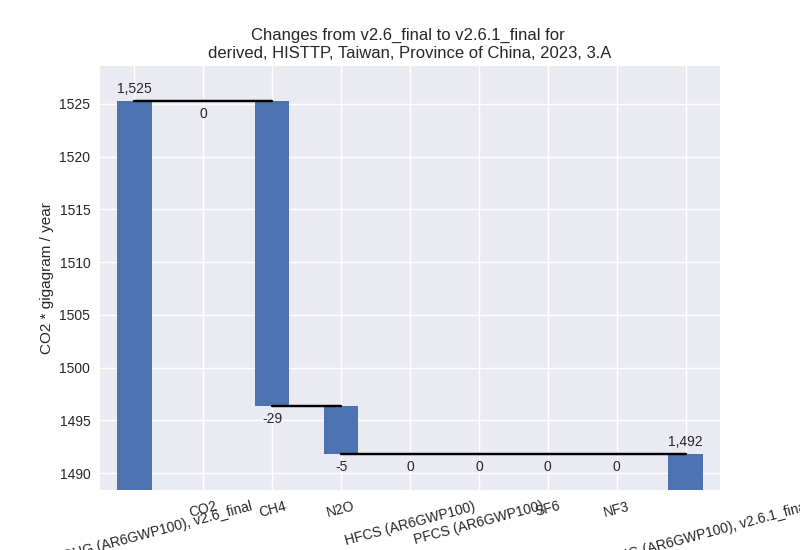
The changes come from the following subsectors:- 3.A: Total sectoral emissions in 2022 are 1491.86
Gg CO2 / year which is 35.4% of category M.AG emissions. 2023 Emissions
have changed by -2.2% (-33.44 Gg CO2
/ year). 1990-2023 Emissions have changed by -0.1% (-1.62 Gg CO2 / year). For 2023 the
changes per gas
are:
There is no subsector information available in PRIMAP-hist. - M.AG.ELV: Total sectoral emissions in 2022 are
2721.57 Gg CO2 / year which is 64.6% of category M.AG emissions. 2023
Emissions have changed by 4.7%
(119.01 Gg CO2 / year). 1990-2023 Emissions have changed by 10.1% (333.94 Gg CO2 / year). For 2023 the
changes per gas
are:
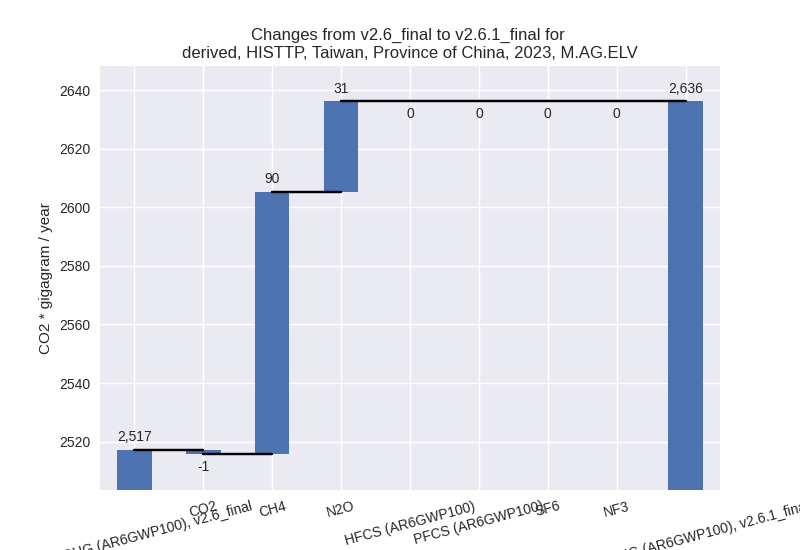
For 1990-2023 the changes per gas are: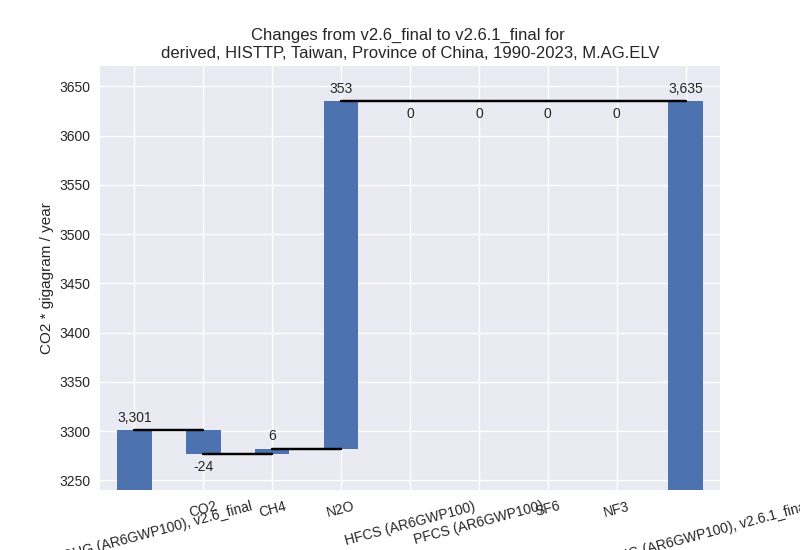
There is no subsector information available in PRIMAP-hist.
- 3.A: Total sectoral emissions in 2022 are 1491.86
Gg CO2 / year which is 35.4% of category M.AG emissions. 2023 Emissions
have changed by -2.2% (-33.44 Gg CO2
/ year). 1990-2023 Emissions have changed by -0.1% (-1.62 Gg CO2 / year). For 2023 the
changes per gas
are:
- 4: Total sectoral emissions in 2022 are 11374.73 Gg
CO2 / year which is 3.8% of M.0.EL emissions. 2023 Emissions have
changed by -19.8% (-2774.23 Gg CO2 /
year). 1990-2023 Emissions have changed by -21.8% (-2430.01 Gg CO2 / year). For 2023
the changes per gas
are:

For 1990-2023 the changes per gas are: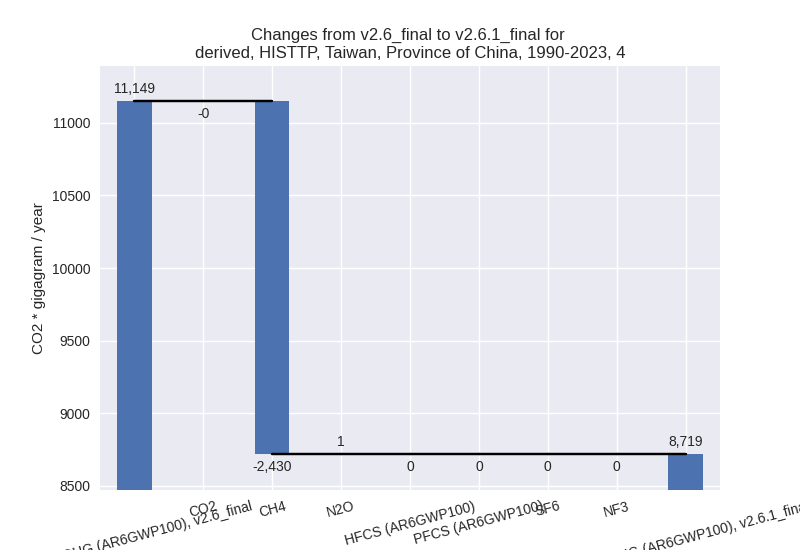
- 5: Total sectoral emissions in 2022 are 603.51 Gg
CO2 / year which is 0.2% of M.0.EL emissions. 2023 Emissions have
changed by -17.0% (-118.65 Gg CO2 /
year). 1990-2023 Emissions have changed by -1.9% (-16.40 Gg CO2 / year). For 2023 the
changes per gas
are: