Changes in PRIMAP-hist v2.6.1_final compared to v2.6_final for Tanzania, United Republic of
2025-03-19
Johannes Gütschow
Change analysis for Tanzania, United Republic of for PRIMAP-hist v2.6.1_final compared to v2.6_final
Overview over emissions by sector and gas
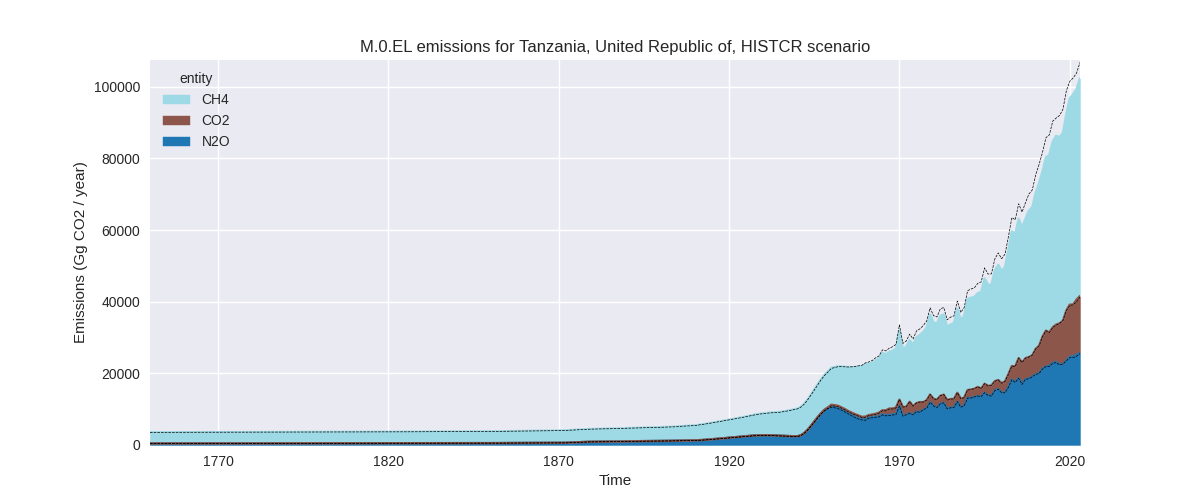
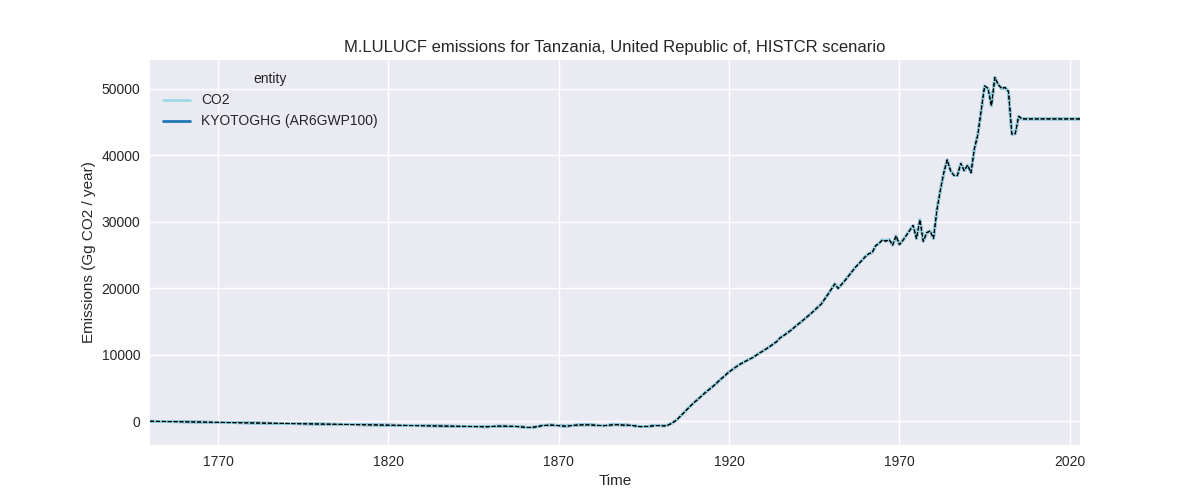
The following figures show the aggregate national total emissions excluding LULUCF AR6GWP100 for the country reported priority scenario. The dotted linesshow the v2.6_final data.

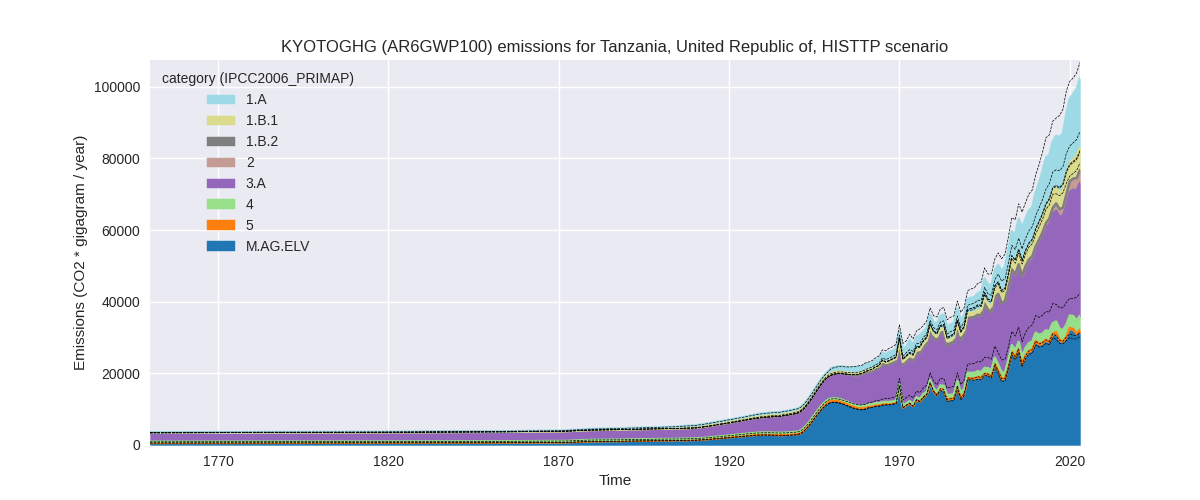
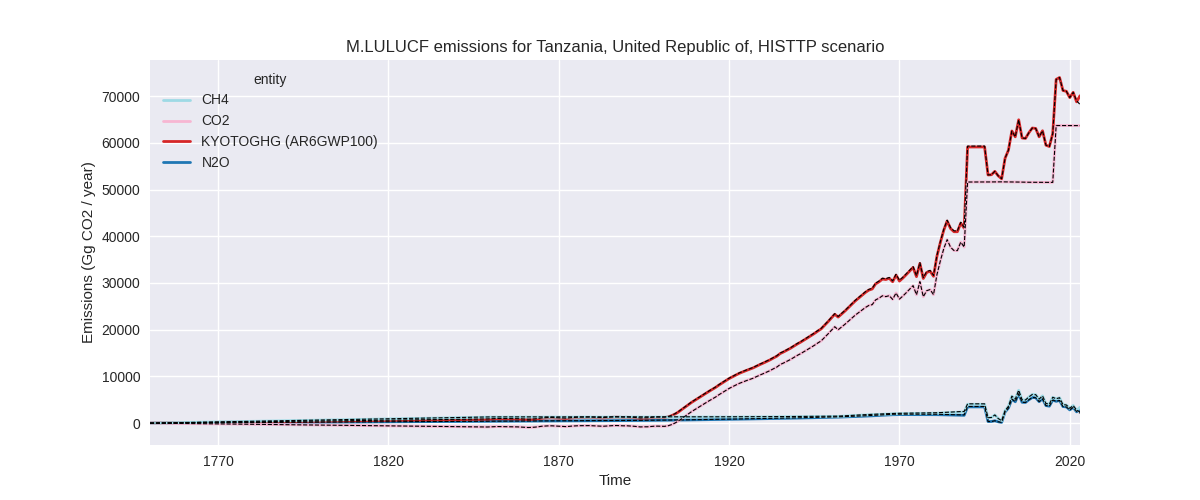
The following figures show the aggregate national total emissions excluding LULUCF AR6GWP100 for the third party priority scenario. The dotted linesshow the v2.6_final data.

Overview over changes
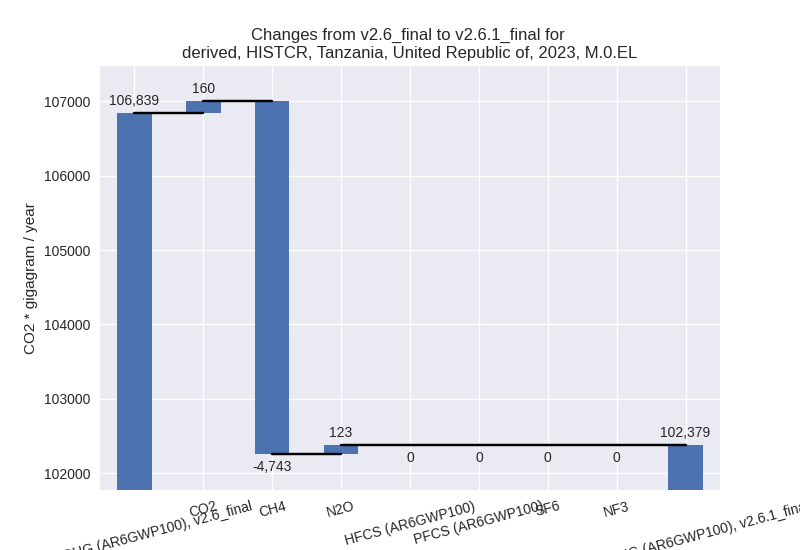
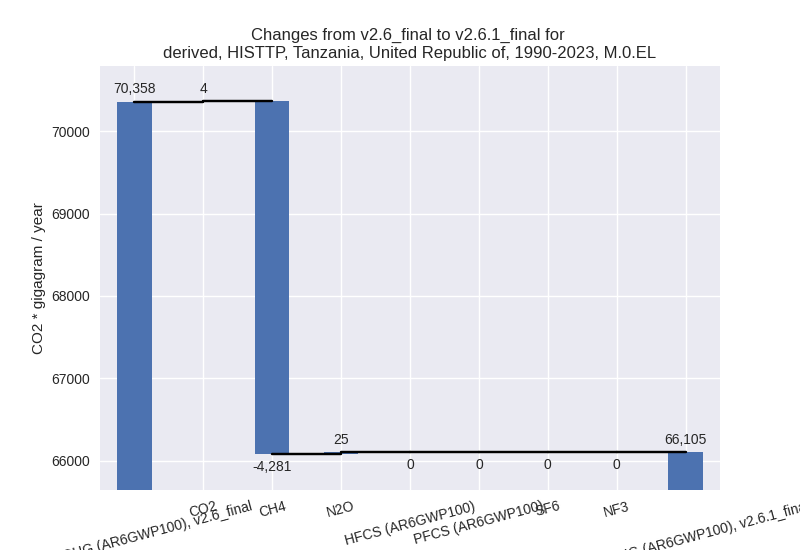
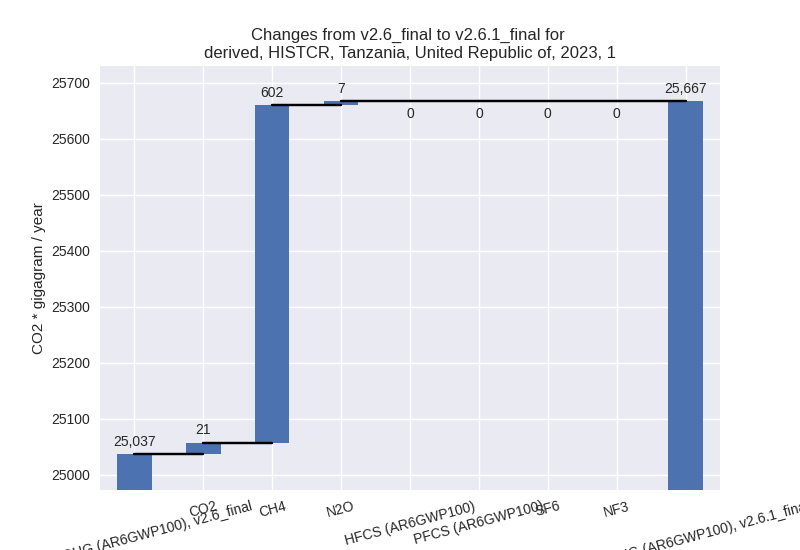
In the country reported priority scenario we have the following changes for aggregate Kyoto GHG and national total emissions excluding LULUCF (M.0.EL):
- Emissions in 2023 have changed by -4.2%% (-4459.90 Gg CO2 / year)
- Emissions in 1990-2023 have changed by -6.0%% (-4252.08 Gg CO2 / year)
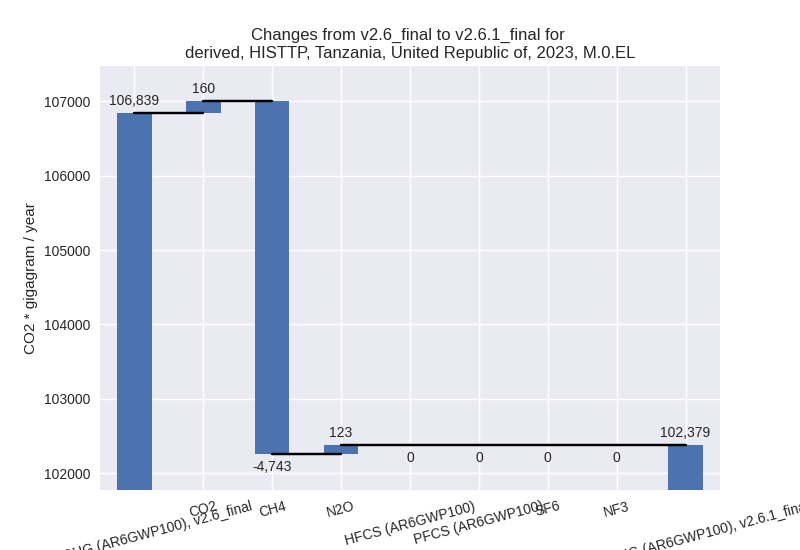
In the third party priority scenario we have the following changes for aggregate Kyoto GHG and national total emissions excluding LULUCF (M.0.EL):
- Emissions in 2023 have changed by -4.2%% (-4459.90 Gg CO2 / year)
- Emissions in 1990-2023 have changed by -6.0%% (-4252.08 Gg CO2 / year)
Most important changes per scenario and time frame
In the country reported priority scenario the following sector-gas combinations have the highest absolute impact on national total KyotoGHG (AR6GWP100) emissions in 2023 (top 5):
- 1: 4, CH4 with -7025.16 Gg CO2 / year (-68.9%)
- 2: M.AG.ELV, CH4 with 935.19 Gg CO2 / year (12.0%)
- 3: 1.B.1, CH4 with 919.21 Gg CO2 / year (17.4%)
- 4: 3.A, CH4 with 744.95 Gg CO2 / year (2.1%)
- 5: 2, CO2 with 396.88 Gg CO2 / year (14.9%)
In the country reported priority scenario the following sector-gas combinations have the highest absolute impact on national total KyotoGHG (AR6GWP100) emissions in 1990-2023 (top 5):
- 1: 4, CH4 with -4439.25 Gg CO2 / year (-70.1%)
- 2: M.AG.ELV, CH4 with 145.45 Gg CO2 / year (1.8%)
- 3: 1.B.2, CH4 with -134.52 Gg CO2 / year (-76.4%)
- 4: 1.B.1, CH4 with 83.93 Gg CO2 / year (2.7%)
- 5: 3.A, CH4 with 55.58 Gg CO2 / year (0.2%)
In the third party priority scenario the following sector-gas combinations have the highest absolute impact on national total KyotoGHG (AR6GWP100) emissions in 2023 (top 5):
- 1: 4, CH4 with -7025.16 Gg CO2 / year (-68.9%)
- 2: M.AG.ELV, CH4 with 935.19 Gg CO2 / year (12.0%)
- 3: 1.B.1, CH4 with 919.21 Gg CO2 / year (17.4%)
- 4: 3.A, CH4 with 744.95 Gg CO2 / year (2.1%)
- 5: 2, CO2 with 396.88 Gg CO2 / year (14.9%)
In the third party priority scenario the following sector-gas combinations have the highest absolute impact on national total KyotoGHG (AR6GWP100) emissions in 1990-2023 (top 5):
- 1: 4, CH4 with -4439.25 Gg CO2 / year (-70.1%)
- 2: M.AG.ELV, CH4 with 145.45 Gg CO2 / year (1.8%)
- 3: 1.B.2, CH4 with -134.52 Gg CO2 / year (-76.4%)
- 4: 1.B.1, CH4 with 83.93 Gg CO2 / year (2.7%)
- 5: 3.A, CH4 with 55.58 Gg CO2 / year (0.2%)
Notes on data changes
Here we list notes explaining important emissions changes for the country.
- There is no usable country reported data for Tanzania, thus the CR and TP time-series are identical.
- The by far most important change - a 70% reduction of waste CH4 emissions comes directly from the new EDGAR data.
- Further changes in the TP time-series come from updated EDGAR and FAO data. FAO has adjusted data for the latest years while EDGAR has updated full time-series with the main change coming from the waste sector.
Changes by sector and gas
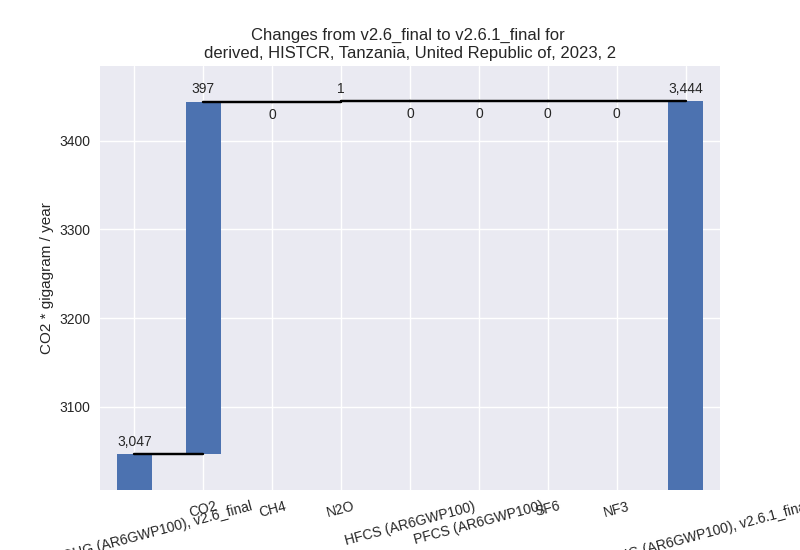
For each scenario and time frame the changes are displayed for all individual sectors and all individual gases. In the sector plot we use aggregate Kyoto GHGs in AR6GWP100. In the gas plot we usenational total emissions without LULUCF.
country reported scenario
2023
1990-2023

third party scenario
2023

1990-2023

Detailed changes for the scenarios:
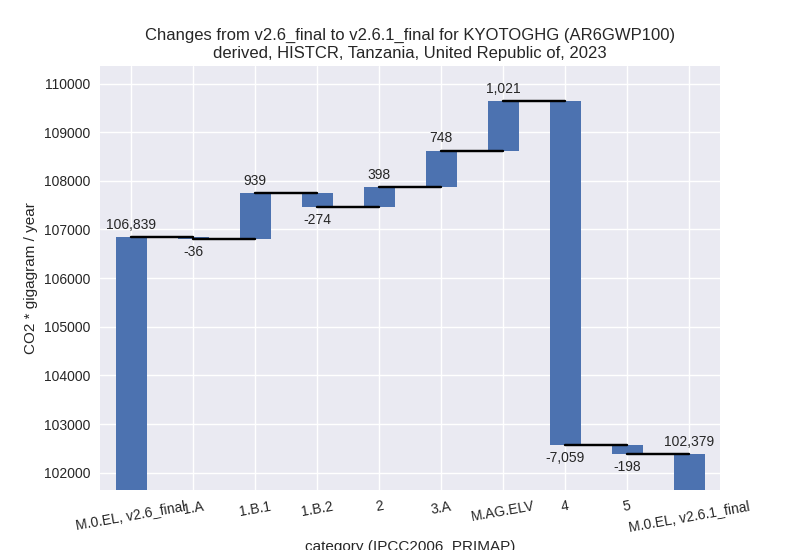
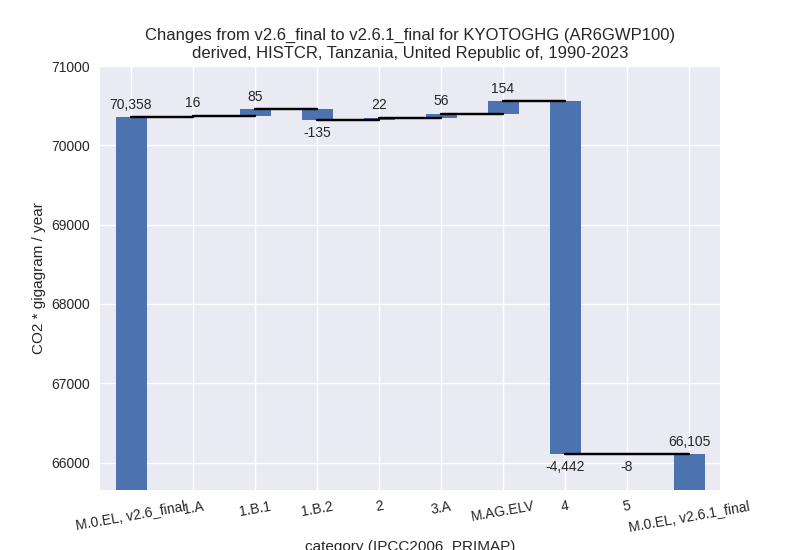
country reported scenario (HISTCR):
Most important changes per time frame
For 2023 the following sector-gas combinations have the highest absolute impact on national total KyotoGHG (AR6GWP100) emissions in 2023 (top 5):
- 1: 4, CH4 with -7025.16 Gg CO2 / year (-68.9%)
- 2: M.AG.ELV, CH4 with 935.19 Gg CO2 / year (12.0%)
- 3: 1.B.1, CH4 with 919.21 Gg CO2 / year (17.4%)
- 4: 3.A, CH4 with 744.95 Gg CO2 / year (2.1%)
- 5: 2, CO2 with 396.88 Gg CO2 / year (14.9%)
For 1990-2023 the following sector-gas combinations have the highest absolute impact on national total KyotoGHG (AR6GWP100) emissions in 1990-2023 (top 5):
- 1: 4, CH4 with -4439.25 Gg CO2 / year (-70.1%)
- 2: M.AG.ELV, CH4 with 145.45 Gg CO2 / year (1.8%)
- 3: 1.B.2, CH4 with -134.52 Gg CO2 / year (-76.4%)
- 4: 1.B.1, CH4 with 83.93 Gg CO2 / year (2.7%)
- 5: 3.A, CH4 with 55.58 Gg CO2 / year (0.2%)
Changes in the main sectors for aggregate KyotoGHG (AR6GWP100) are
- 1: Total sectoral emissions in 2022 are 25004.19 Gg
CO2 / year which is 25.2% of M.0.EL emissions. 2023 Emissions have
changed by 2.5% (629.55 Gg CO2 /
year). 1990-2023 Emissions have changed by -0.2% (-33.40 Gg CO2 / year). For 2023 the
changes per gas
are:
The changes come from the following subsectors:- 1.A: Total sectoral emissions in 2022 are 18753.21 Gg CO2 / year which is 75.0% of category 1 emissions. 2023 Emissions have changed by -0.2% (-35.83 Gg CO2 / year). 1990-2023 Emissions have changed by 0.2% (15.94 Gg CO2 / year).
- 1.B.1: Total sectoral emissions in 2022 are 6135.77
Gg CO2 / year which is 24.5% of category 1 emissions. 2023 Emissions
have changed by 17.5% (939.47 Gg CO2
/ year). 1990-2023 Emissions have changed by 2.7% (85.17 Gg CO2 / year). For 2023 the
changes per gas
are:

For 1990-2023 the changes per gas are: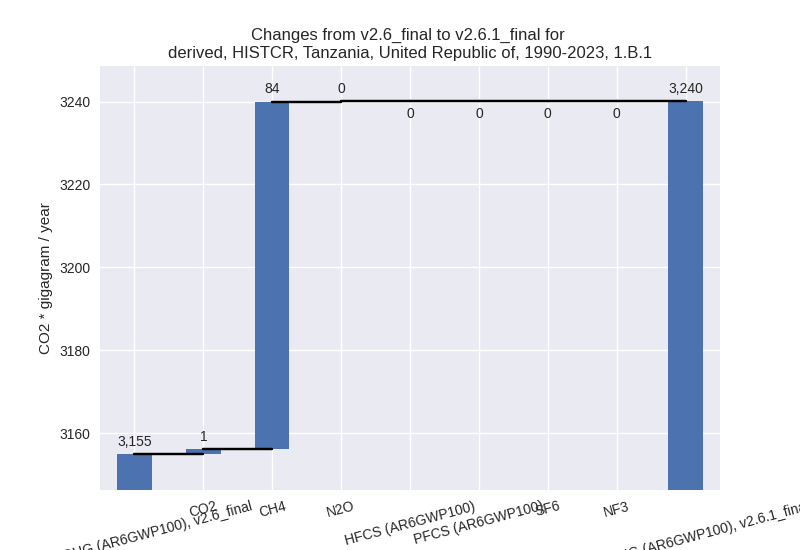
There is no subsector information available in PRIMAP-hist. - 1.B.2: Total sectoral emissions in 2022 are 115.20
Gg CO2 / year which is 0.5% of category 1 emissions. 2023 Emissions have
changed by -69.6% (-274.08 Gg CO2 /
year). 1990-2023 Emissions have changed by -75.4% (-134.50 Gg CO2 / year). For 2023
the changes per gas
are:

For 1990-2023 the changes per gas are:
There is no subsector information available in PRIMAP-hist.
- 2: Total sectoral emissions in 2022 are 3429.60 Gg
CO2 / year which is 3.5% of M.0.EL emissions. 2023 Emissions have
changed by 13.1% (397.63 Gg CO2 /
year). 1990-2023 Emissions have changed by 1.7% (21.51 Gg CO2 / year). For 2023 the
changes per gas
are:
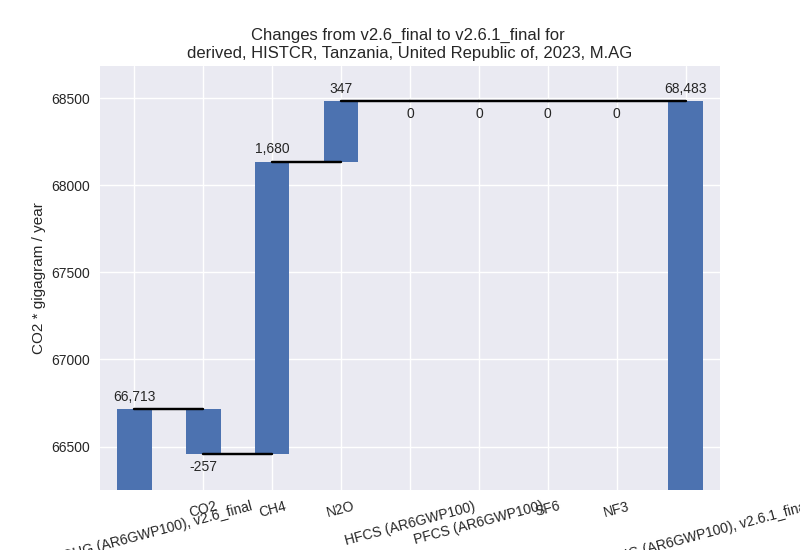
- M.AG: Total sectoral emissions in 2022 are 66204.23
Gg CO2 / year which is 66.6% of M.0.EL emissions. 2023 Emissions have
changed by 2.7% (1769.73 Gg CO2 /
year). 1990-2023 Emissions have changed by 0.4% (210.09 Gg CO2 / year). For 2023 the
changes per gas
are:
The changes come from the following subsectors:- 3.A: Total sectoral emissions in 2022 are 36182.41
Gg CO2 / year which is 54.7% of category M.AG emissions. 2023 Emissions
have changed by 2.1% (748.46 Gg CO2
/ year). 1990-2023 Emissions have changed by 0.2% (55.80 Gg CO2 / year). For 2023 the
changes per gas
are:

There is no subsector information available in PRIMAP-hist. - M.AG.ELV: Total sectoral emissions in 2022 are
30021.82 Gg CO2 / year which is 45.3% of category M.AG emissions. 2023
Emissions have changed by 3.4%
(1021.28 Gg CO2 / year). 1990-2023 Emissions have changed by 0.6% (154.29 Gg CO2 / year). For 2023 the
changes per gas
are:

There is no subsector information available in PRIMAP-hist.
- 3.A: Total sectoral emissions in 2022 are 36182.41
Gg CO2 / year which is 54.7% of category M.AG emissions. 2023 Emissions
have changed by 2.1% (748.46 Gg CO2
/ year). 1990-2023 Emissions have changed by 0.2% (55.80 Gg CO2 / year). For 2023 the
changes per gas
are:
- 4: Total sectoral emissions in 2022 are 3736.20 Gg
CO2 / year which is 3.8% of M.0.EL emissions. 2023 Emissions have
changed by -64.6% (-7059.06 Gg CO2 /
year). 1990-2023 Emissions have changed by -65.7% (-4442.29 Gg CO2 / year). For 2023
the changes per gas
are:

For 1990-2023 the changes per gas are:
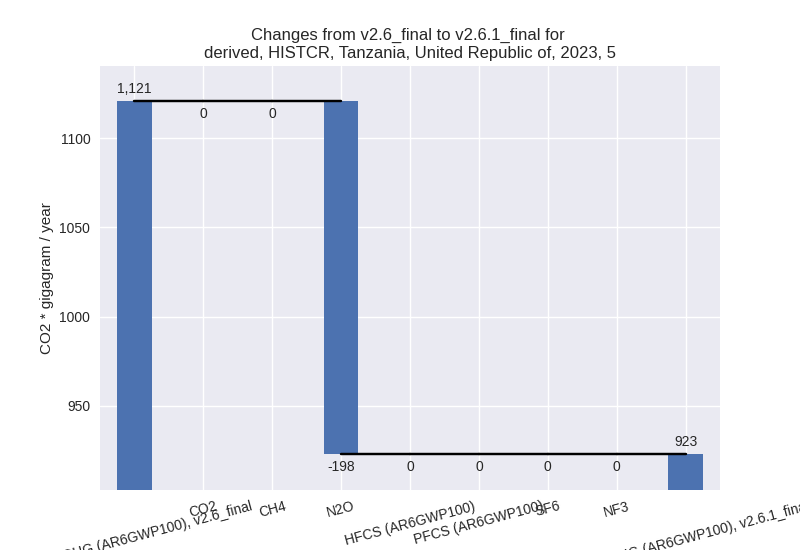
- 5: Total sectoral emissions in 2022 are 1004.15 Gg
CO2 / year which is 1.0% of M.0.EL emissions. 2023 Emissions have
changed by -17.6% (-197.75 Gg CO2 /
year). 1990-2023 Emissions have changed by -1.0% (-7.99 Gg CO2 / year). For 2023 the
changes per gas
are:
third party scenario (HISTTP):
Most important changes per time frame
For 2023 the following sector-gas combinations have the highest absolute impact on national total KyotoGHG (AR6GWP100) emissions in 2023 (top 5):
- 1: 4, CH4 with -7025.16 Gg CO2 / year (-68.9%)
- 2: M.AG.ELV, CH4 with 935.19 Gg CO2 / year (12.0%)
- 3: 1.B.1, CH4 with 919.21 Gg CO2 / year (17.4%)
- 4: 3.A, CH4 with 744.95 Gg CO2 / year (2.1%)
- 5: 2, CO2 with 396.88 Gg CO2 / year (14.9%)
For 1990-2023 the following sector-gas combinations have the highest absolute impact on national total KyotoGHG (AR6GWP100) emissions in 1990-2023 (top 5):
- 1: 4, CH4 with -4439.25 Gg CO2 / year (-70.1%)
- 2: M.AG.ELV, CH4 with 145.45 Gg CO2 / year (1.8%)
- 3: 1.B.2, CH4 with -134.52 Gg CO2 / year (-76.4%)
- 4: 1.B.1, CH4 with 83.93 Gg CO2 / year (2.7%)
- 5: 3.A, CH4 with 55.58 Gg CO2 / year (0.2%)
Changes in the main sectors for aggregate KyotoGHG (AR6GWP100) are
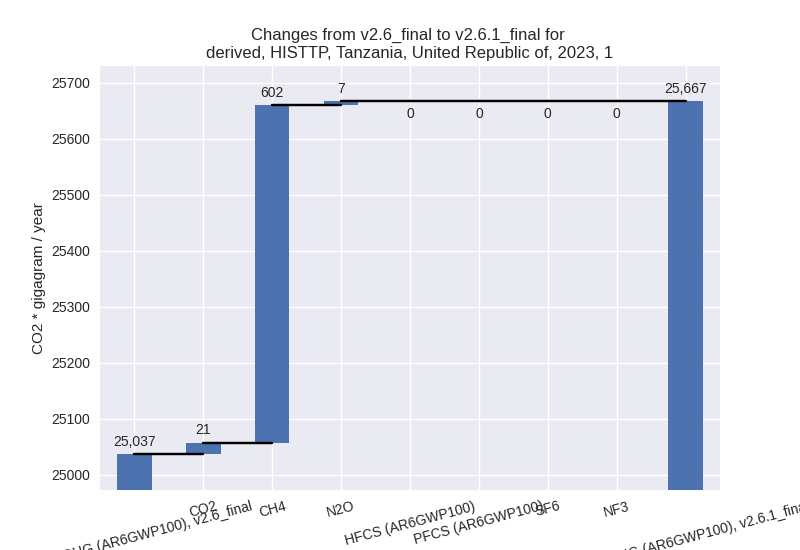
- 1: Total sectoral emissions in 2022 are 25004.19 Gg
CO2 / year which is 25.2% of M.0.EL emissions. 2023 Emissions have
changed by 2.5% (629.55 Gg CO2 /
year). 1990-2023 Emissions have changed by -0.2% (-33.40 Gg CO2 / year). For 2023 the
changes per gas
are:
The changes come from the following subsectors:- 1.A: Total sectoral emissions in 2022 are 18753.21 Gg CO2 / year which is 75.0% of category 1 emissions. 2023 Emissions have changed by -0.2% (-35.83 Gg CO2 / year). 1990-2023 Emissions have changed by 0.2% (15.94 Gg CO2 / year).
- 1.B.1: Total sectoral emissions in 2022 are 6135.77
Gg CO2 / year which is 24.5% of category 1 emissions. 2023 Emissions
have changed by 17.5% (939.47 Gg CO2
/ year). 1990-2023 Emissions have changed by 2.7% (85.17 Gg CO2 / year). For 2023 the
changes per gas
are:

For 1990-2023 the changes per gas are:
There is no subsector information available in PRIMAP-hist. - 1.B.2: Total sectoral emissions in 2022 are 115.20
Gg CO2 / year which is 0.5% of category 1 emissions. 2023 Emissions have
changed by -69.6% (-274.08 Gg CO2 /
year). 1990-2023 Emissions have changed by -75.4% (-134.50 Gg CO2 / year). For 2023
the changes per gas
are:

For 1990-2023 the changes per gas are:
There is no subsector information available in PRIMAP-hist.
- 2: Total sectoral emissions in 2022 are 3429.60 Gg
CO2 / year which is 3.5% of M.0.EL emissions. 2023 Emissions have
changed by 13.1% (397.63 Gg CO2 /
year). 1990-2023 Emissions have changed by 1.7% (21.51 Gg CO2 / year). For 2023 the
changes per gas
are:

- M.AG: Total sectoral emissions in 2022 are 66204.23
Gg CO2 / year which is 66.6% of M.0.EL emissions. 2023 Emissions have
changed by 2.7% (1769.73 Gg CO2 /
year). 1990-2023 Emissions have changed by 0.4% (210.09 Gg CO2 / year). For 2023 the
changes per gas
are:

The changes come from the following subsectors:- 3.A: Total sectoral emissions in 2022 are 36182.41
Gg CO2 / year which is 54.7% of category M.AG emissions. 2023 Emissions
have changed by 2.1% (748.46 Gg CO2
/ year). 1990-2023 Emissions have changed by 0.2% (55.80 Gg CO2 / year). For 2023 the
changes per gas
are:

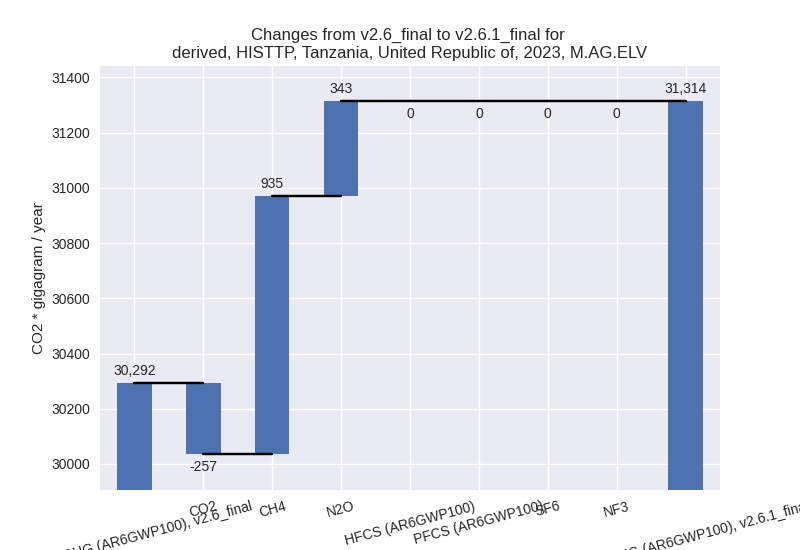
There is no subsector information available in PRIMAP-hist. - M.AG.ELV: Total sectoral emissions in 2022 are
30021.82 Gg CO2 / year which is 45.3% of category M.AG emissions. 2023
Emissions have changed by 3.4%
(1021.28 Gg CO2 / year). 1990-2023 Emissions have changed by 0.6% (154.29 Gg CO2 / year). For 2023 the
changes per gas
are:
There is no subsector information available in PRIMAP-hist.
- 3.A: Total sectoral emissions in 2022 are 36182.41
Gg CO2 / year which is 54.7% of category M.AG emissions. 2023 Emissions
have changed by 2.1% (748.46 Gg CO2
/ year). 1990-2023 Emissions have changed by 0.2% (55.80 Gg CO2 / year). For 2023 the
changes per gas
are:
- 4: Total sectoral emissions in 2022 are 3736.20 Gg
CO2 / year which is 3.8% of M.0.EL emissions. 2023 Emissions have
changed by -64.6% (-7059.06 Gg CO2 /
year). 1990-2023 Emissions have changed by -65.7% (-4442.29 Gg CO2 / year). For 2023
the changes per gas
are:

For 1990-2023 the changes per gas are:
- 5: Total sectoral emissions in 2022 are 1004.15 Gg
CO2 / year which is 1.0% of M.0.EL emissions. 2023 Emissions have
changed by -17.6% (-197.75 Gg CO2 /
year). 1990-2023 Emissions have changed by -1.0% (-7.99 Gg CO2 / year). For 2023 the
changes per gas
are:
