Changes in PRIMAP-hist v2.6.1_final compared to v2.6_final for Ukraine
2025-03-19
Johannes Gütschow
Change analysis for Ukraine for PRIMAP-hist v2.6.1_final compared to v2.6_final
Overview over emissions by sector and gas
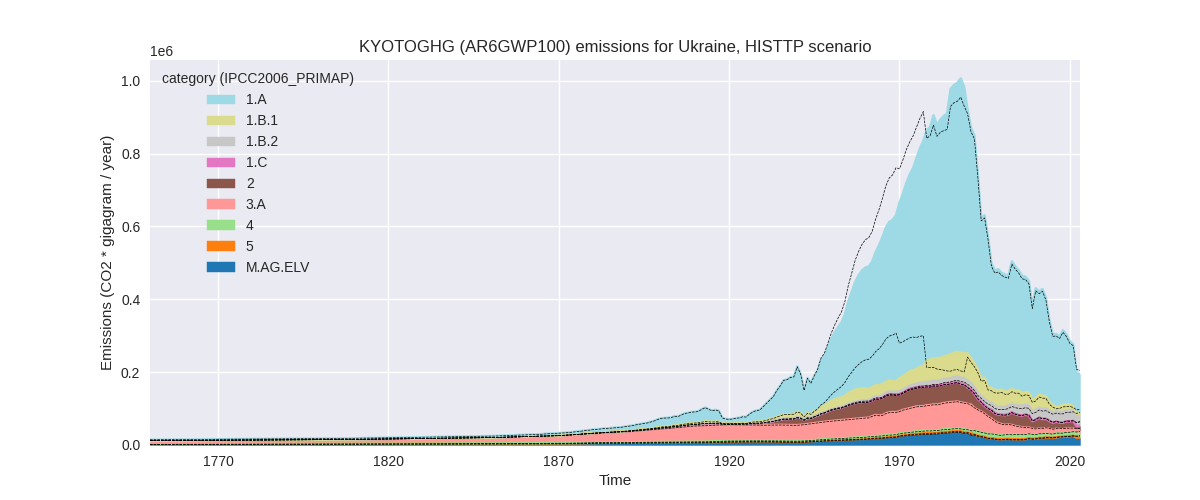
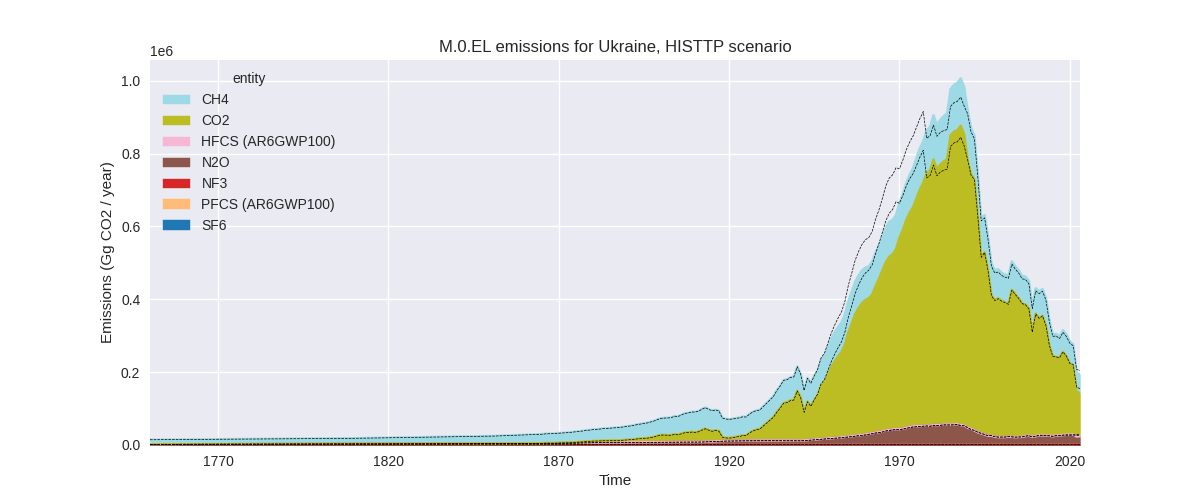
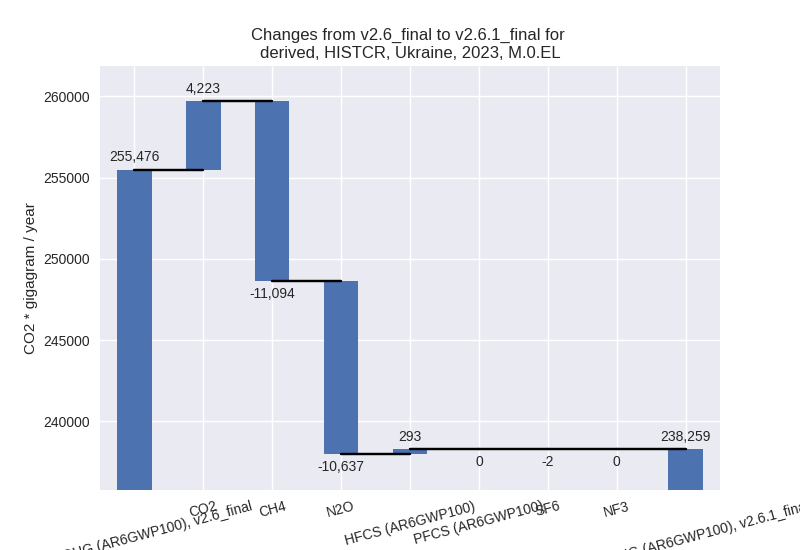
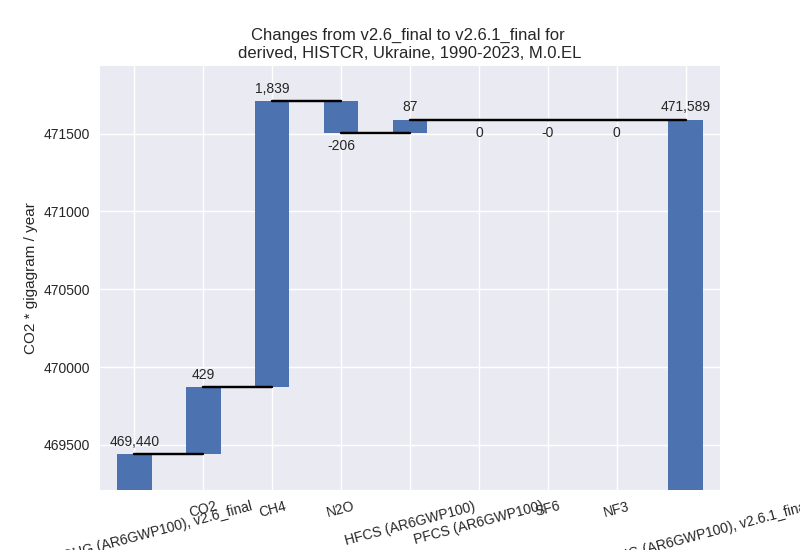
The following figures show the aggregate national total emissions excluding LULUCF AR6GWP100 for the country reported priority scenario. The dotted linesshow the v2.6_final data.
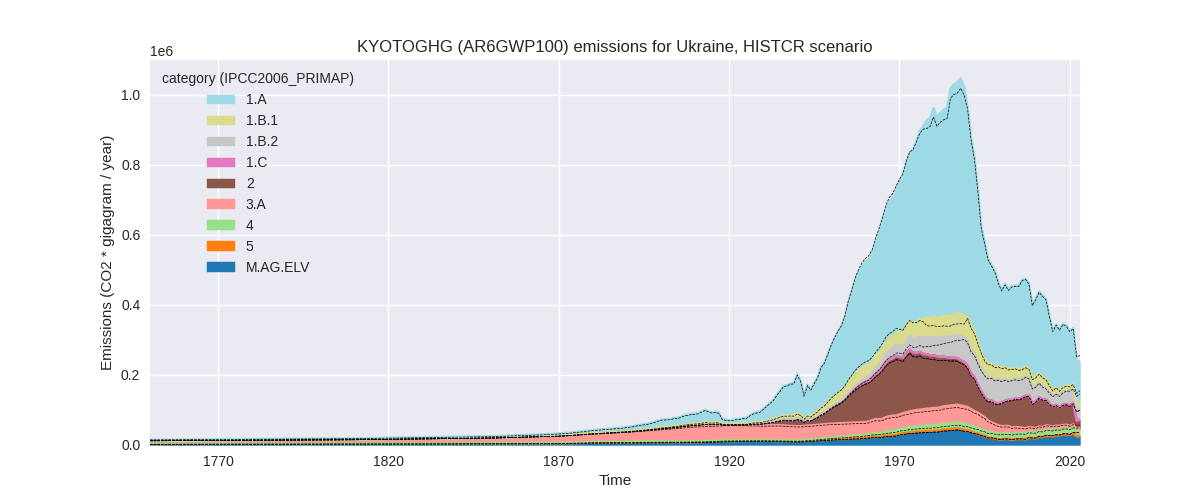
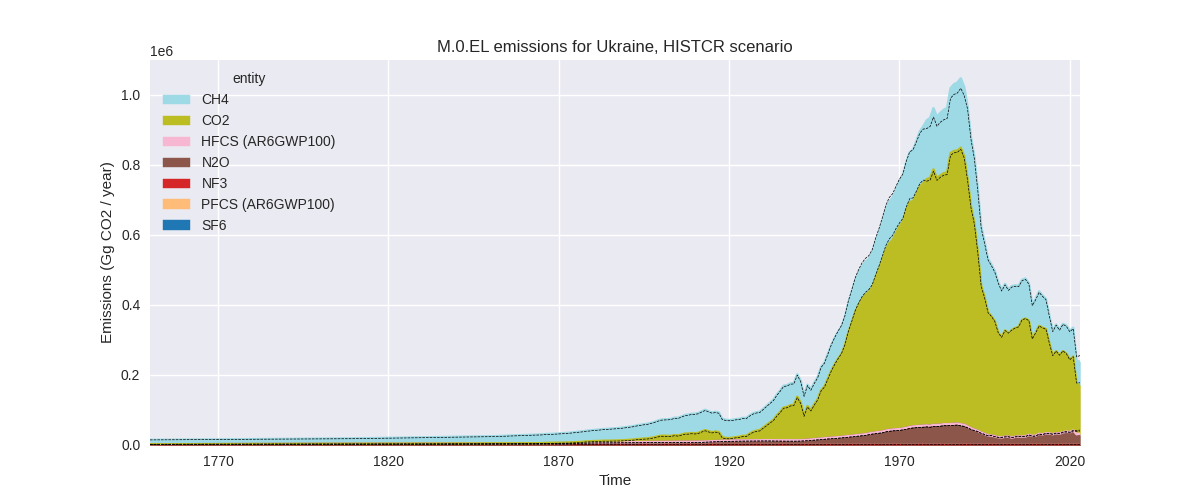
The following figures show the aggregate national total emissions excluding LULUCF AR6GWP100 for the third party priority scenario. The dotted linesshow the v2.6_final data.
Overview over changes
In the country reported priority scenario we have the following changes for aggregate Kyoto GHG and national total emissions excluding LULUCF (M.0.EL):
- Emissions in 2023 have changed by -6.7%% (-17216.41 Gg CO2 / year)
- Emissions in 1990-2023 have changed by 0.5%% (2148.50 Gg CO2 / year)
In the third party priority scenario we have the following changes for aggregate Kyoto GHG and national total emissions excluding LULUCF (M.0.EL):
- Emissions in 2023 have changed by -4.6%% (-9392.00 Gg CO2 / year)
- Emissions in 1990-2023 have changed by 1.3%% (6153.67 Gg CO2 / year)
Most important changes per scenario and time frame
In the country reported priority scenario the following sector-gas combinations have the highest absolute impact on national total KyotoGHG (AR6GWP100) emissions in 2023 (top 5):
- 1: 1.A, CO2 with 19788.45 Gg CO2 / year (20.0%)
- 2: 2, CO2 with -16136.46 Gg CO2 / year (-47.4%)
- 3: 1.B.2, CH4 with -13845.05 Gg CO2 / year (-30.4%)
- 4: M.AG.ELV, N2O with -10360.60 Gg CO2 / year (-29.4%)
- 5: 1.B.1, CH4 with 3529.09 Gg CO2 / year (42.1%)
In the country reported priority scenario the following sector-gas combinations have the highest absolute impact on national total KyotoGHG (AR6GWP100) emissions in 1990-2023 (top 5):
- 1: 4, CH4 with 2502.17 Gg CO2 / year (20.3%)
- 2: M.AG.ELV, N2O with -1952.75 Gg CO2 / year (-8.1%)
- 3: 1.A, CO2 with 1186.39 Gg CO2 / year (0.5%)
- 4: 5, N2O with 1120.58 Gg CO2 / year (inf%)
- 5: 2, CO2 with -877.42 Gg CO2 / year (-1.4%)
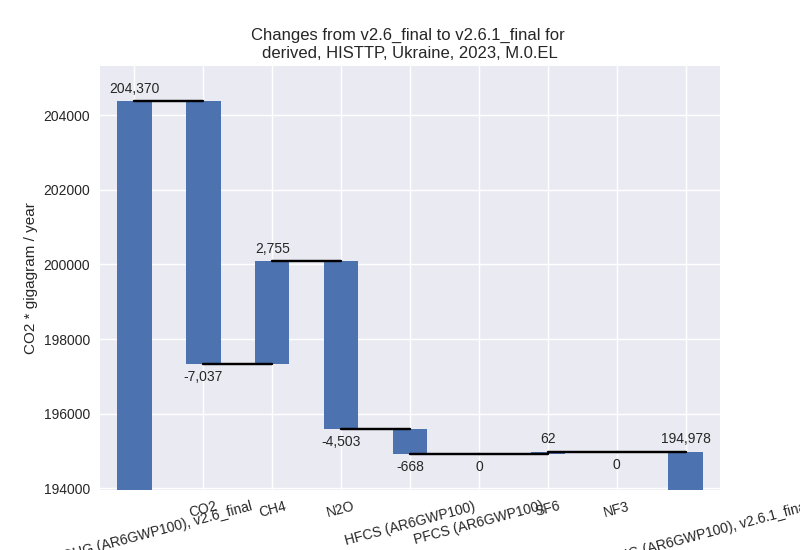
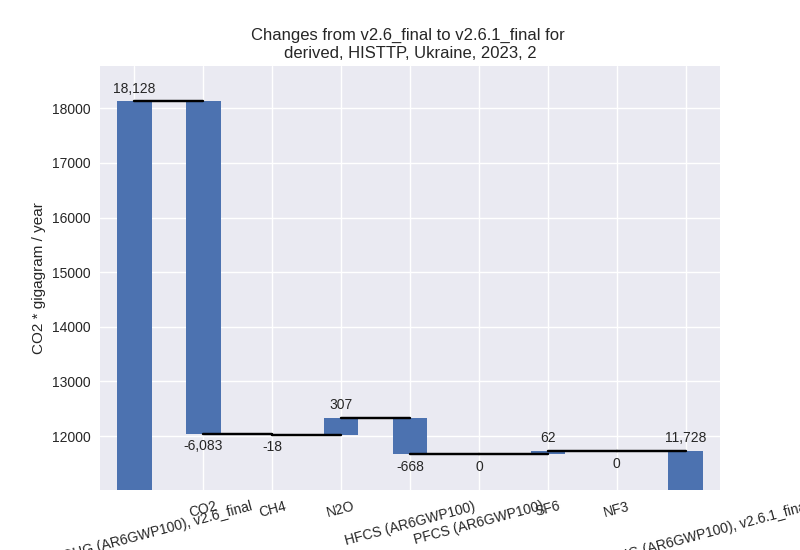
In the third party priority scenario the following sector-gas combinations have the highest absolute impact on national total KyotoGHG (AR6GWP100) emissions in 2023 (top 5):
- 1: 2, CO2 with -6082.81 Gg CO2 / year (-45.6%)
- 2: 1.B.2, CH4 with 5145.35 Gg CO2 / year (20.4%)
- 3: M.AG.ELV, N2O with -4850.07 Gg CO2 / year (-22.1%)
- 4: 1.B.1, CH4 with -2108.10 Gg CO2 / year (-60.2%)
- 5: 1.B.1, CO2 with -838.65 Gg CO2 / year (-19.5%)
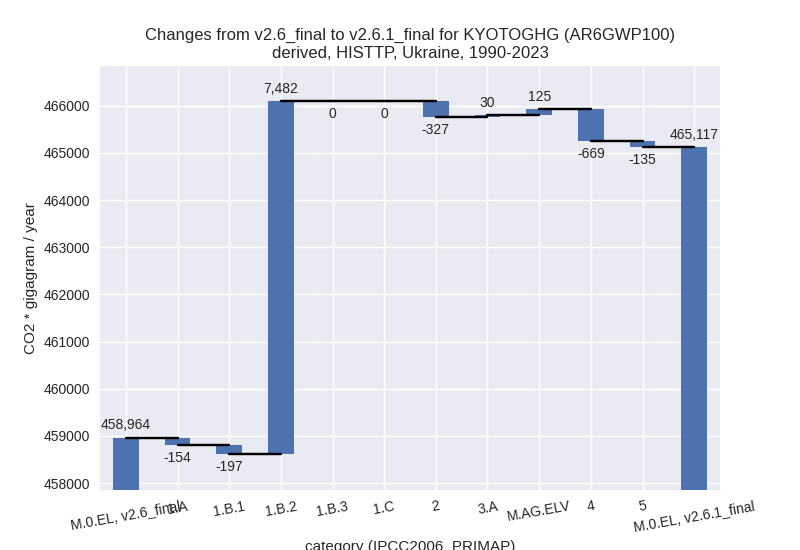
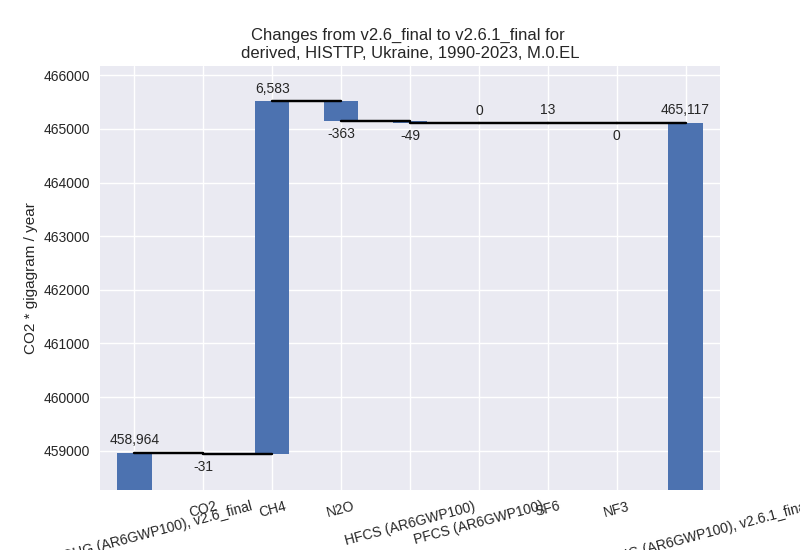
In the third party priority scenario the following sector-gas combinations have the highest absolute impact on national total KyotoGHG (AR6GWP100) emissions in 1990-2023 (top 5):
- 1: 1.B.2, CH4 with 7330.62 Gg CO2 / year (41.5%)
- 2: 4, CH4 with -666.99 Gg CO2 / year (-6.2%)
- 3: M.AG.ELV, CO2 with 353.54 Gg CO2 / year (19.4%)
- 4: 2, CO2 with -288.18 Gg CO2 / year (-1.4%)
- 5: 1.B.1, CO2 with -246.92 Gg CO2 / year (-1.3%)
Notes on data changes
Here we list notes explaining important emissions changes for the country.
- CRT data from BTR1 has been included. We had no new country reported
data for Ukraine in PRIMAP-hist v2.6, thus a year of country reported
data is added and some sector have changed emissions for other years as
well. Changes for 2023 are high especially on a sectoral level. Given
the Russian war against Ukraine it is to be expected that emissions
estimates are volatile.
- Energy CO2 emissions for 2023 are higher than in v2.6 because the 2022 emissions drop is smaller in CRT data than estimated by EI
- Industrial CO2 emissions are down for all subsectors because of lower emissions in CRT data than estimated by EDGAR
- Emissions in M.AG.ELV are also down in 2022 and 2023 compared to v2.6
- Changes in cumulative emissions are partly due to the high changes for the latest years, but for CH4 from waste and N2O from M.AG.ELV the whole time series have changed
- TP time-series changes are similar because the driver is the same and FAO and EDGAR emissions for 2022 show a steep drop for many sectors as well. One exception are fugitive emissions from oil and gas which have been adjusted upwards for all years in the new EDGAR data.
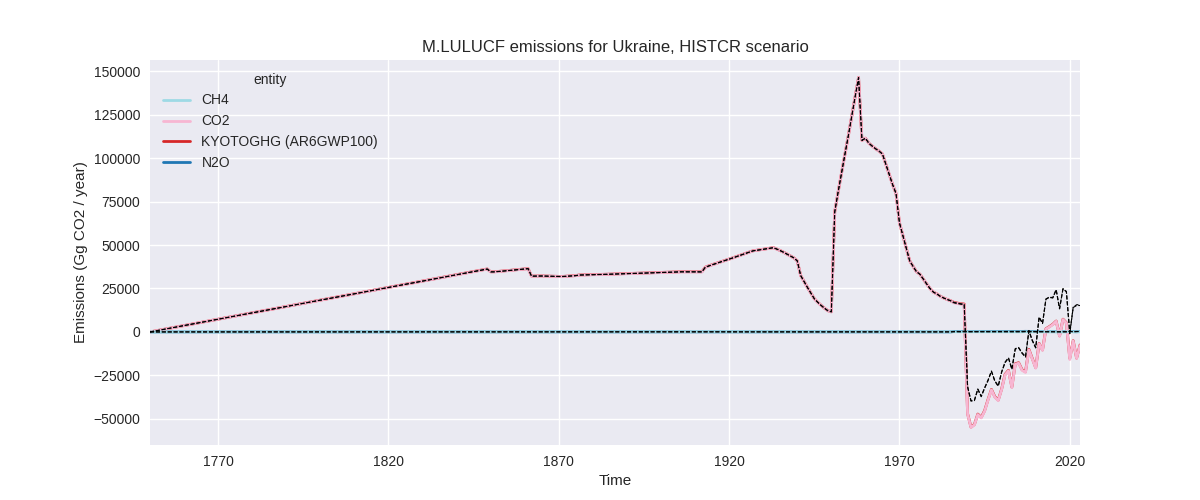
- The changes in pre-1990 emissions mostly come from changed EDGAR data in 1.B
Changes by sector and gas
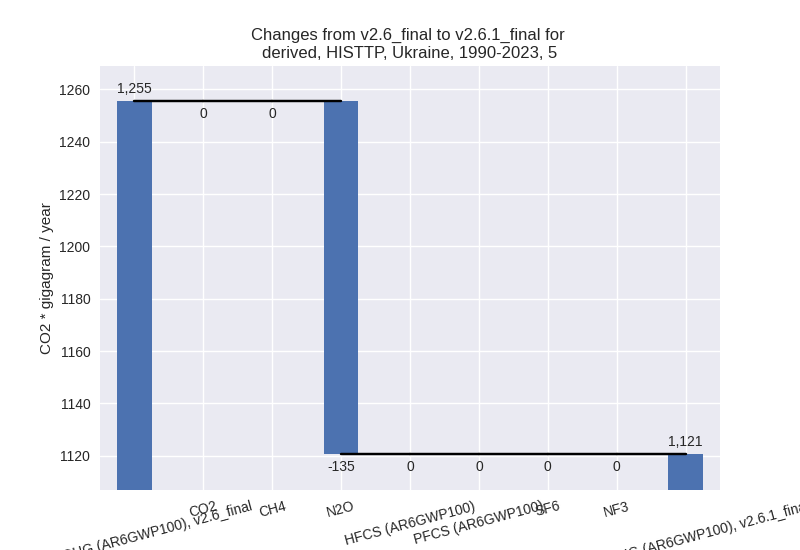
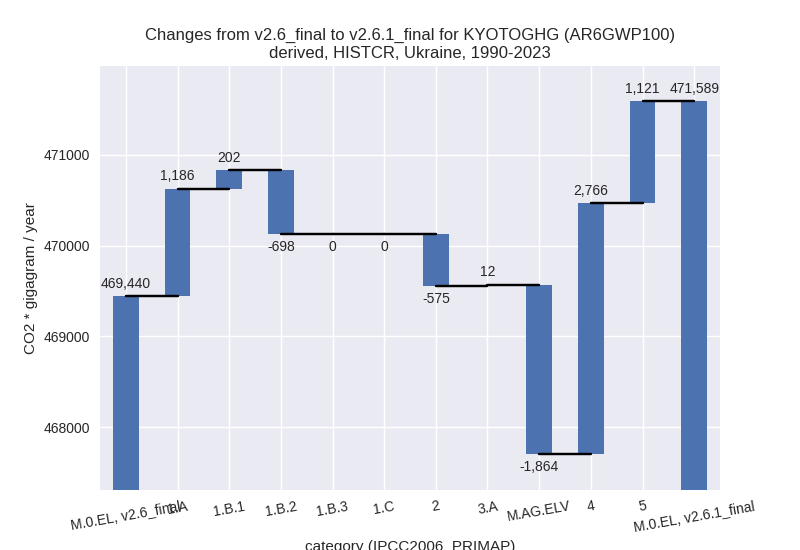
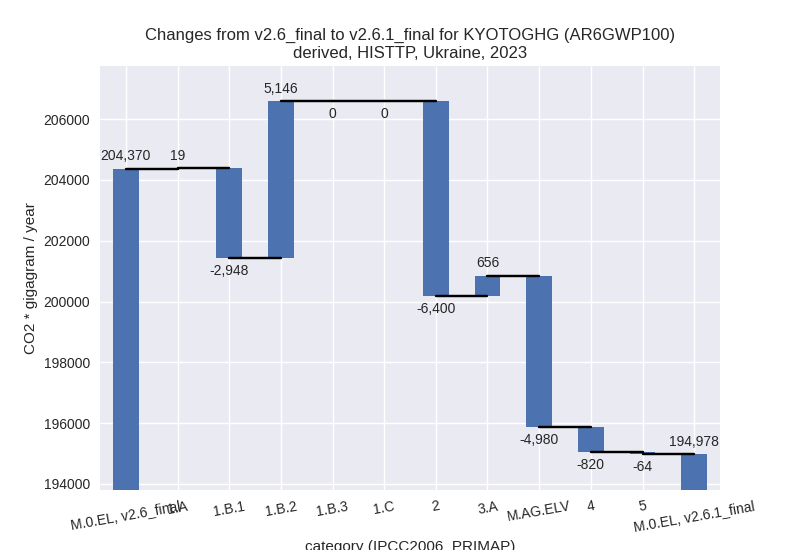
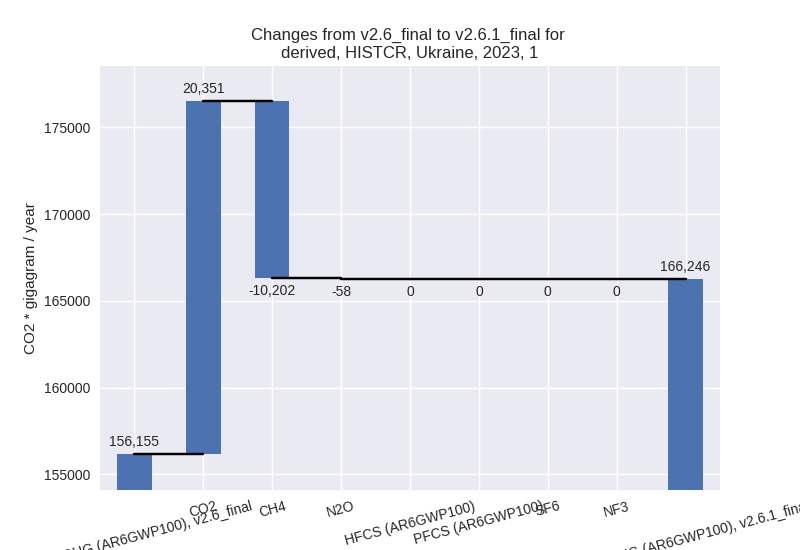
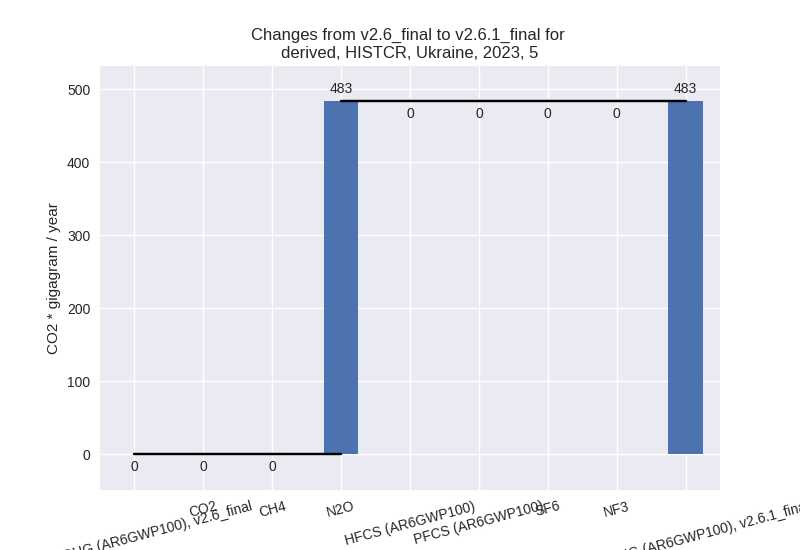
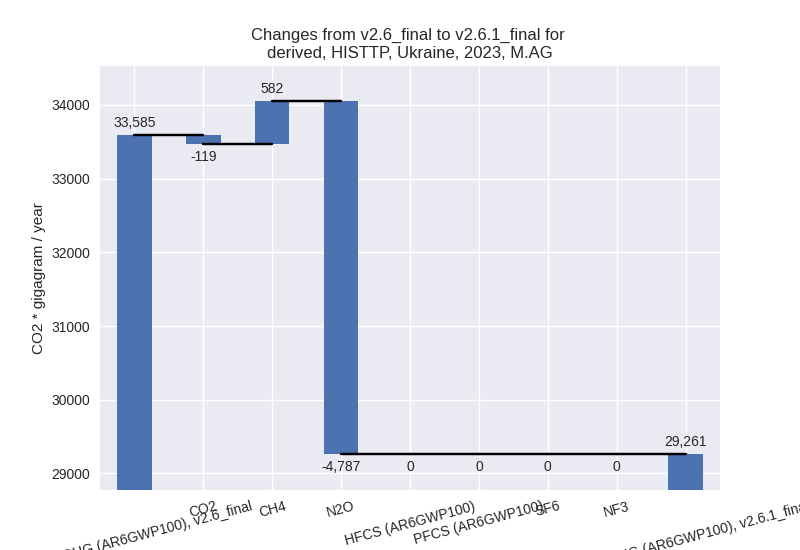
For each scenario and time frame the changes are displayed for all individual sectors and all individual gases. In the sector plot we use aggregate Kyoto GHGs in AR6GWP100. In the gas plot we usenational total emissions without LULUCF.
country reported scenario
2023
1990-2023
third party scenario
2023
1990-2023
Detailed changes for the scenarios:
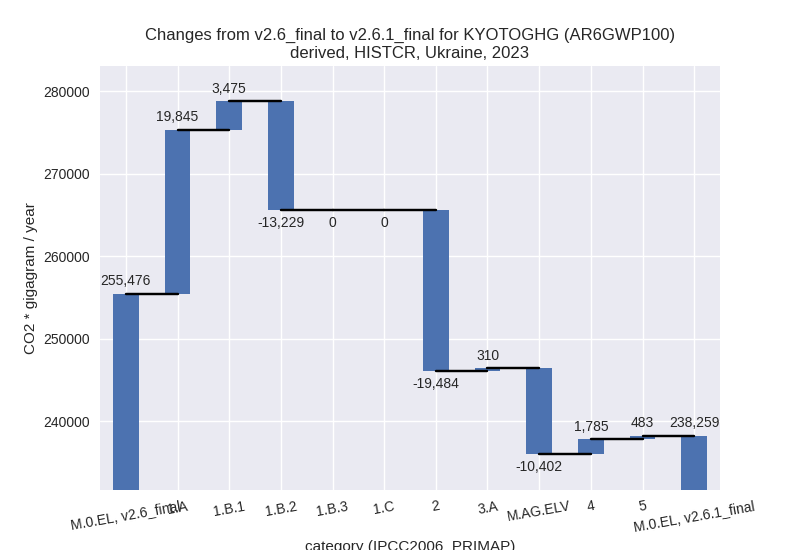
country reported scenario (HISTCR):
Most important changes per time frame
For 2023 the following sector-gas combinations have the highest absolute impact on national total KyotoGHG (AR6GWP100) emissions in 2023 (top 5):
- 1: 1.A, CO2 with 19788.45 Gg CO2 / year (20.0%)
- 2: 2, CO2 with -16136.46 Gg CO2 / year (-47.4%)
- 3: 1.B.2, CH4 with -13845.05 Gg CO2 / year (-30.4%)
- 4: M.AG.ELV, N2O with -10360.60 Gg CO2 / year (-29.4%)
- 5: 1.B.1, CH4 with 3529.09 Gg CO2 / year (42.1%)
For 1990-2023 the following sector-gas combinations have the highest absolute impact on national total KyotoGHG (AR6GWP100) emissions in 1990-2023 (top 5):
- 1: 4, CH4 with 2502.17 Gg CO2 / year (20.3%)
- 2: M.AG.ELV, N2O with -1952.75 Gg CO2 / year (-8.1%)
- 3: 1.A, CO2 with 1186.39 Gg CO2 / year (0.5%)
- 4: 5, N2O with 1120.58 Gg CO2 / year (inf%)
- 5: 2, CO2 with -877.42 Gg CO2 / year (-1.4%)
Changes in the main sectors for aggregate KyotoGHG (AR6GWP100) are
- 1: Total sectoral emissions in 2022 are 170170.03
Gg CO2 / year which is 71.0% of M.0.EL emissions. 2023 Emissions have
changed by 6.5% (10090.71 Gg CO2 /
year). 1990-2023 Emissions have changed by 0.2% (689.68 Gg CO2 / year). For 2023 the
changes per gas
are:
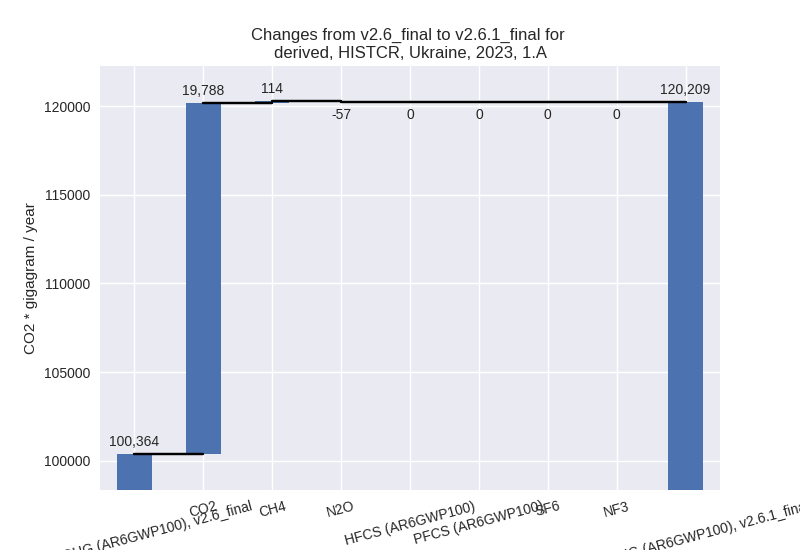
The changes come from the following subsectors:- 1.A: Total sectoral emissions in 2022 are 124778.52
Gg CO2 / year which is 73.3% of category 1 emissions. 2023 Emissions
have changed by 19.8% (19845.21 Gg
CO2 / year). 1990-2023 Emissions have changed by 0.5% (1185.73 Gg CO2 / year). For 2023 the
changes per gas
are:
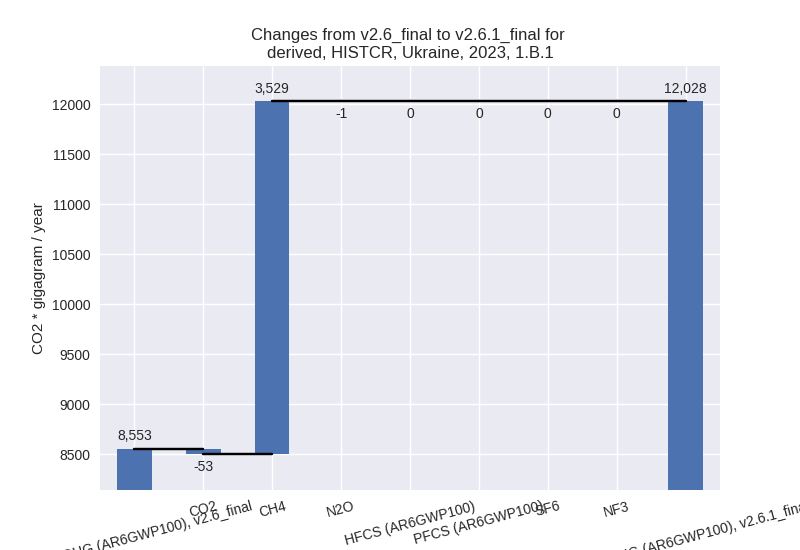
There is no subsector information available in PRIMAP-hist. - 1.B.1: Total sectoral emissions in 2022 are
12349.35 Gg CO2 / year which is 7.3% of category 1 emissions. 2023
Emissions have changed by 40.6%
(3474.74 Gg CO2 / year). 1990-2023 Emissions have changed by 0.6% (202.21 Gg CO2 / year). For 2023 the
changes per gas
are:
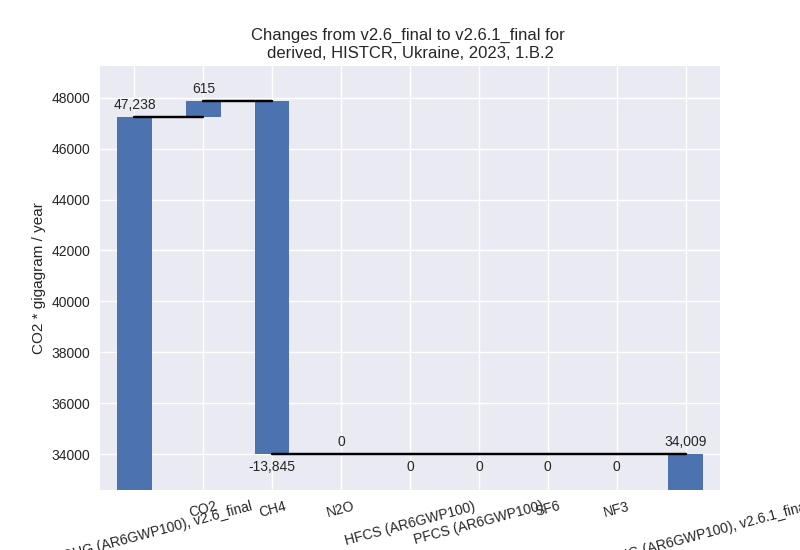
There is no subsector information available in PRIMAP-hist. - 1.B.2: Total sectoral emissions in 2022 are
33042.15 Gg CO2 / year which is 19.4% of category 1 emissions. 2023
Emissions have changed by -28.0%
(-13229.25 Gg CO2 / year). 1990-2023 Emissions have changed by -1.3% (-698.26 Gg CO2 / year). For 2023
the changes per gas
are:
There is no subsector information available in PRIMAP-hist.
- 1.A: Total sectoral emissions in 2022 are 124778.52
Gg CO2 / year which is 73.3% of category 1 emissions. 2023 Emissions
have changed by 19.8% (19845.21 Gg
CO2 / year). 1990-2023 Emissions have changed by 0.5% (1185.73 Gg CO2 / year). For 2023 the
changes per gas
are:
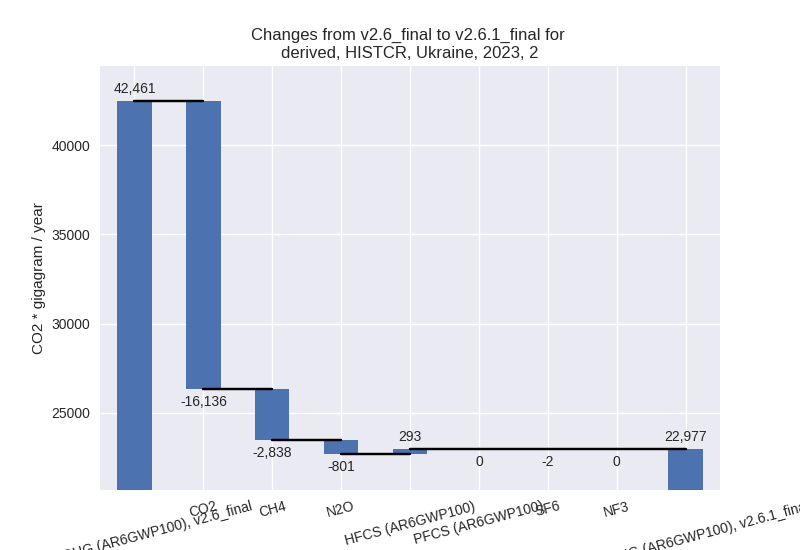
- 2: Total sectoral emissions in 2022 are 22003.10 Gg
CO2 / year which is 9.2% of M.0.EL emissions. 2023 Emissions have
changed by -45.9% (-19483.77 Gg CO2
/ year). 1990-2023 Emissions have changed by -0.8% (-575.41 Gg CO2 / year). For 2023
the changes per gas
are:
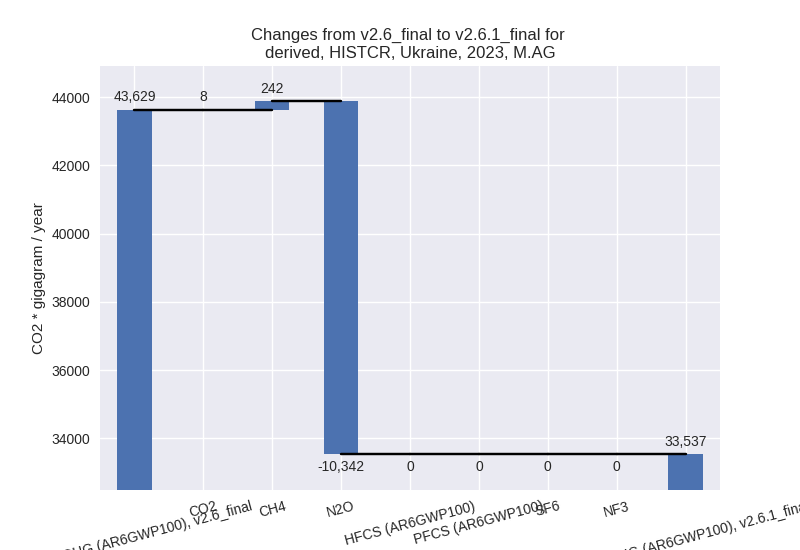
- M.AG: Total sectoral emissions in 2022 are 32467.60
Gg CO2 / year which is 13.5% of M.0.EL emissions. 2023 Emissions have
changed by -23.1% (-10091.61 Gg CO2
/ year). 1990-2023 Emissions have changed by -4.1% (-1852.04 Gg CO2 / year). For 2023
the changes per gas
are:
For 1990-2023 the changes per gas are: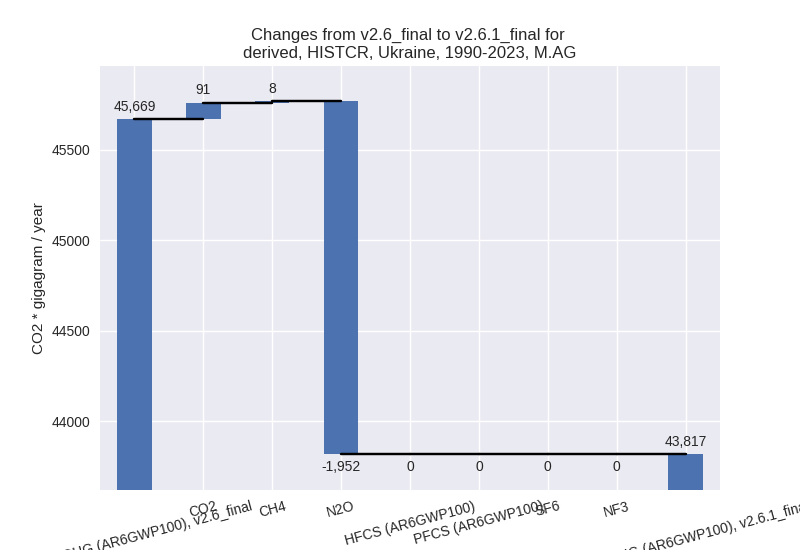
The changes come from the following subsectors:- 3.A: Total sectoral emissions in 2022 are 8483.67
Gg CO2 / year which is 26.1% of category M.AG emissions. 2023 Emissions
have changed by 3.9% (310.34 Gg CO2
/ year). 1990-2023 Emissions have changed by 0.1% (12.41 Gg CO2 / year). For 2023 the
changes per gas
are:

There is no subsector information available in PRIMAP-hist. - M.AG.ELV: Total sectoral emissions in 2022 are
23983.93 Gg CO2 / year which is 73.9% of category M.AG emissions. 2023
Emissions have changed by -29.2%
(-10401.95 Gg CO2 / year). 1990-2023 Emissions have changed by -7.5% (-1864.45 Gg CO2 / year). For 2023
the changes per gas
are:

For 1990-2023 the changes per gas are:
There is no subsector information available in PRIMAP-hist.
- 3.A: Total sectoral emissions in 2022 are 8483.67
Gg CO2 / year which is 26.1% of category M.AG emissions. 2023 Emissions
have changed by 3.9% (310.34 Gg CO2
/ year). 1990-2023 Emissions have changed by 0.1% (12.41 Gg CO2 / year). For 2023 the
changes per gas
are:
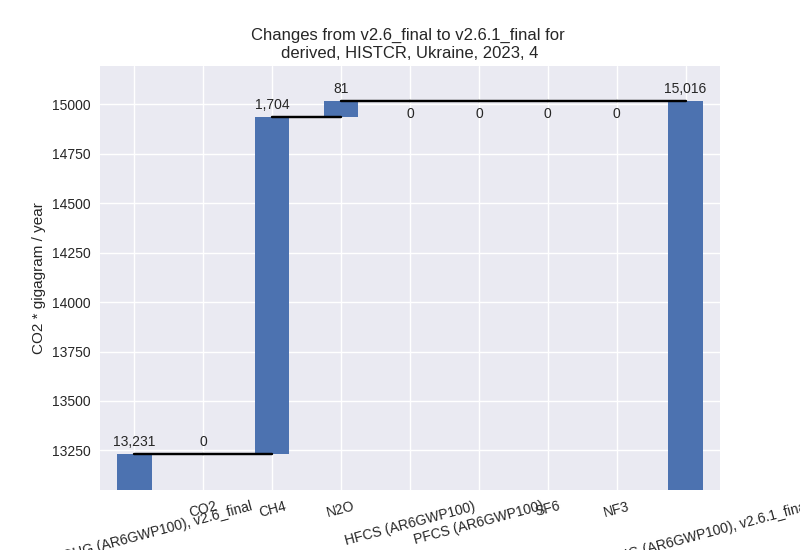
- 4: Total sectoral emissions in 2022 are 14604.27 Gg
CO2 / year which is 6.1% of M.0.EL emissions. 2023 Emissions have
changed by 13.5% (1785.01 Gg CO2 /
year). 1990-2023 Emissions have changed by 20.5% (2765.69 Gg CO2 / year). For 2023
the changes per gas
are:
For 1990-2023 the changes per gas are: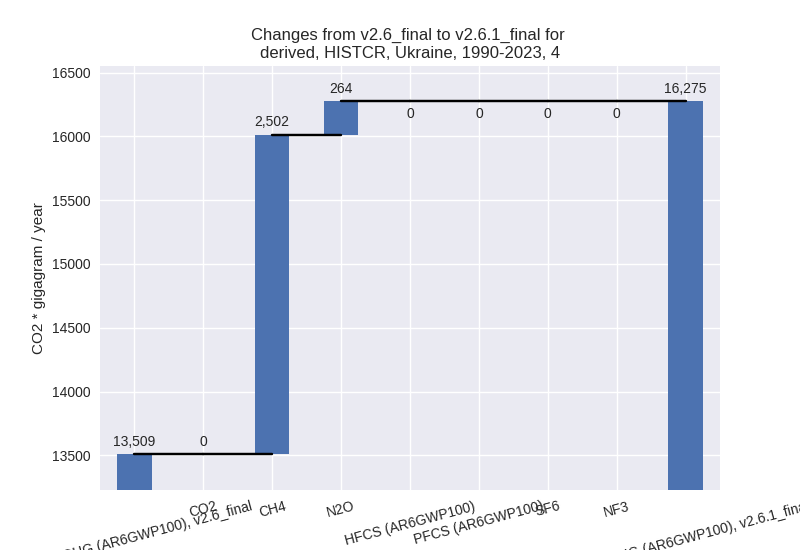
- 5: Total sectoral emissions in 2022 are 496.51 Gg
CO2 / year which is 0.2% of M.0.EL emissions. 2023 Emissions have
changed by inf% (483.26 Gg CO2 /
year). 1990-2023 Emissions have changed by inf% (1120.58 Gg CO2 / year). For 2023 the
changes per gas
are:
For 1990-2023 the changes per gas are: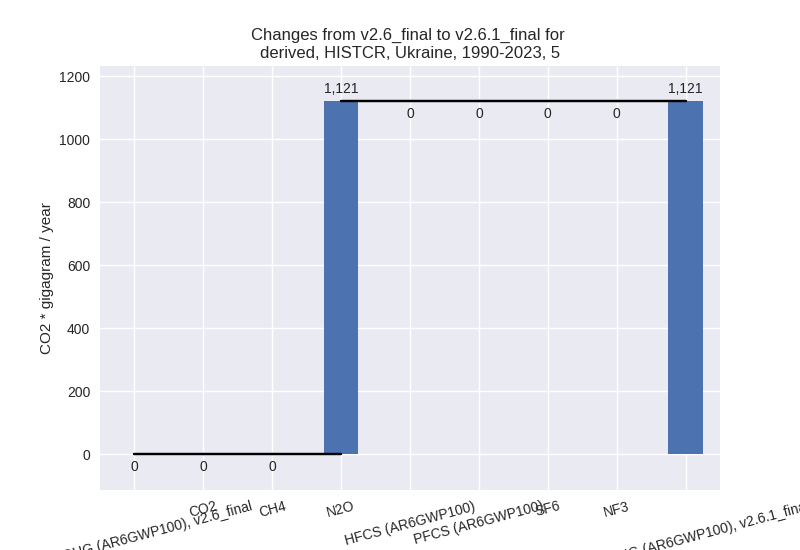
third party scenario (HISTTP):
Most important changes per time frame
For 2023 the following sector-gas combinations have the highest absolute impact on national total KyotoGHG (AR6GWP100) emissions in 2023 (top 5):
- 1: 2, CO2 with -6082.81 Gg CO2 / year (-45.6%)
- 2: 1.B.2, CH4 with 5145.35 Gg CO2 / year (20.4%)
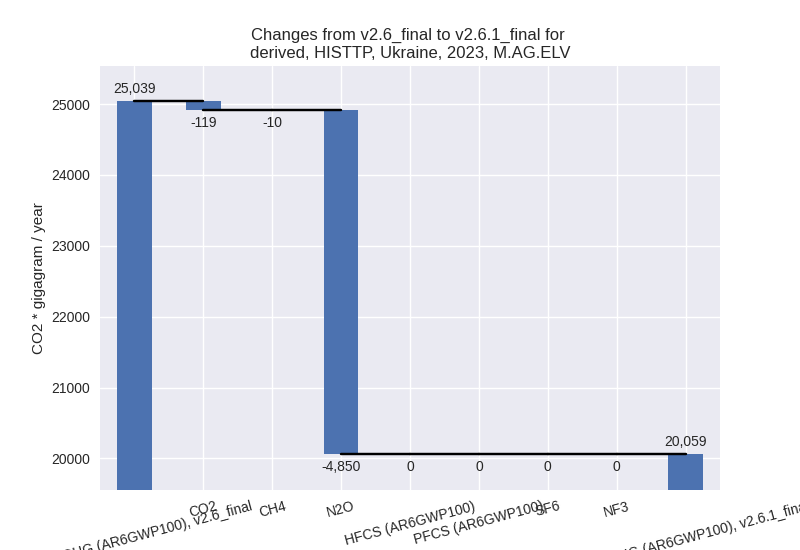
- 3: M.AG.ELV, N2O with -4850.07 Gg CO2 / year (-22.1%)
- 4: 1.B.1, CH4 with -2108.10 Gg CO2 / year (-60.2%)
- 5: 1.B.1, CO2 with -838.65 Gg CO2 / year (-19.5%)
For 1990-2023 the following sector-gas combinations have the highest absolute impact on national total KyotoGHG (AR6GWP100) emissions in 1990-2023 (top 5):
- 1: 1.B.2, CH4 with 7330.62 Gg CO2 / year (41.5%)
- 2: 4, CH4 with -666.99 Gg CO2 / year (-6.2%)
- 3: M.AG.ELV, CO2 with 353.54 Gg CO2 / year (19.4%)
- 4: 2, CO2 with -288.18 Gg CO2 / year (-1.4%)
- 5: 1.B.1, CO2 with -246.92 Gg CO2 / year (-1.3%)
Changes in the main sectors for aggregate KyotoGHG (AR6GWP100) are
- 1: Total sectoral emissions in 2022 are 145644.60 Gg CO2 / year which is 73.9% of M.0.EL emissions. 2023 Emissions have changed by 1.6% (2216.36 Gg CO2 / year). 1990-2023 Emissions have changed by 1.9% (7130.22 Gg CO2 / year).
- 2: Total sectoral emissions in 2022 are 11371.57 Gg
CO2 / year which is 5.8% of M.0.EL emissions. 2023 Emissions have
changed by -35.3% (-6400.12 Gg CO2 /
year). 1990-2023 Emissions have changed by -1.3% (-327.30 Gg CO2 / year). For 2023
the changes per gas
are:
- M.AG: Total sectoral emissions in 2022 are 28838.57
Gg CO2 / year which is 14.6% of M.0.EL emissions. 2023 Emissions have
changed by -12.9% (-4323.53 Gg CO2 /
year). 1990-2023 Emissions have changed by 0.3% (154.73 Gg CO2 / year). For 2023 the
changes per gas
are:
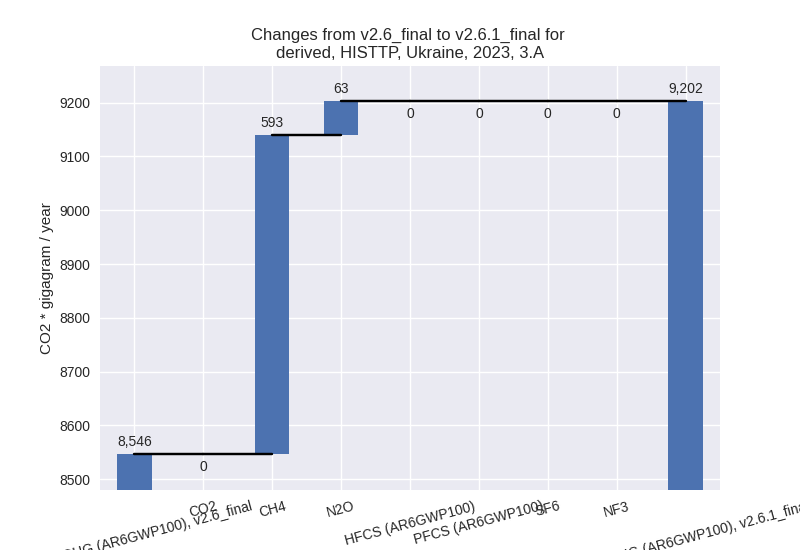
The changes come from the following subsectors:- 3.A: Total sectoral emissions in 2022 are 9428.88
Gg CO2 / year which is 32.7% of category M.AG emissions. 2023 Emissions
have changed by 7.7% (656.07 Gg CO2
/ year). 1990-2023 Emissions have changed by 0.1% (30.05 Gg CO2 / year). For 2023 the
changes per gas
are:
There is no subsector information available in PRIMAP-hist. - M.AG.ELV: Total sectoral emissions in 2022 are
19409.68 Gg CO2 / year which is 67.3% of category M.AG emissions. 2023
Emissions have changed by -19.9%
(-4979.60 Gg CO2 / year). 1990-2023 Emissions have changed by 0.6% (124.68 Gg CO2 / year). For 2023 the
changes per gas
are:
There is no subsector information available in PRIMAP-hist.
- 3.A: Total sectoral emissions in 2022 are 9428.88
Gg CO2 / year which is 32.7% of category M.AG emissions. 2023 Emissions
have changed by 7.7% (656.07 Gg CO2
/ year). 1990-2023 Emissions have changed by 0.1% (30.05 Gg CO2 / year). For 2023 the
changes per gas
are:
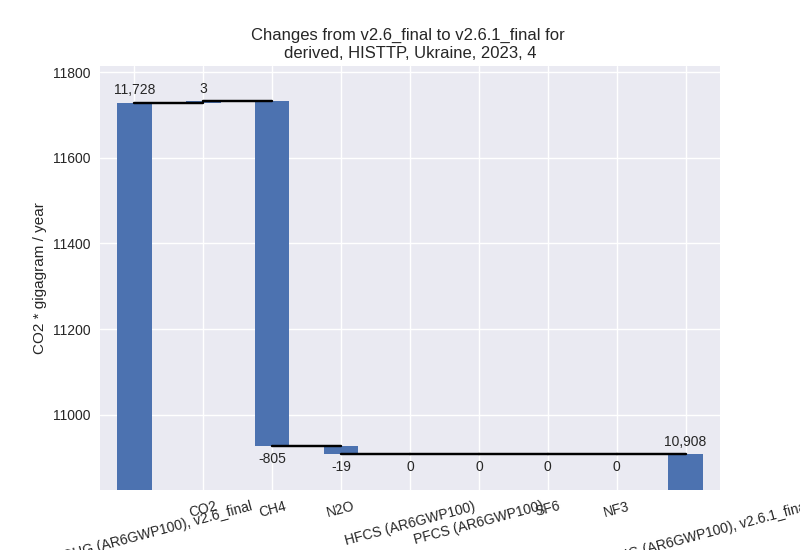
- 4: Total sectoral emissions in 2022 are 10604.36 Gg
CO2 / year which is 5.4% of M.0.EL emissions. 2023 Emissions have
changed by -7.0% (-820.22 Gg CO2 /
year). 1990-2023 Emissions have changed by -5.9% (-669.08 Gg CO2 / year). For 2023
the changes per gas
are:
For 1990-2023 the changes per gas are:
- 5: Total sectoral emissions in 2022 are 496.51 Gg
CO2 / year which is 0.3% of M.0.EL emissions. 2023 Emissions have
changed by -11.8% (-64.49 Gg CO2 /
year). 1990-2023 Emissions have changed by -10.7% (-134.89 Gg CO2 / year). For 2023
the changes per gas
are:

For 1990-2023 the changes per gas are: