Changes in PRIMAP-hist v2.6.1_final compared to v2.6_final for Uruguay
2025-03-19
Johannes Gütschow
Change analysis for Uruguay for PRIMAP-hist v2.6.1_final compared to v2.6_final
Overview over emissions by sector and gas
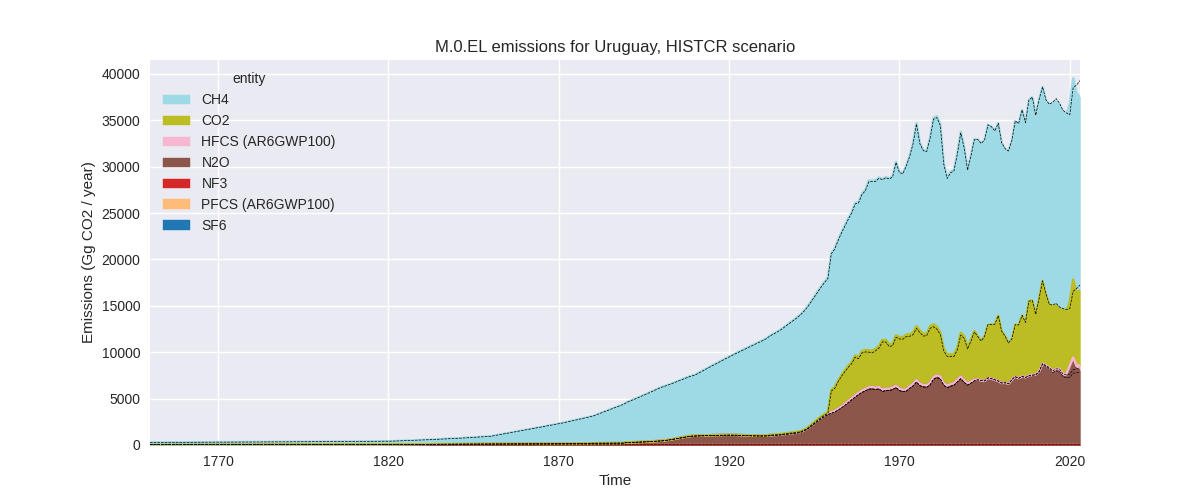
The following figures show the aggregate national total emissions excluding LULUCF AR6GWP100 for the country reported priority scenario. The dotted linesshow the v2.6_final data.
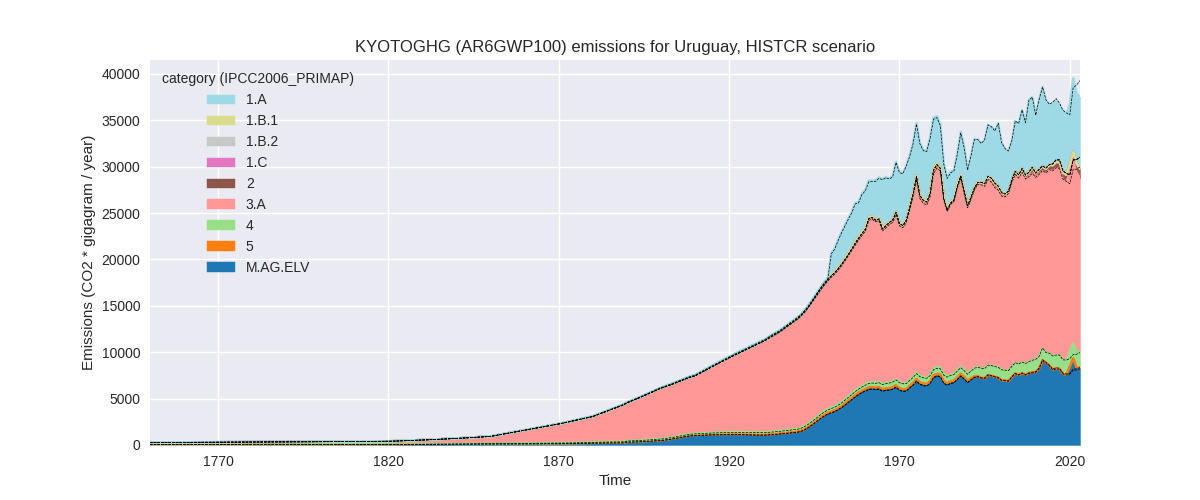
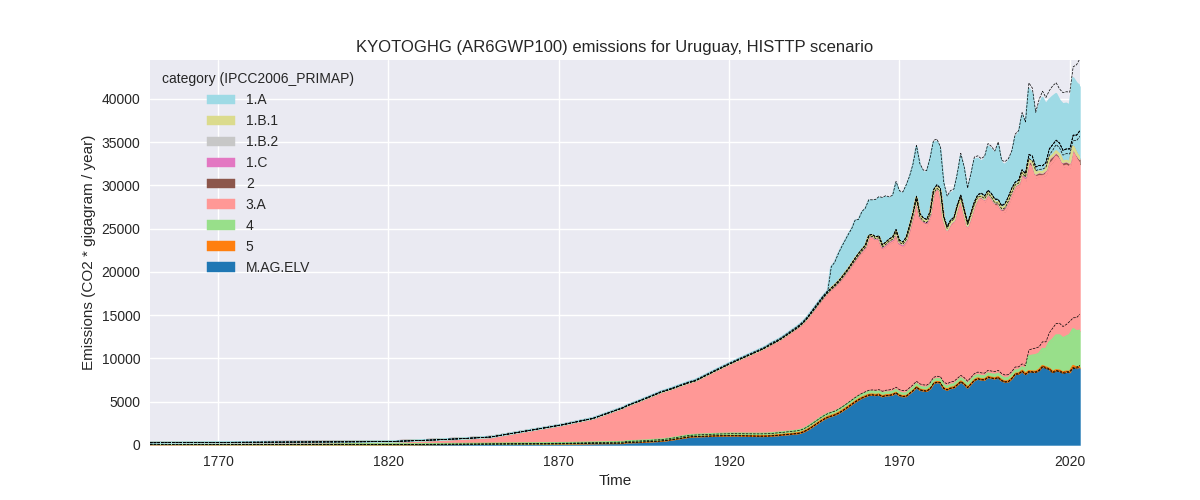
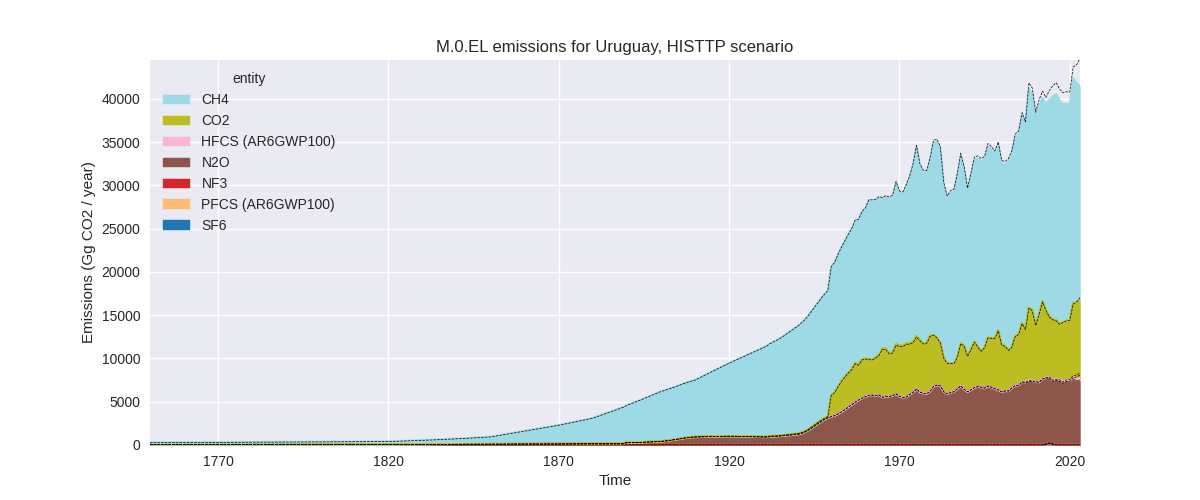
The following figures show the aggregate national total emissions excluding LULUCF AR6GWP100 for the third party priority scenario. The dotted linesshow the v2.6_final data.
Overview over changes
In the country reported priority scenario we have the following changes for aggregate Kyoto GHG and national total emissions excluding LULUCF (M.0.EL):
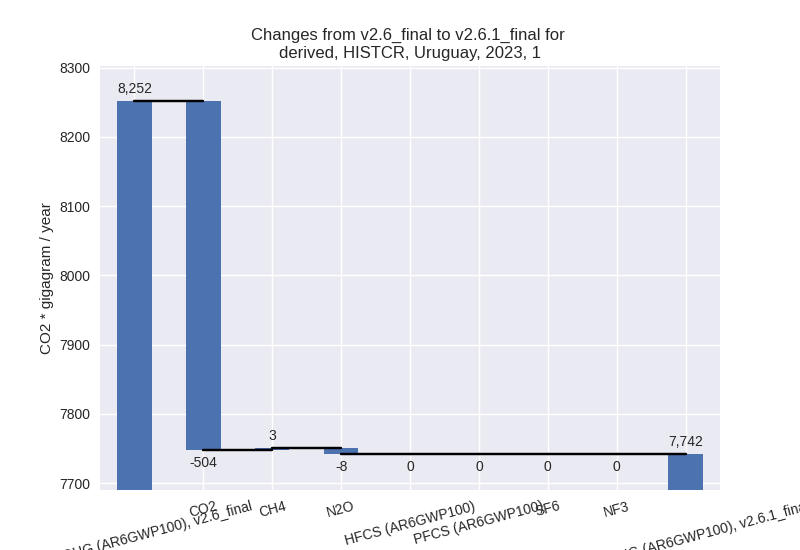
- Emissions in 2023 have changed by -4.5%% (-1752.65 Gg CO2 / year)
- Emissions in 1990-2023 have changed by -0.1%% (-48.75 Gg CO2 / year)
In the third party priority scenario we have the following changes for aggregate Kyoto GHG and national total emissions excluding LULUCF (M.0.EL):
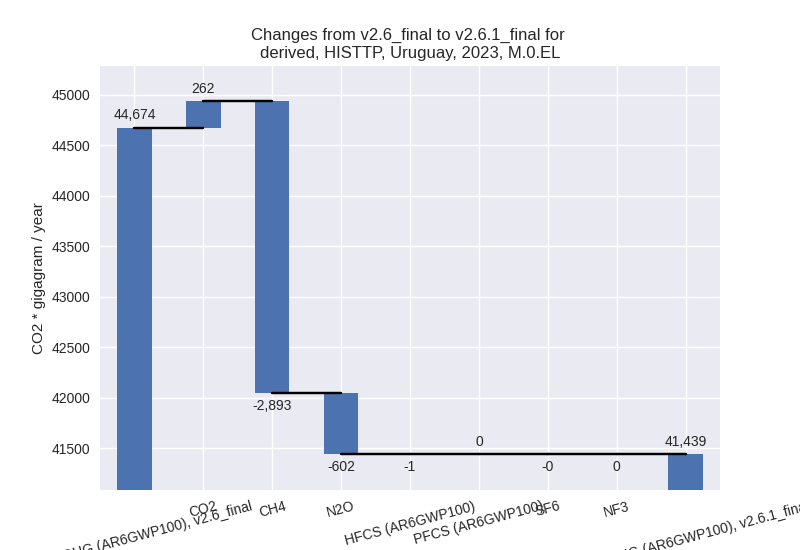
- Emissions in 2023 have changed by -7.2%% (-3234.64 Gg CO2 / year)
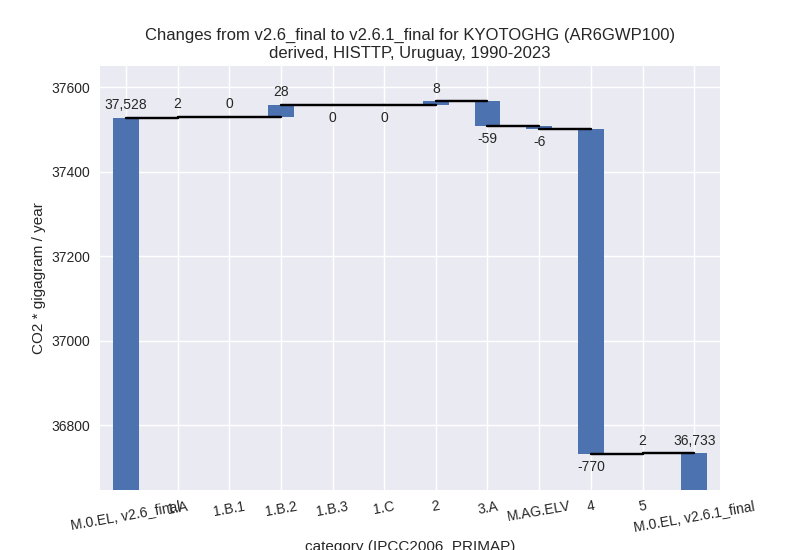
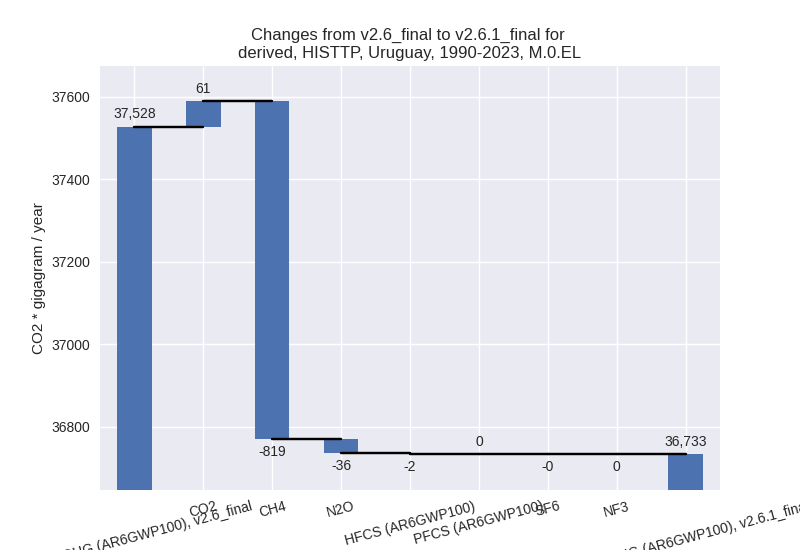
- Emissions in 1990-2023 have changed by -2.1%% (-795.12 Gg CO2 / year)
Most important changes per scenario and time frame
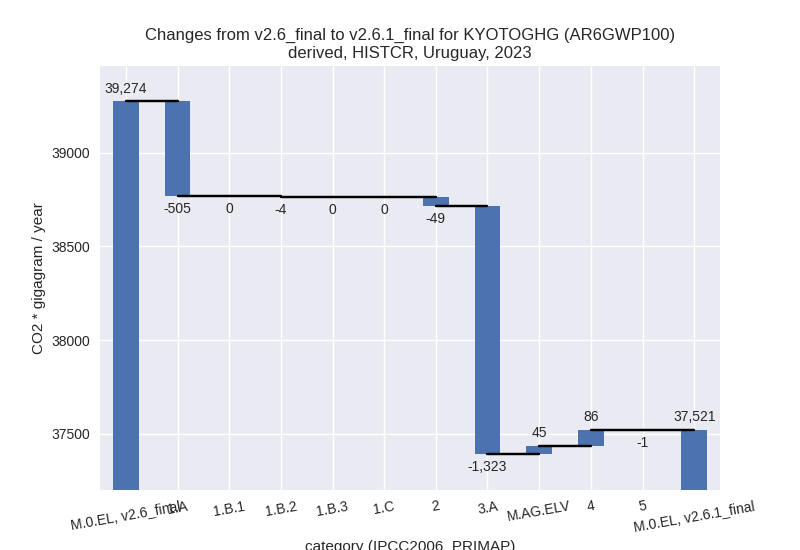
In the country reported priority scenario the following sector-gas combinations have the highest absolute impact on national total KyotoGHG (AR6GWP100) emissions in 2023 (top 5):
- 1: 3.A, CH4 with -1315.93 Gg CO2 / year (-6.6%)
- 2: 1.A, CO2 with -504.13 Gg CO2 / year (-6.4%)
- 3: M.AG.ELV, CO2 with -224.34 Gg CO2 / year (-55.1%)
- 4: M.AG.ELV, N2O with 207.00 Gg CO2 / year (2.8%)
- 5: 2, CO2 with -107.19 Gg CO2 / year (-17.7%)
In the country reported priority scenario the following sector-gas combinations have the highest absolute impact on national total KyotoGHG (AR6GWP100) emissions in 1990-2023 (top 5):
- 1: M.AG.ELV, N2O with 87.88 Gg CO2 / year (1.2%)
- 2: 3.A, CH4 with -53.04 Gg CO2 / year (-0.3%)
- 3: M.AG.ELV, CO2 with -42.08 Gg CO2 / year (-27.5%)
- 4: 2, CO2 with -28.11 Gg CO2 / year (-6.7%)
- 5: 1.A, CO2 with -23.96 Gg CO2 / year (-0.4%)
In the third party priority scenario the following sector-gas combinations have the highest absolute impact on national total KyotoGHG (AR6GWP100) emissions in 2023 (top 5):
- 1: 4, CH4 with -1732.92 Gg CO2 / year (-29.6%)
- 2: 3.A, CH4 with -1343.03 Gg CO2 / year (-6.5%)
- 3: M.AG.ELV, N2O with -581.94 Gg CO2 / year (-7.6%)
- 4: M.AG.ELV, CO2 with 253.98 Gg CO2 / year (62.4%)
- 5: M.AG.ELV, CH4 with 152.35 Gg CO2 / year (14.7%)
In the third party priority scenario the following sector-gas combinations have the highest absolute impact on national total KyotoGHG (AR6GWP100) emissions in 1990-2023 (top 5):
- 1: 4, CH4 with -770.82 Gg CO2 / year (-31.7%)
- 2: 3.A, CH4 with -57.45 Gg CO2 / year (-0.3%)
- 3: M.AG.ELV, N2O with -35.49 Gg CO2 / year (-0.5%)
- 4: 1.B.2, CO2 with 28.25 Gg CO2 / year (1636269.3%)
- 5: M.AG.ELV, CO2 with 22.83 Gg CO2 / year (14.9%)
Notes on data changes
Here we list notes explaining important emissions changes for the country.
- CRT covering 1990 and 2020-2021 has been included. It replaces BUR2
for 1990 and extends BUR2 and DI data. BUR2 still in use for 1994, 1998,
2000, 2002, 2004, 2006, 2008, 2010, 2012, 2014. DI is in use for 2019
and for 2016-2017 (not covering all sectors).
- Emissions in many sectors have changed due to the new CRT data, however the CRT data is in good alignment with old country reported data and third party data, thus the changes are mostly limited to the latest years and cumulative emissions changes are small in the CR scenario.
- Changes in the TP time-series come from updated EDGAR and FAO data. FAO has adjusted data for the latest years while EDGAR has updated full time-series with the main change coming from the waste sector.
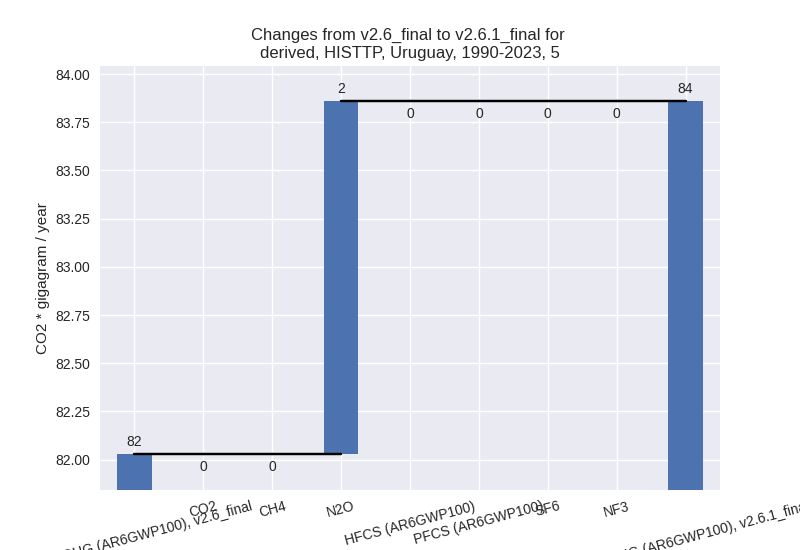
Changes by sector and gas
For each scenario and time frame the changes are displayed for all individual sectors and all individual gases. In the sector plot we use aggregate Kyoto GHGs in AR6GWP100. In the gas plot we usenational total emissions without LULUCF.
country reported scenario
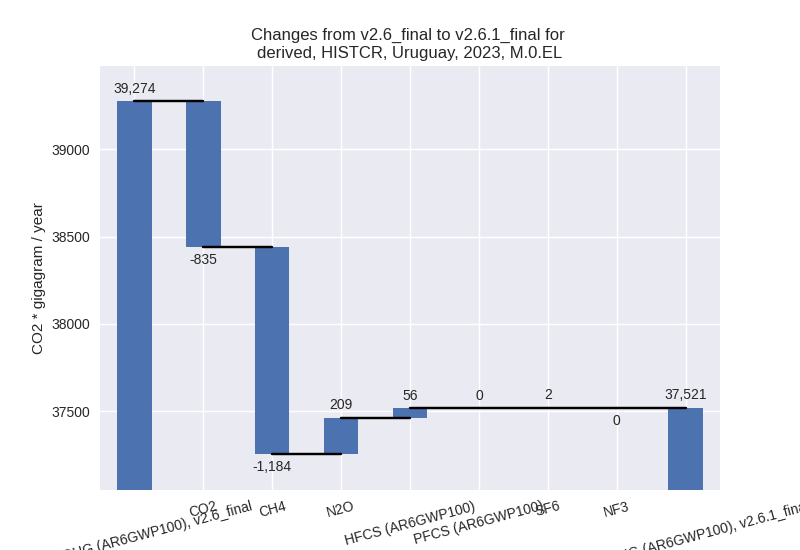
2023
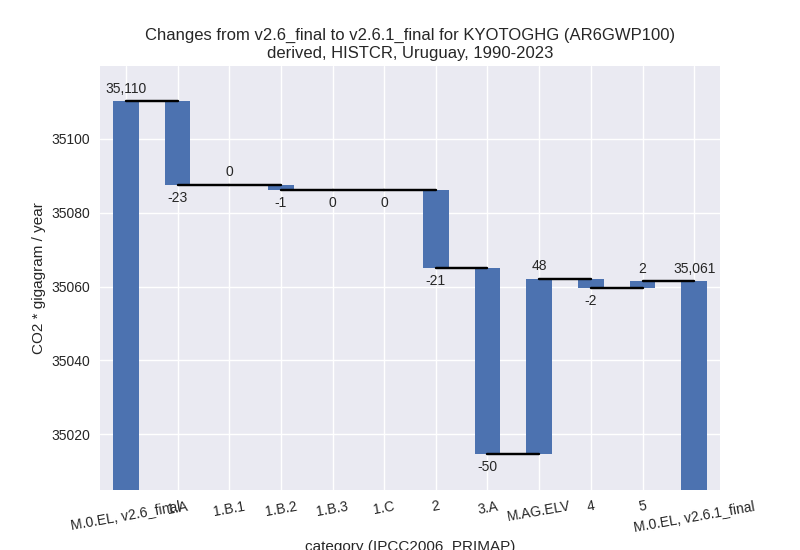
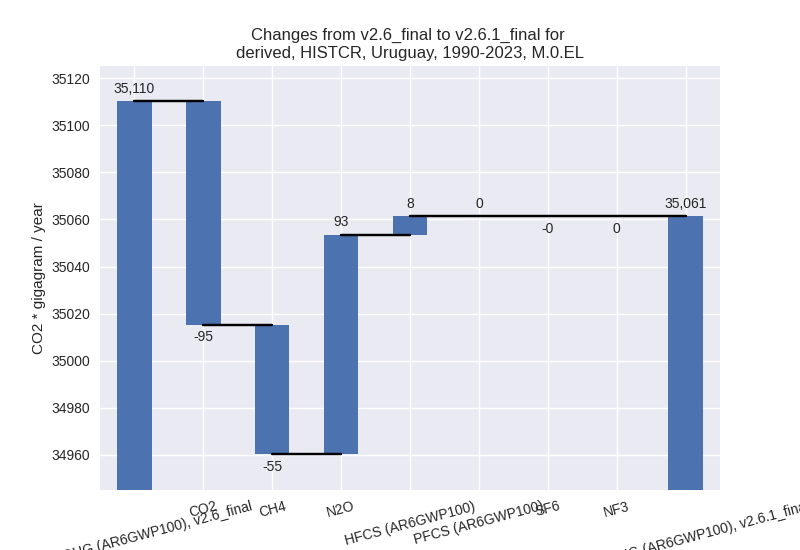
1990-2023
third party scenario
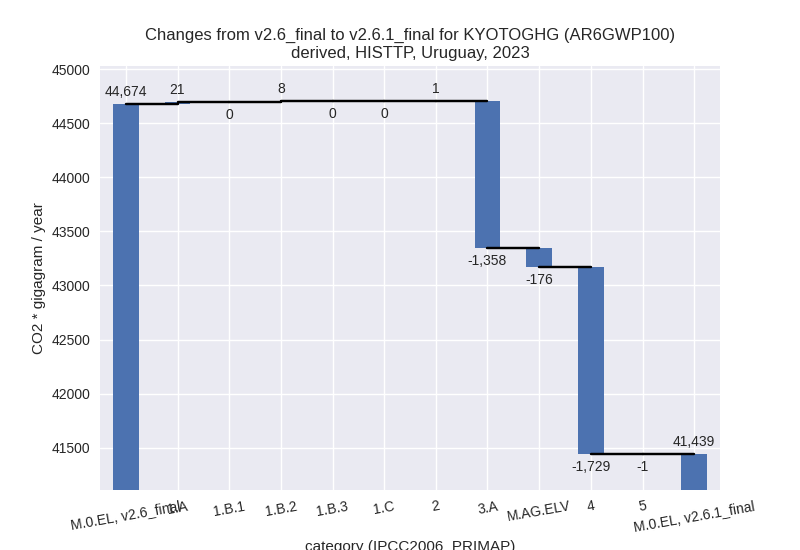
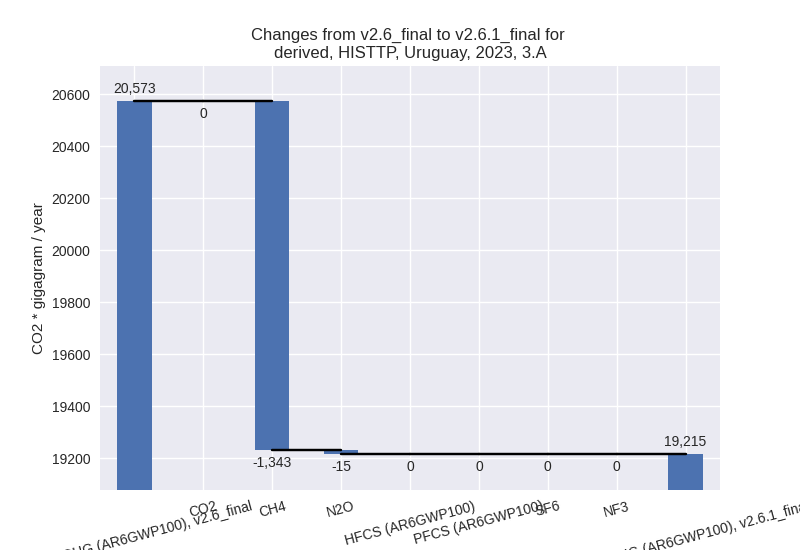
2023
1990-2023
Detailed changes for the scenarios:
country reported scenario (HISTCR):
Most important changes per time frame
For 2023 the following sector-gas combinations have the highest absolute impact on national total KyotoGHG (AR6GWP100) emissions in 2023 (top 5):
- 1: 3.A, CH4 with -1315.93 Gg CO2 / year (-6.6%)
- 2: 1.A, CO2 with -504.13 Gg CO2 / year (-6.4%)
- 3: M.AG.ELV, CO2 with -224.34 Gg CO2 / year (-55.1%)
- 4: M.AG.ELV, N2O with 207.00 Gg CO2 / year (2.8%)
- 5: 2, CO2 with -107.19 Gg CO2 / year (-17.7%)
For 1990-2023 the following sector-gas combinations have the highest absolute impact on national total KyotoGHG (AR6GWP100) emissions in 1990-2023 (top 5):
- 1: M.AG.ELV, N2O with 87.88 Gg CO2 / year (1.2%)
- 2: 3.A, CH4 with -53.04 Gg CO2 / year (-0.3%)
- 3: M.AG.ELV, CO2 with -42.08 Gg CO2 / year (-27.5%)
- 4: 2, CO2 with -28.11 Gg CO2 / year (-6.7%)
- 5: 1.A, CO2 with -23.96 Gg CO2 / year (-0.4%)
Changes in the main sectors for aggregate KyotoGHG (AR6GWP100) are
- 1: Total sectoral emissions in 2022 are 7543.17 Gg
CO2 / year which is 19.9% of M.0.EL emissions. 2023 Emissions have
changed by -6.2% (-509.64 Gg CO2 /
year). 1990-2023 Emissions have changed by -0.4% (-24.03 Gg CO2 / year). For 2023 the
changes per gas
are:
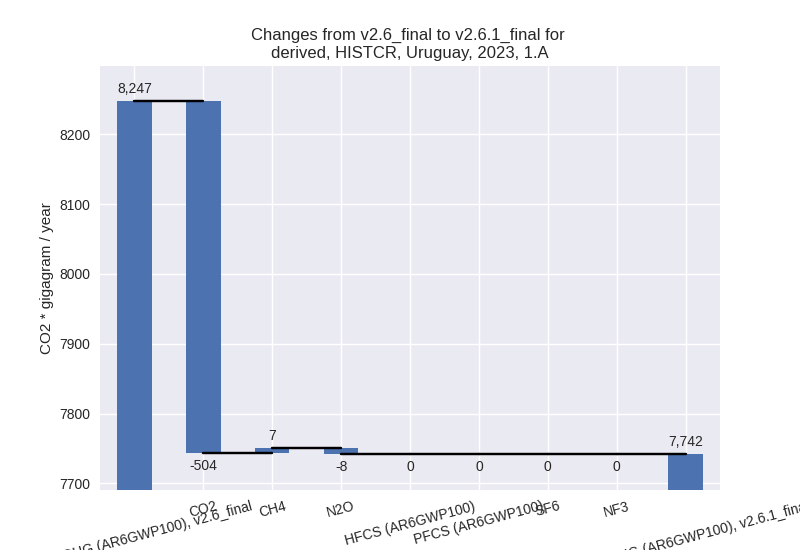
The changes come from the following subsectors:- 1.A: Total sectoral emissions in 2022 are 7543.17
Gg CO2 / year which is 100.0% of category 1 emissions. 2023 Emissions
have changed by -6.1% (-505.41 Gg
CO2 / year). 1990-2023 Emissions have changed by -0.4% (-22.64 Gg CO2 / year). For 2023 the
changes per gas
are:
There is no subsector information available in PRIMAP-hist. - 1.B.1: Total sectoral emissions in 2022 are 0.00 Gg CO2 / year which is 0.0% of category 1 emissions. 2023 Emissions have changed by 0.0% (0.00 Gg CO2 / year). 1990-2023 Emissions have changed by 0.0% (0.00 Gg CO2 / year).
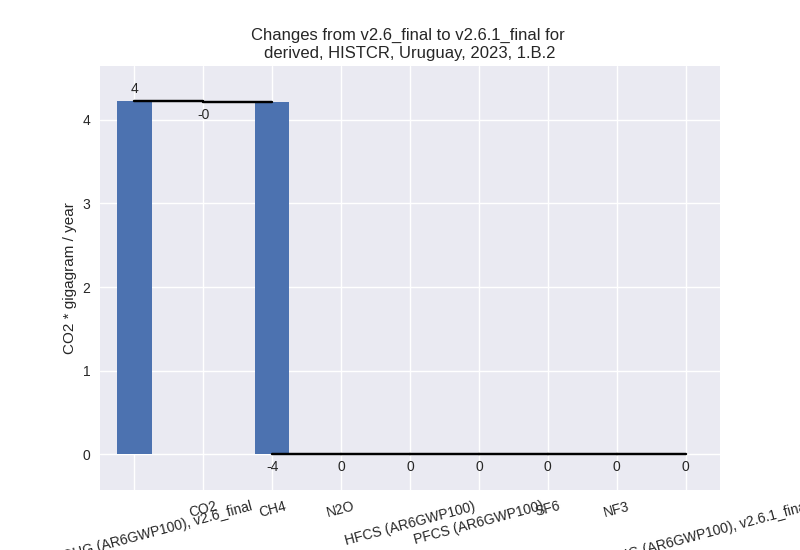
- 1.B.2: Total sectoral emissions in 2022 are 0.00 Gg
CO2 / year which is 0.0% of category 1 emissions. 2023 Emissions have
changed by -100.0% (-4.22 Gg CO2 /
year). 1990-2023 Emissions have changed by -47.3% (-1.39 Gg CO2 / year). For 2023 the
changes per gas
are:
For 1990-2023 the changes per gas are: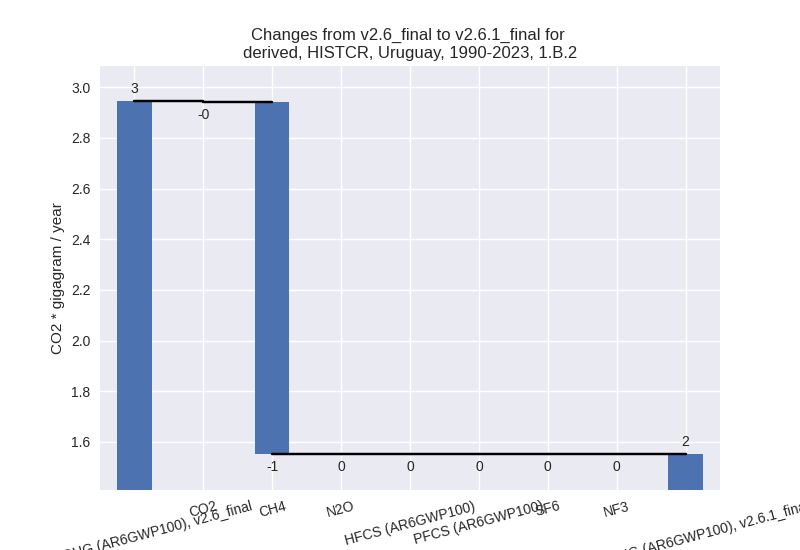
There is no subsector information available in PRIMAP-hist.
- 1.A: Total sectoral emissions in 2022 are 7543.17
Gg CO2 / year which is 100.0% of category 1 emissions. 2023 Emissions
have changed by -6.1% (-505.41 Gg
CO2 / year). 1990-2023 Emissions have changed by -0.4% (-22.64 Gg CO2 / year). For 2023 the
changes per gas
are:
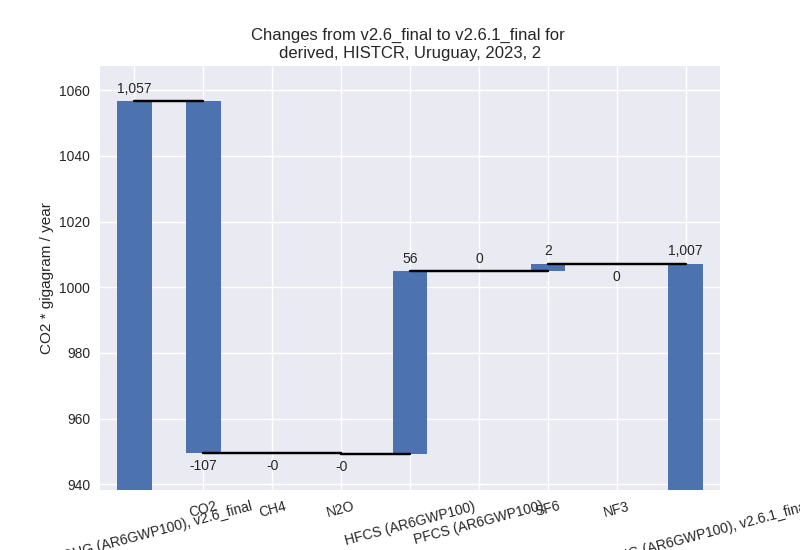
- 2: Total sectoral emissions in 2022 are 980.58 Gg
CO2 / year which is 2.6% of M.0.EL emissions. 2023 Emissions have
changed by -4.7% (-49.48 Gg CO2 /
year). 1990-2023 Emissions have changed by -4.0% (-21.25 Gg CO2 / year). For 2023 the
changes per gas
are:
For 1990-2023 the changes per gas are: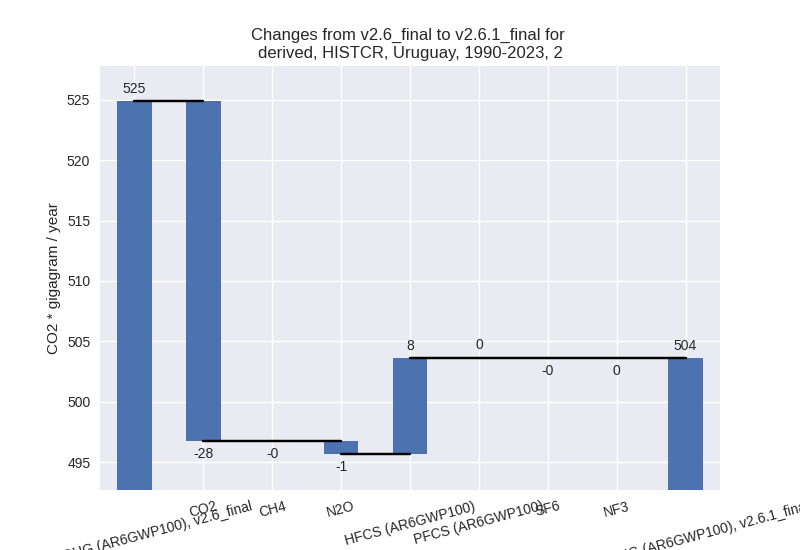
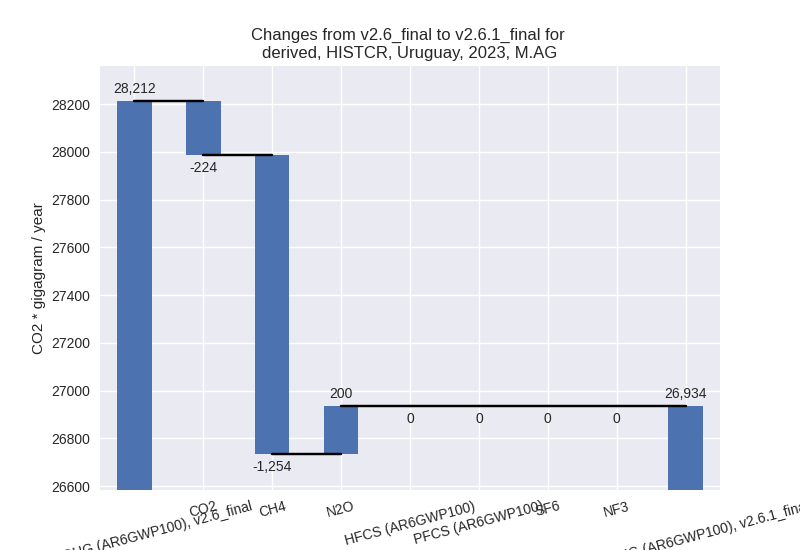
- M.AG: Total sectoral emissions in 2022 are 27513.89
Gg CO2 / year which is 72.6% of M.0.EL emissions. 2023 Emissions have
changed by -4.5% (-1277.99 Gg CO2 /
year). 1990-2023 Emissions have changed by -0.0% (-2.82 Gg CO2 / year). For 2023 the
changes per gas
are:
The changes come from the following subsectors:- 3.A: Total sectoral emissions in 2022 are 19312.69
Gg CO2 / year which is 70.2% of category M.AG emissions. 2023 Emissions
have changed by -6.6% (-1323.04 Gg
CO2 / year). 1990-2023 Emissions have changed by -0.3% (-50.39 Gg CO2 / year). For 2023 the
changes per gas
are:

There is no subsector information available in PRIMAP-hist. - M.AG.ELV: Total sectoral emissions in 2022 are 8201.19 Gg CO2 / year which is 29.8% of category M.AG emissions. 2023 Emissions have changed by 0.5% (45.04 Gg CO2 / year). 1990-2023 Emissions have changed by 0.6% (47.57 Gg CO2 / year).
- 3.A: Total sectoral emissions in 2022 are 19312.69
Gg CO2 / year which is 70.2% of category M.AG emissions. 2023 Emissions
have changed by -6.6% (-1323.04 Gg
CO2 / year). 1990-2023 Emissions have changed by -0.3% (-50.39 Gg CO2 / year). For 2023 the
changes per gas
are:
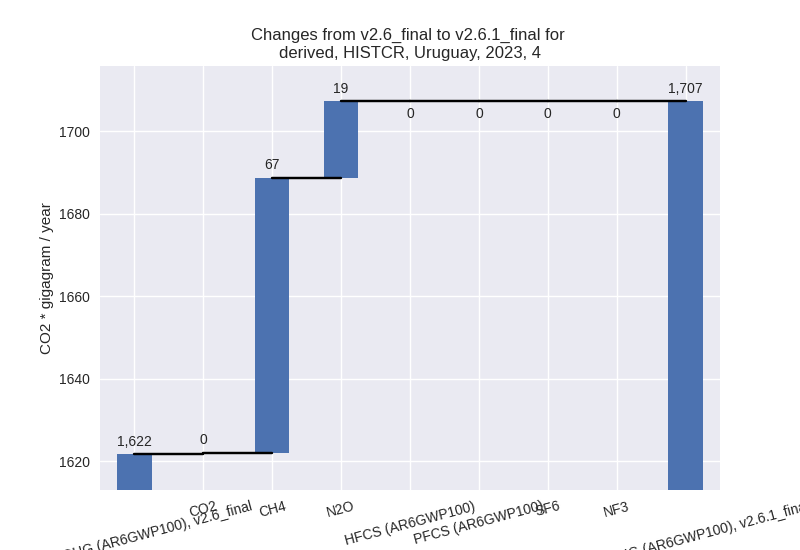
- 4: Total sectoral emissions in 2022 are 1704.05 Gg
CO2 / year which is 4.5% of M.0.EL emissions. 2023 Emissions have
changed by 5.3% (85.62 Gg CO2 /
year). 1990-2023 Emissions have changed by -0.2% (-2.49 Gg CO2 / year). For 2023 the
changes per gas
are:
- 5: Total sectoral emissions in 2022 are 134.72 Gg
CO2 / year which is 0.4% of M.0.EL emissions. 2023 Emissions have
changed by -0.9% (-1.16 Gg CO2 /
year). 1990-2023 Emissions have changed by 2.2% (1.83 Gg CO2 / year). For 1990-2023
the changes per gas
are:

third party scenario (HISTTP):
Most important changes per time frame
For 2023 the following sector-gas combinations have the highest absolute impact on national total KyotoGHG (AR6GWP100) emissions in 2023 (top 5):
- 1: 4, CH4 with -1732.92 Gg CO2 / year (-29.6%)
- 2: 3.A, CH4 with -1343.03 Gg CO2 / year (-6.5%)
- 3: M.AG.ELV, N2O with -581.94 Gg CO2 / year (-7.6%)
- 4: M.AG.ELV, CO2 with 253.98 Gg CO2 / year (62.4%)
- 5: M.AG.ELV, CH4 with 152.35 Gg CO2 / year (14.7%)
For 1990-2023 the following sector-gas combinations have the highest absolute impact on national total KyotoGHG (AR6GWP100) emissions in 1990-2023 (top 5):
- 1: 4, CH4 with -770.82 Gg CO2 / year (-31.7%)
- 2: 3.A, CH4 with -57.45 Gg CO2 / year (-0.3%)
- 3: M.AG.ELV, N2O with -35.49 Gg CO2 / year (-0.5%)
- 4: 1.B.2, CO2 with 28.25 Gg CO2 / year (1636269.3%)
- 5: M.AG.ELV, CO2 with 22.83 Gg CO2 / year (14.9%)
Changes in the main sectors for aggregate KyotoGHG (AR6GWP100) are
- 1: Total sectoral emissions in 2022 are 8180.99 Gg CO2 / year which is 19.6% of M.0.EL emissions. 2023 Emissions have changed by 0.3% (28.82 Gg CO2 / year). 1990-2023 Emissions have changed by 0.5% (30.25 Gg CO2 / year).
- 2: Total sectoral emissions in 2022 are 610.08 Gg CO2 / year which is 1.5% of M.0.EL emissions. 2023 Emissions have changed by 0.1% (0.81 Gg CO2 / year). 1990-2023 Emissions have changed by 1.9% (8.37 Gg CO2 / year).
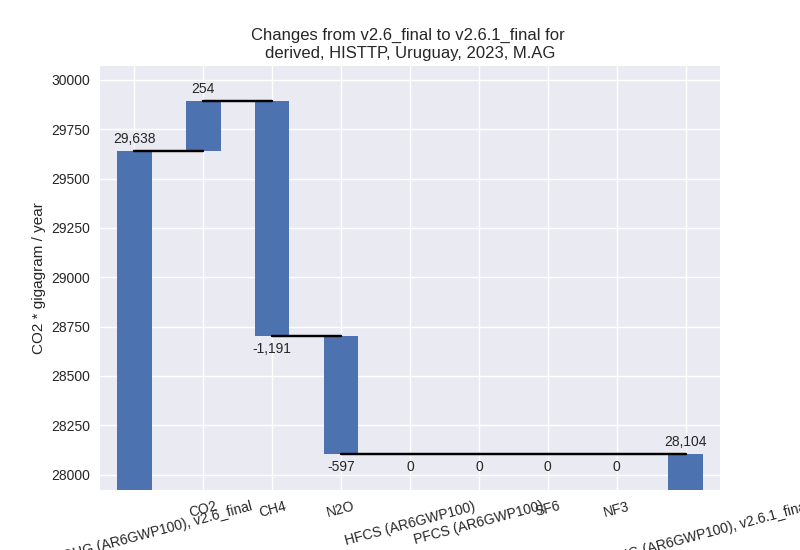
- M.AG: Total sectoral emissions in 2022 are 28681.35
Gg CO2 / year which is 68.6% of M.0.EL emissions. 2023 Emissions have
changed by -5.2% (-1533.95 Gg CO2 /
year). 1990-2023 Emissions have changed by -0.2% (-65.13 Gg CO2 / year). For 2023 the
changes per gas
are:
The changes come from the following subsectors:- 3.A: Total sectoral emissions in 2022 are 19869.75
Gg CO2 / year which is 69.3% of category M.AG emissions. 2023 Emissions
have changed by -6.6% (-1358.35 Gg
CO2 / year). 1990-2023 Emissions have changed by -0.3% (-59.30 Gg CO2 / year). For 2023 the
changes per gas
are:
There is no subsector information available in PRIMAP-hist. - M.AG.ELV: Total sectoral emissions in 2022 are 8811.60 Gg CO2 / year which is 30.7% of category M.AG emissions. 2023 Emissions have changed by -1.9% (-175.61 Gg CO2 / year). 1990-2023 Emissions have changed by -0.1% (-5.82 Gg CO2 / year).
- 3.A: Total sectoral emissions in 2022 are 19869.75
Gg CO2 / year which is 69.3% of category M.AG emissions. 2023 Emissions
have changed by -6.6% (-1358.35 Gg
CO2 / year). 1990-2023 Emissions have changed by -0.3% (-59.30 Gg CO2 / year). For 2023 the
changes per gas
are:
- 4: Total sectoral emissions in 2022 are 4182.01 Gg
CO2 / year which is 10.0% of M.0.EL emissions. 2023 Emissions have
changed by -29.2% (-1729.15 Gg CO2 /
year). 1990-2023 Emissions have changed by -31.1% (-770.44 Gg CO2 / year). For 2023
the changes per gas
are:

For 1990-2023 the changes per gas are:
- 5: Total sectoral emissions in 2022 are 134.72 Gg
CO2 / year which is 0.3% of M.0.EL emissions. 2023 Emissions have
changed by -0.9% (-1.16 Gg CO2 /
year). 1990-2023 Emissions have changed by 2.2% (1.83 Gg CO2 / year). For 1990-2023
the changes per gas
are: