Changes in PRIMAP-hist v2.6.1_final compared to v2.6_final for Holy See (Vatican City State)
2025-03-19
Johannes Gütschow
Change analysis for Holy See (Vatican City State) for PRIMAP-hist v2.6.1_final compared to v2.6_final
Overview over emissions by sector and gas
The following figures show the aggregate national total emissions excluding LULUCF AR6GWP100 for the country reported priority scenario. The dotted linesshow the v2.6_final data.
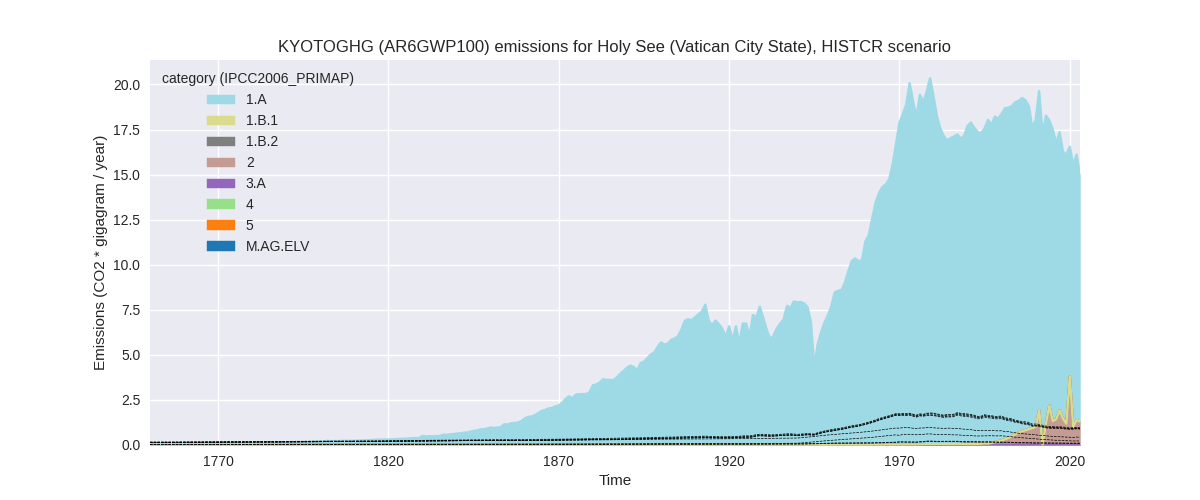
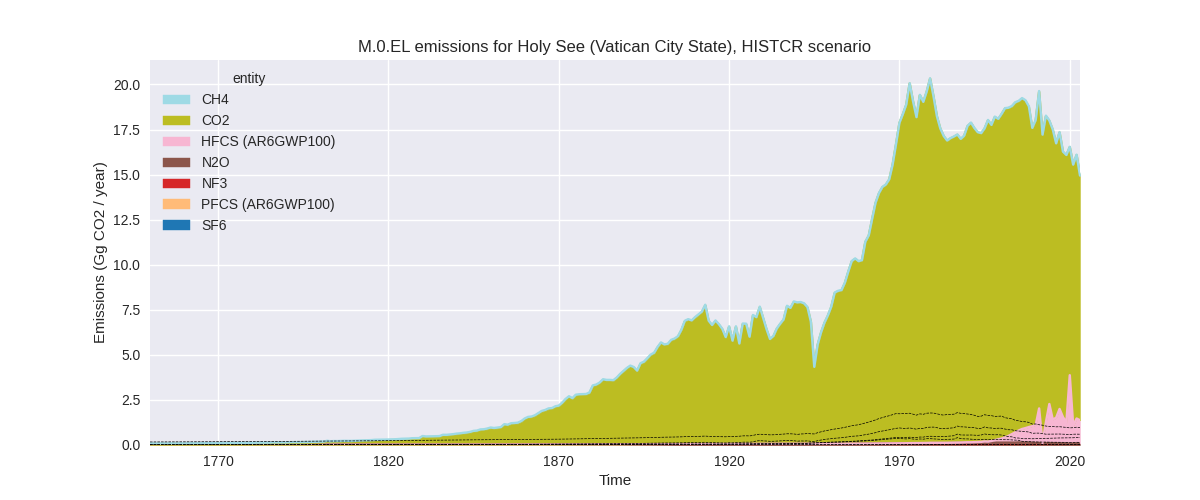
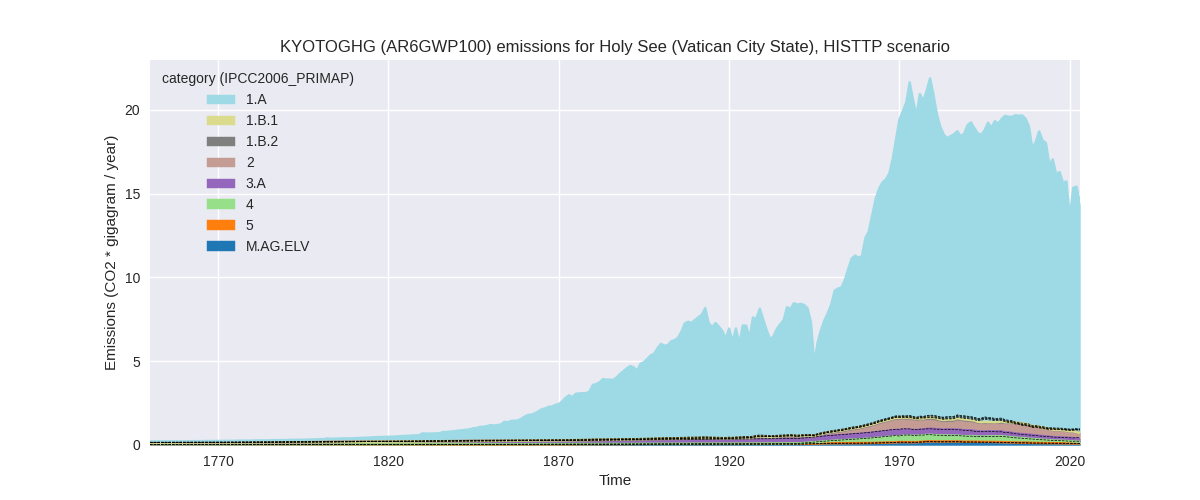
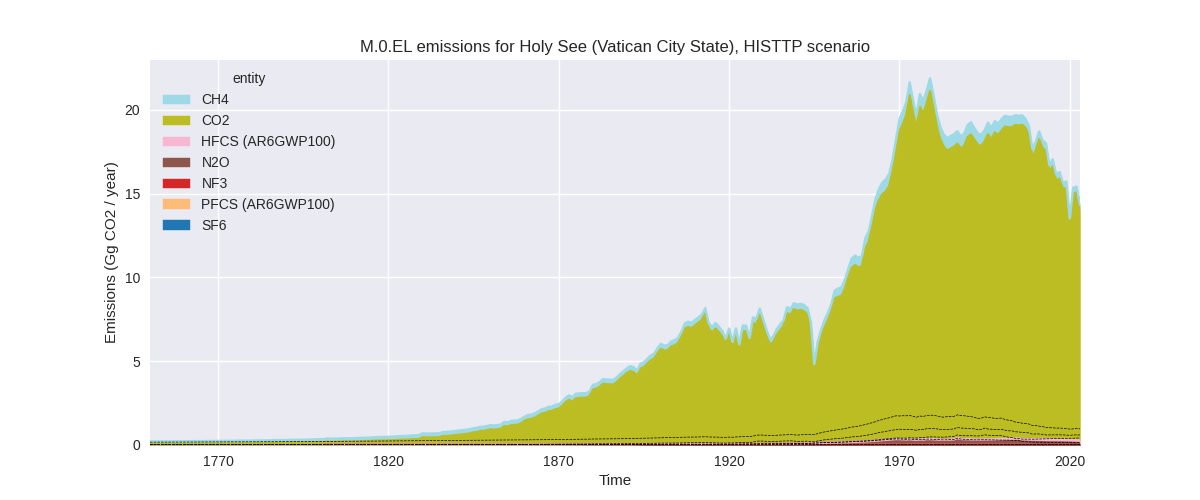
The following figures show the aggregate national total emissions excluding LULUCF AR6GWP100 for the third party priority scenario. The dotted linesshow the v2.6_final data.
Overview over changes
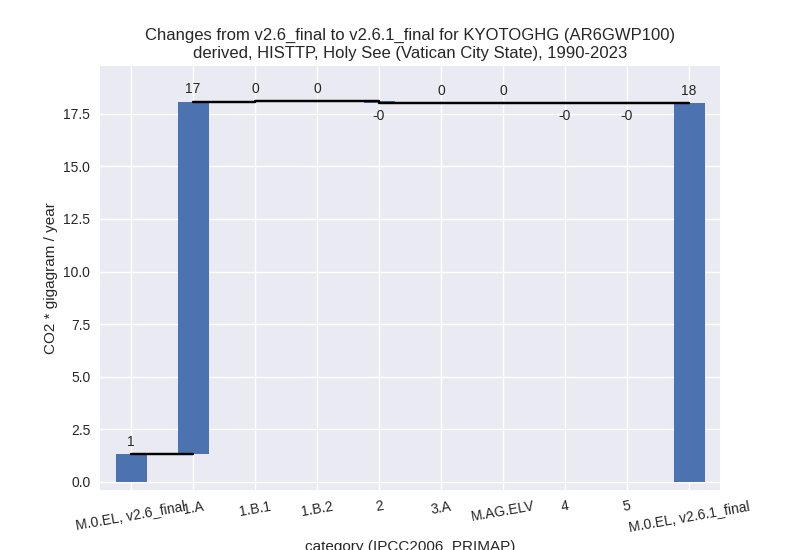
In the country reported priority scenario we have the following changes for aggregate Kyoto GHG and national total emissions excluding LULUCF (M.0.EL):
- Emissions in 2023 have changed by 1452.8%% (13.98 Gg CO2 / year)
- Emissions in 1990-2023 have changed by 1255.8%% (16.43 Gg CO2 / year)
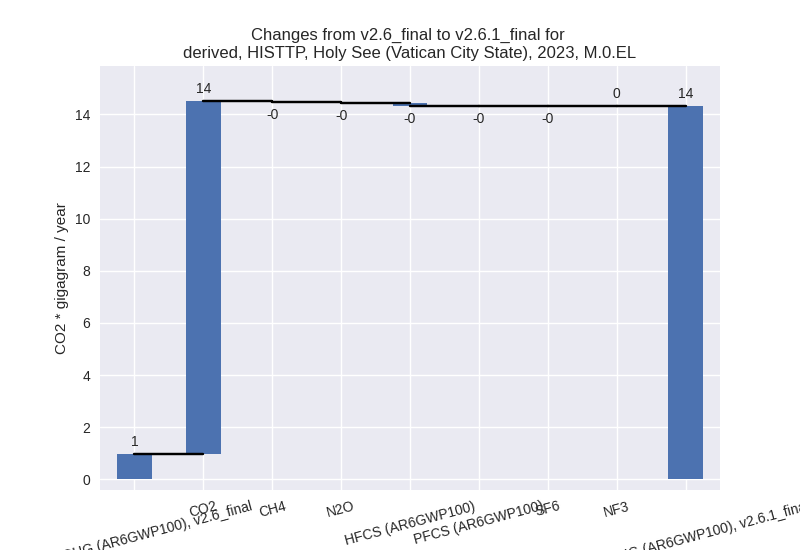
In the third party priority scenario we have the following changes for aggregate Kyoto GHG and national total emissions excluding LULUCF (M.0.EL):
- Emissions in 2023 have changed by 1387.2%% (13.35 Gg CO2 / year)
- Emissions in 1990-2023 have changed by 1276.0%% (16.69 Gg CO2 / year)
Most important changes per scenario and time frame
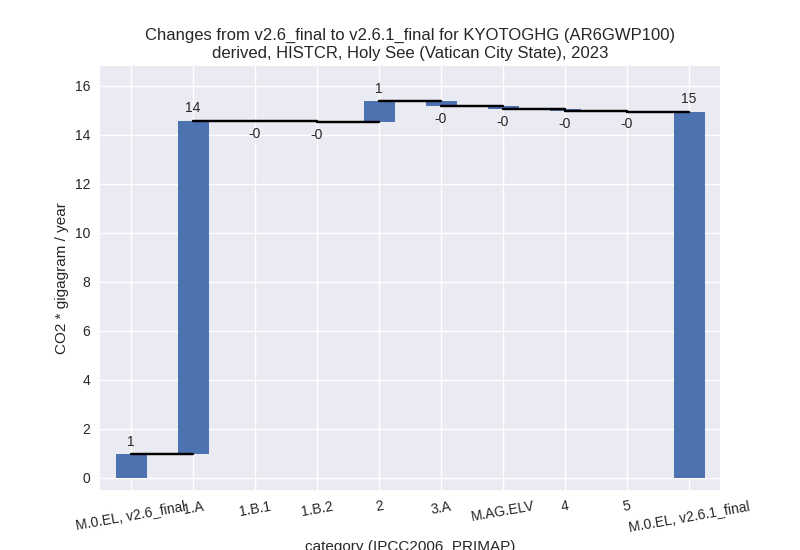
In the country reported priority scenario the following sector-gas combinations have the highest absolute impact on national total KyotoGHG (AR6GWP100) emissions in 2023 (top 5):
- 1: 1.A, CO2 with 13.54 Gg CO2 / year (inf%)
- 2: 2, HFCS (AR6GWP100) with 1.02 Gg CO2 / year (380.9%)
- 3: 3.A, CH4 with -0.19 Gg CO2 / year (-100.0%)
- 4: 2, CO2 with -0.17 Gg CO2 / year (-100.0%)
- 5: 4, CH4 with -0.10 Gg CO2 / year (-100.0%)
In the country reported priority scenario the following sector-gas combinations have the highest absolute impact on national total KyotoGHG (AR6GWP100) emissions in 1990-2023 (top 5):
- 1: 1.A, CO2 with 16.78 Gg CO2 / year (inf%)
- 2: 2, HFCS (AR6GWP100) with 0.59 Gg CO2 / year (268.9%)
- 3: 2, CO2 with -0.28 Gg CO2 / year (-100.0%)
- 4: 4, CH4 with -0.23 Gg CO2 / year (-100.0%)
- 5: 3.A, CH4 with -0.23 Gg CO2 / year (-100.0%)
In the third party priority scenario the following sector-gas combinations have the highest absolute impact on national total KyotoGHG (AR6GWP100) emissions in 2023 (top 5):
- 1: 1.A, CO2 with 13.54 Gg CO2 / year (inf%)
- 2: 2, HFCS (AR6GWP100) with -0.13 Gg CO2 / year (-48.7%)
- 3: 3.A, CH4 with -0.02 Gg CO2 / year (-12.2%)
- 4: 4, CH4 with -0.01 Gg CO2 / year (-11.1%)
- 5: M.AG.ELV, N2O with -0.01 Gg CO2 / year (-12.3%)
In the third party priority scenario the following sector-gas combinations have the highest absolute impact on national total KyotoGHG (AR6GWP100) emissions in 1990-2023 (top 5):
- 1: 1.A, CO2 with 16.78 Gg CO2 / year (inf%)
- 2: 2, HFCS (AR6GWP100) with -0.11 Gg CO2 / year (-51.7%)
- 3: 1.B.2, CO2 with 0.01 Gg CO2 / year (348.0%)
- 4: 2, CO2 with 0.01 Gg CO2 / year (3.6%)
- 5: 3.A, CH4 with 0.01 Gg CO2 / year (2.4%)
Notes on data changes
Here we list notes explaining important emissions changes for the country.
- CRT data from BTR1 covering 2011 - 2022 has been included. It is the
first country reported data for Vatican City State. CRT data differs
strongly from the EDGAR data we use for the TP time-series which is not
surprising as the EDGAR data is actually downscaled from Italy using
population data thus assuming emissions in the same sectors as for
Italy.
- CRT data reports emission only for the energy sector. Emissions in all other sectors are zero.
- The TP time-series has high changes as well as energy CO2 emissions were missing in the last PRIMAP-hist version.
Changes by sector and gas
For each scenario and time frame the changes are displayed for all individual sectors and all individual gases. In the sector plot we use aggregate Kyoto GHGs in AR6GWP100. In the gas plot we usenational total emissions without LULUCF.
country reported scenario
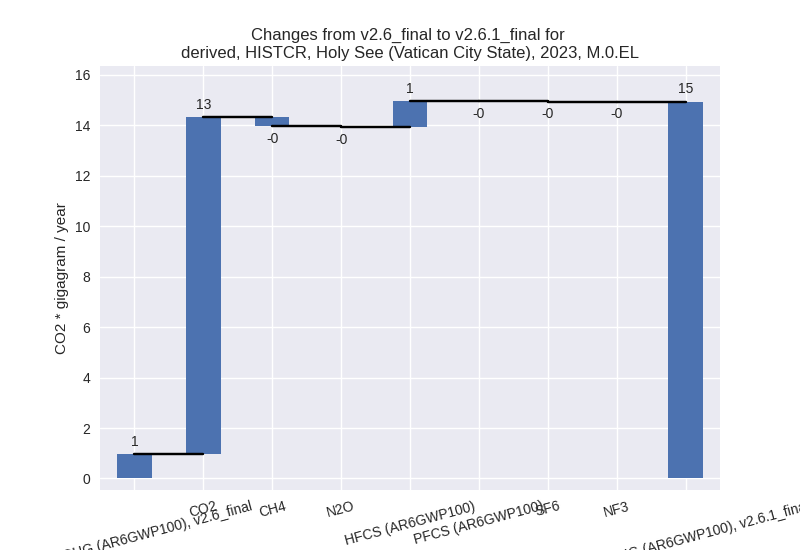
2023
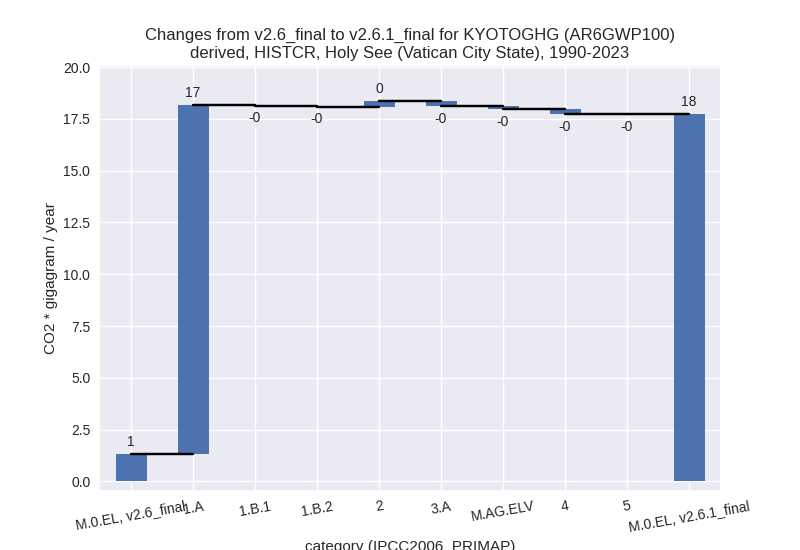
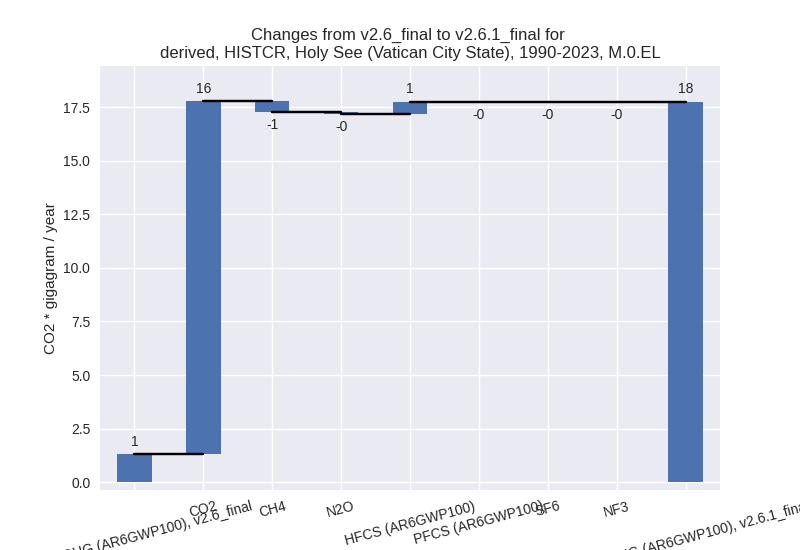
1990-2023
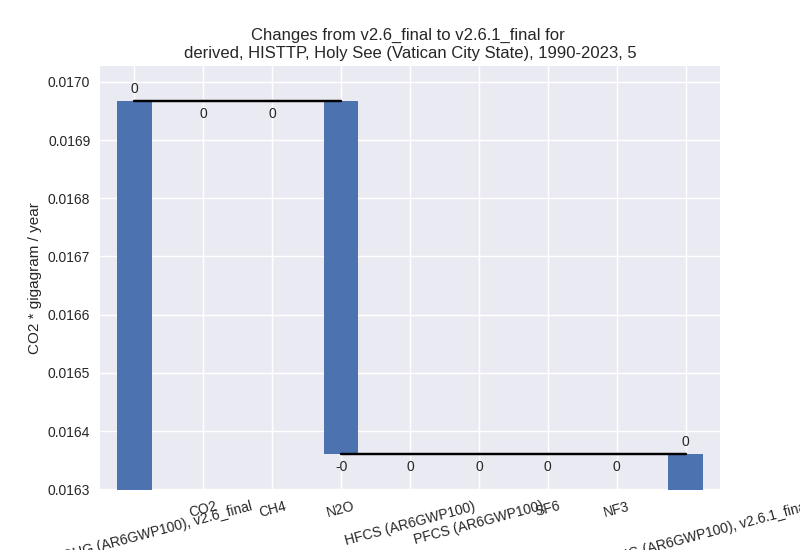
third party scenario
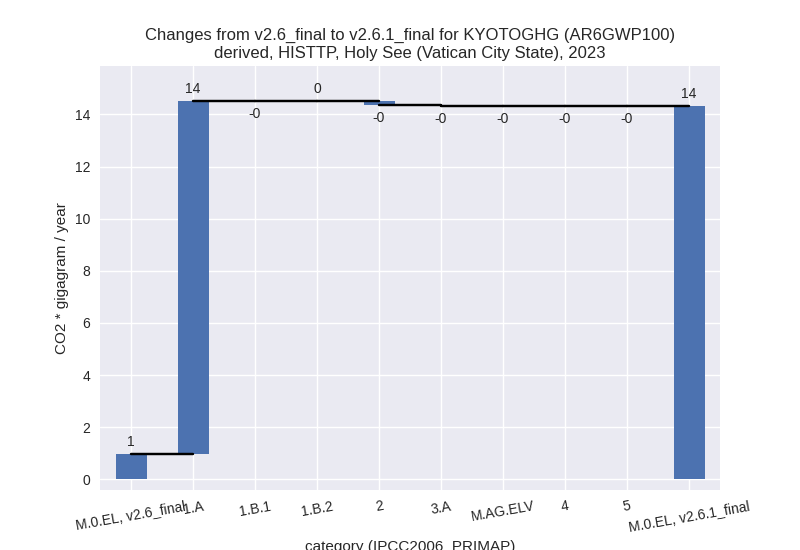
2023
1990-2023

Detailed changes for the scenarios:
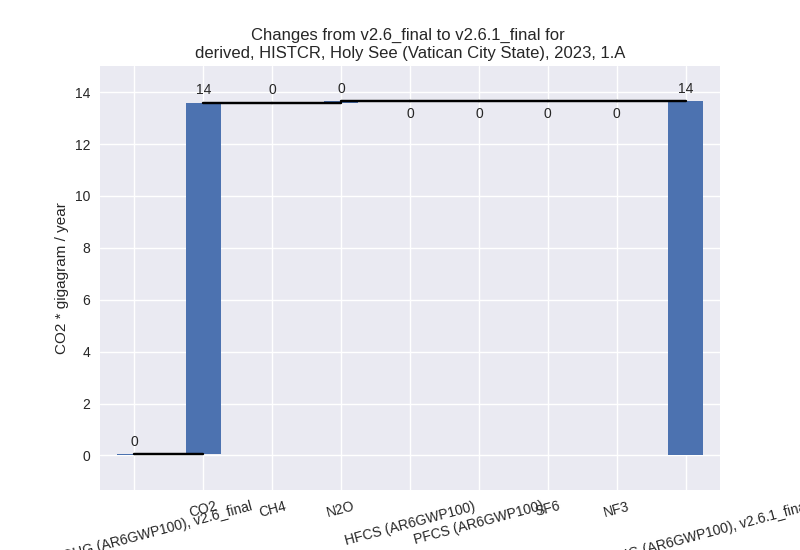
country reported scenario (HISTCR):
Most important changes per time frame
For 2023 the following sector-gas combinations have the highest absolute impact on national total KyotoGHG (AR6GWP100) emissions in 2023 (top 5):
- 1: 1.A, CO2 with 13.54 Gg CO2 / year (inf%)
- 2: 2, HFCS (AR6GWP100) with 1.02 Gg CO2 / year (380.9%)
- 3: 3.A, CH4 with -0.19 Gg CO2 / year (-100.0%)
- 4: 2, CO2 with -0.17 Gg CO2 / year (-100.0%)
- 5: 4, CH4 with -0.10 Gg CO2 / year (-100.0%)
For 1990-2023 the following sector-gas combinations have the highest absolute impact on national total KyotoGHG (AR6GWP100) emissions in 1990-2023 (top 5):
- 1: 1.A, CO2 with 16.78 Gg CO2 / year (inf%)
- 2: 2, HFCS (AR6GWP100) with 0.59 Gg CO2 / year (268.9%)
- 3: 2, CO2 with -0.28 Gg CO2 / year (-100.0%)
- 4: 4, CH4 with -0.23 Gg CO2 / year (-100.0%)
- 5: 3.A, CH4 with -0.23 Gg CO2 / year (-100.0%)
Changes in the main sectors for aggregate KyotoGHG (AR6GWP100) are
- 1: Total sectoral emissions in 2022 are 14.71 Gg
CO2 / year which is 91.4% of M.0.EL emissions. 2023 Emissions have
changed by 15765.6% (13.56 Gg CO2 /
year). 1990-2023 Emissions have changed by 14287.7% (16.79 Gg CO2 / year). For 2023
the changes per gas
are:

For 1990-2023 the changes per gas are: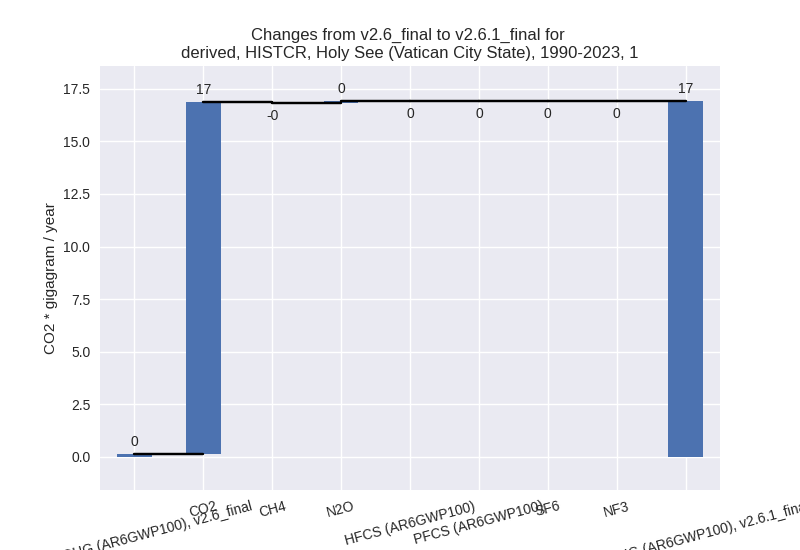
The changes come from the following subsectors:- 1.A: Total sectoral emissions in 2022 are 14.71 Gg
CO2 / year which is 100.0% of category 1 emissions. 2023 Emissions have
changed by 29373.4% (13.60 Gg CO2 /
year). 1990-2023 Emissions have changed by 32827.4% (16.86 Gg CO2 / year). For 2023
the changes per gas
are:
For 1990-2023 the changes per gas are:
There is no subsector information available in PRIMAP-hist. - 1.B.1: Total sectoral emissions in 2022 are 0.00 Gg
CO2 / year which is 0.0% of category 1 emissions. 2023 Emissions have
changed by -100.0% (-0.00 Gg CO2 /
year). 1990-2023 Emissions have changed by -100.0% (-0.02 Gg CO2 / year). For 2023
the changes per gas
are:
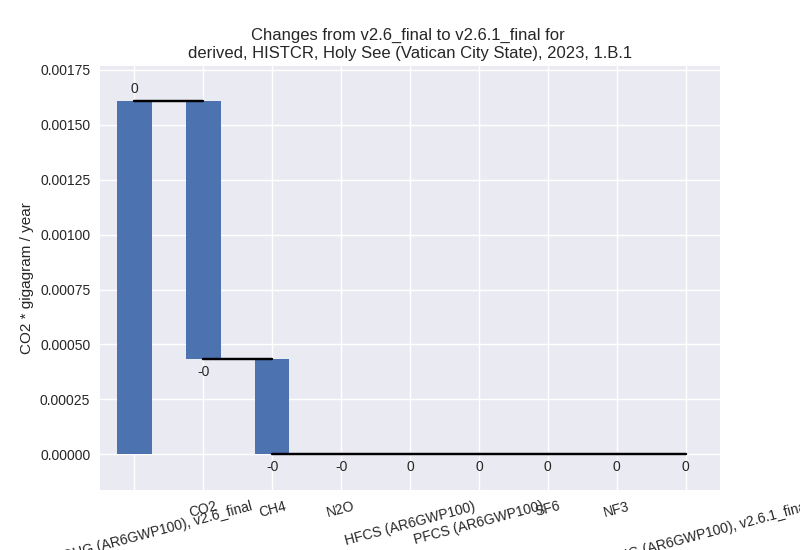
For 1990-2023 the changes per gas are: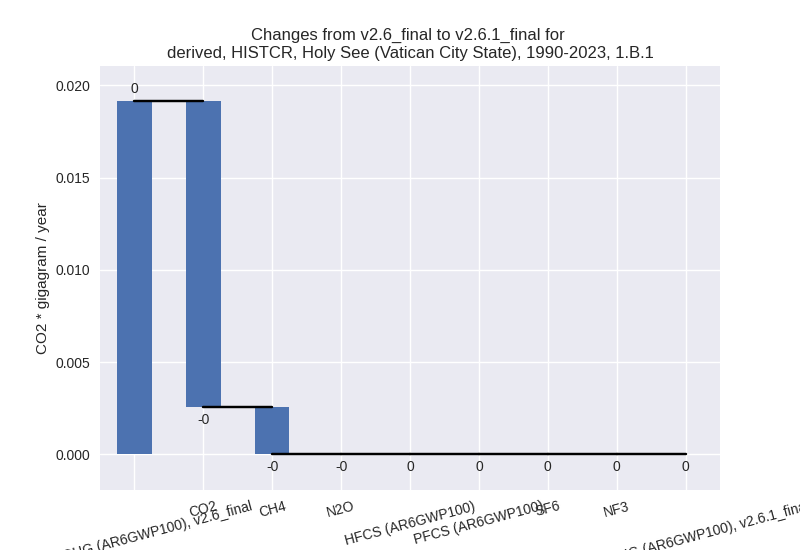
There is no subsector information available in PRIMAP-hist. - 1.B.2: Total sectoral emissions in 2022 are 0.00 Gg
CO2 / year which is 0.0% of category 1 emissions. 2023 Emissions have
changed by -100.0% (-0.04 Gg CO2 /
year). 1990-2023 Emissions have changed by -100.0% (-0.05 Gg CO2 / year). For 2023
the changes per gas
are:

For 1990-2023 the changes per gas are: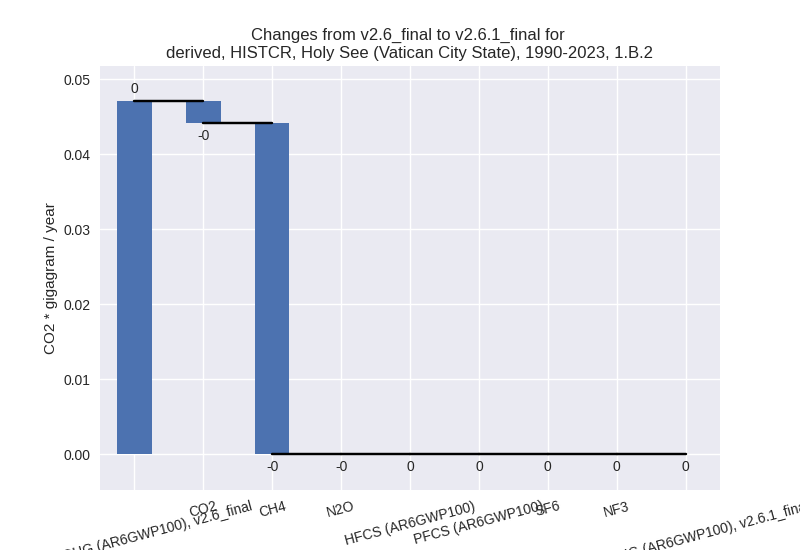
There is no subsector information available in PRIMAP-hist.
- 1.A: Total sectoral emissions in 2022 are 14.71 Gg
CO2 / year which is 100.0% of category 1 emissions. 2023 Emissions have
changed by 29373.4% (13.60 Gg CO2 /
year). 1990-2023 Emissions have changed by 32827.4% (16.86 Gg CO2 / year). For 2023
the changes per gas
are:
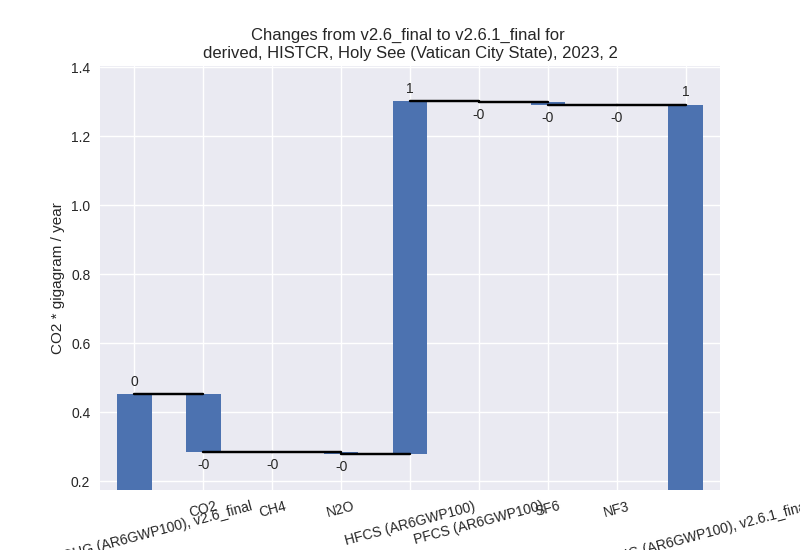
- 2: Total sectoral emissions in 2022 are 1.38 Gg CO2
/ year which is 8.6% of M.0.EL emissions. 2023 Emissions have changed by
185.0% (0.84 Gg CO2 / year).
1990-2023 Emissions have changed by 45.1% (0.25 Gg CO2 / year). For 2023 the
changes per gas
are:
For 1990-2023 the changes per gas are: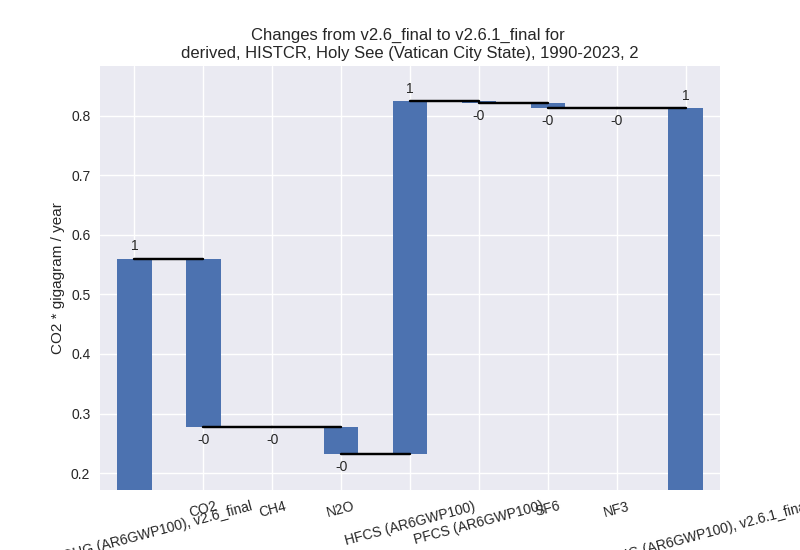
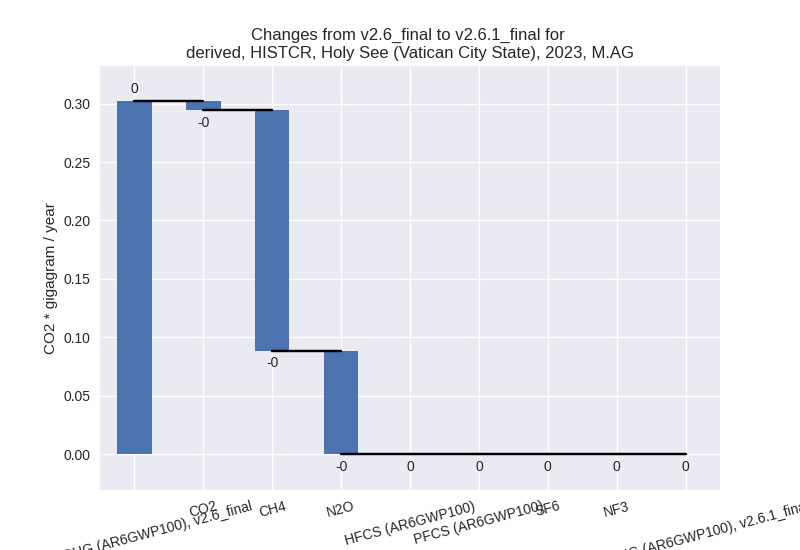
- M.AG: Total sectoral emissions in 2022 are 0.00 Gg
CO2 / year which is 0.0% of M.0.EL emissions. 2023 Emissions have
changed by -100.0% (-0.30 Gg CO2 /
year). 1990-2023 Emissions have changed by -100.0% (-0.37 Gg CO2 / year). For 2023
the changes per gas
are:
For 1990-2023 the changes per gas are: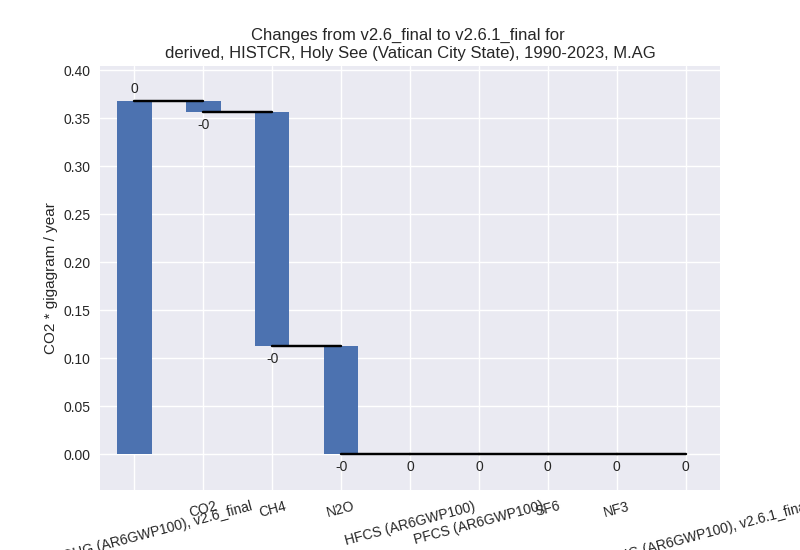
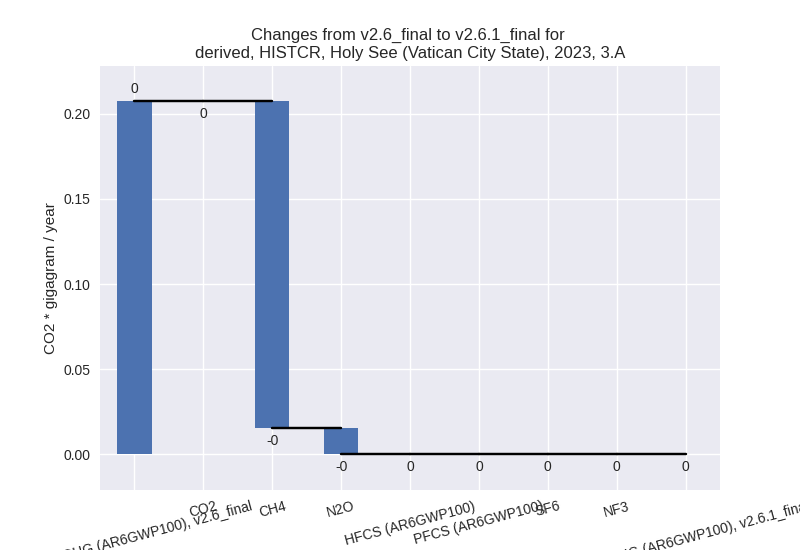
The changes come from the following subsectors:- 3.A: Total sectoral emissions in 2022 are 0.00 Gg
CO2 / year which is nan% of category M.AG emissions. 2023 Emissions have
changed by -100.0% (-0.21 Gg CO2 /
year). 1990-2023 Emissions have changed by -100.0% (-0.24 Gg CO2 / year). For 2023
the changes per gas
are:
For 1990-2023 the changes per gas are: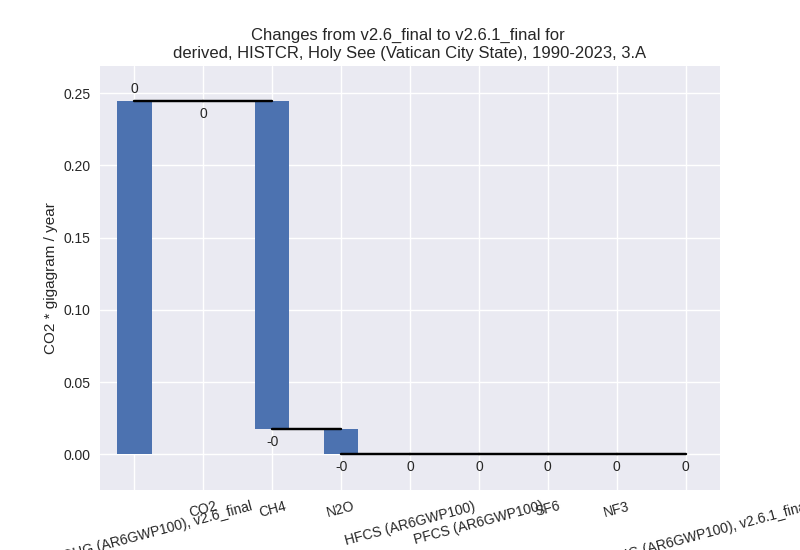
There is no subsector information available in PRIMAP-hist. - M.AG.ELV: Total sectoral emissions in 2022 are 0.00
Gg CO2 / year which is nan% of category M.AG emissions. 2023 Emissions
have changed by -100.0% (-0.09 Gg
CO2 / year). 1990-2023 Emissions have changed by -100.0% (-0.12 Gg CO2 / year). For 2023
the changes per gas
are:
For 1990-2023 the changes per gas are: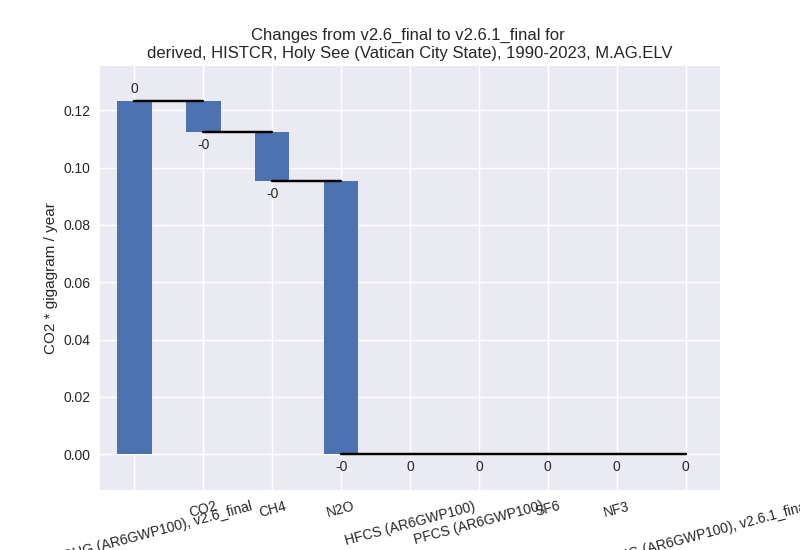
There is no subsector information available in PRIMAP-hist.
- 3.A: Total sectoral emissions in 2022 are 0.00 Gg
CO2 / year which is nan% of category M.AG emissions. 2023 Emissions have
changed by -100.0% (-0.21 Gg CO2 /
year). 1990-2023 Emissions have changed by -100.0% (-0.24 Gg CO2 / year). For 2023
the changes per gas
are:
- 4: Total sectoral emissions in 2022 are 0.00 Gg CO2
/ year which is 0.0% of M.0.EL emissions. 2023 Emissions have changed by
-100.0% (-0.11 Gg CO2 / year).
1990-2023 Emissions have changed by -100.0% (-0.25 Gg CO2 / year). For 2023
the changes per gas
are:
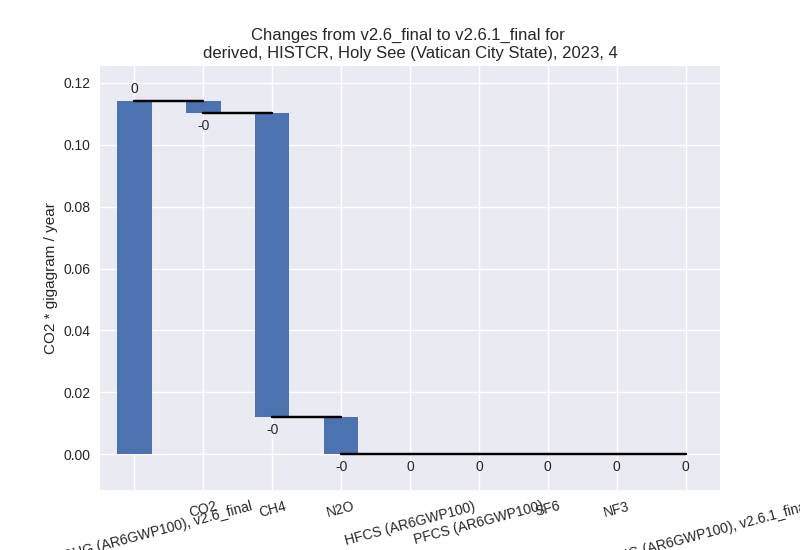
For 1990-2023 the changes per gas are: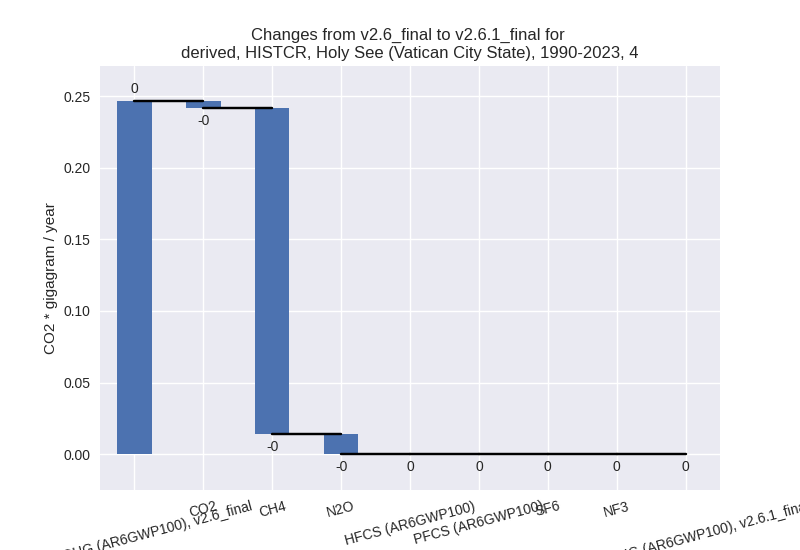
- 5: Total sectoral emissions in 2022 are 0.01 Gg CO2
/ year which is 0.0% of M.0.EL emissions. 2023 Emissions have changed by
-14.9% (-0.00 Gg CO2 / year).
1990-2023 Emissions have changed by -3.6% (-0.00 Gg CO2 / year). For 2023 the
changes per gas
are:

For 1990-2023 the changes per gas are:
third party scenario (HISTTP):
Most important changes per time frame
For 2023 the following sector-gas combinations have the highest absolute impact on national total KyotoGHG (AR6GWP100) emissions in 2023 (top 5):
- 1: 1.A, CO2 with 13.54 Gg CO2 / year (inf%)
- 2: 2, HFCS (AR6GWP100) with -0.13 Gg CO2 / year (-48.7%)
- 3: 3.A, CH4 with -0.02 Gg CO2 / year (-12.2%)
- 4: 4, CH4 with -0.01 Gg CO2 / year (-11.1%)
- 5: M.AG.ELV, N2O with -0.01 Gg CO2 / year (-12.3%)
For 1990-2023 the following sector-gas combinations have the highest absolute impact on national total KyotoGHG (AR6GWP100) emissions in 1990-2023 (top 5):
- 1: 1.A, CO2 with 16.78 Gg CO2 / year (inf%)
- 2: 2, HFCS (AR6GWP100) with -0.11 Gg CO2 / year (-51.7%)
- 3: 1.B.2, CO2 with 0.01 Gg CO2 / year (348.0%)
- 4: 2, CO2 with 0.01 Gg CO2 / year (3.6%)
- 5: 3.A, CH4 with 0.01 Gg CO2 / year (2.4%)
Changes in the main sectors for aggregate KyotoGHG (AR6GWP100) are
- 1: Total sectoral emissions in 2022 are 14.69 Gg
CO2 / year which is 95.3% of M.0.EL emissions. 2023 Emissions have
changed by 15740.7% (13.54 Gg CO2 /
year). 1990-2023 Emissions have changed by 14284.3% (16.79 Gg CO2 / year). For 2023
the changes per gas
are:

For 1990-2023 the changes per gas are: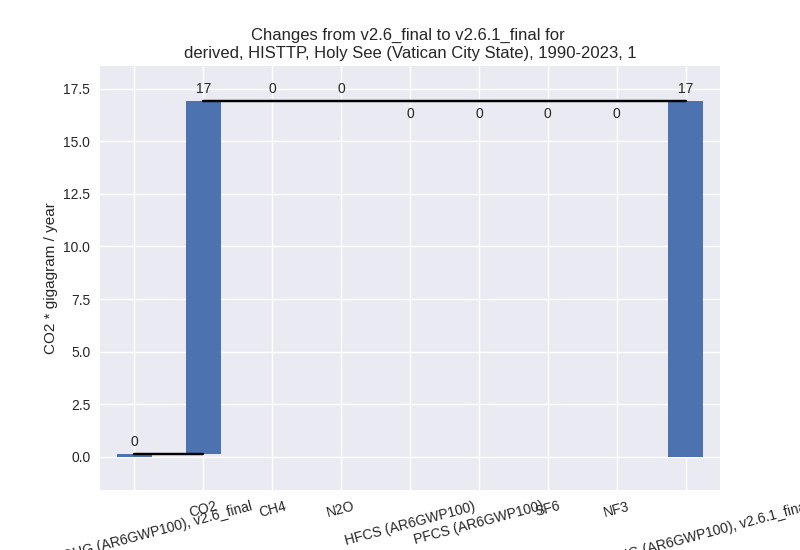
The changes come from the following subsectors:- 1.A: Total sectoral emissions in 2022 are 14.65 Gg
CO2 / year which is 99.7% of category 1 emissions. 2023 Emissions have
changed by 29241.1% (13.54 Gg CO2 /
year). 1990-2023 Emissions have changed by 32670.9% (16.78 Gg CO2 / year). For 2023
the changes per gas
are:
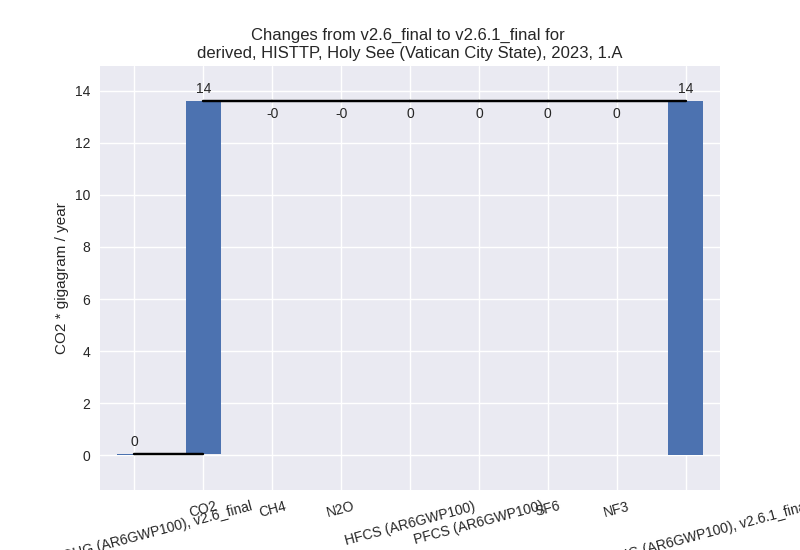
For 1990-2023 the changes per gas are:
There is no subsector information available in PRIMAP-hist. - 1.B.1: Total sectoral emissions in 2022 are 0.00 Gg
CO2 / year which is 0.0% of category 1 emissions. 2023 Emissions have
changed by -15.3% (-0.00 Gg CO2 /
year). 1990-2023 Emissions have changed by 8.3% (0.00 Gg CO2 / year). For 2023 the
changes per gas
are:
For 1990-2023 the changes per gas are: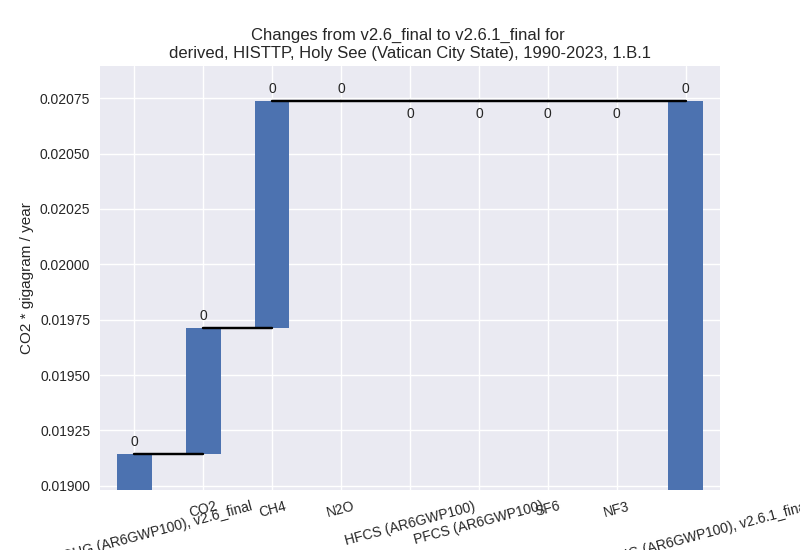
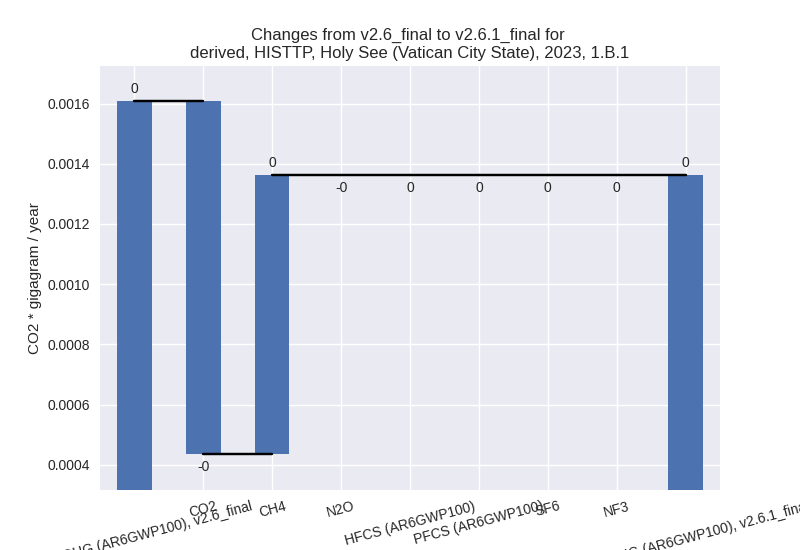
There is no subsector information available in PRIMAP-hist. - 1.B.2: Total sectoral emissions in 2022 are 0.04 Gg
CO2 / year which is 0.3% of category 1 emissions. 2023 Emissions have
changed by 1.0% (0.00 Gg CO2 /
year). 1990-2023 Emissions have changed by 18.4% (0.01 Gg CO2 / year). For 1990-2023
the changes per gas
are:
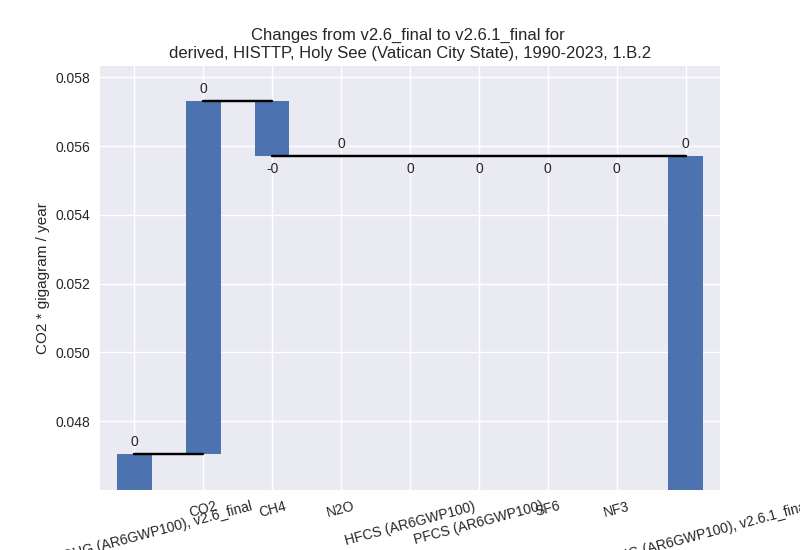
There is no subsector information available in PRIMAP-hist.
- 1.A: Total sectoral emissions in 2022 are 14.65 Gg
CO2 / year which is 99.7% of category 1 emissions. 2023 Emissions have
changed by 29241.1% (13.54 Gg CO2 /
year). 1990-2023 Emissions have changed by 32670.9% (16.78 Gg CO2 / year). For 2023
the changes per gas
are:
- 2: Total sectoral emissions in 2022 are 0.33 Gg CO2
/ year which is 2.1% of M.0.EL emissions. 2023 Emissions have changed by
-31.0% (-0.14 Gg CO2 / year).
1990-2023 Emissions have changed by -18.2% (-0.10 Gg CO2 / year). For 2023 the
changes per gas
are:
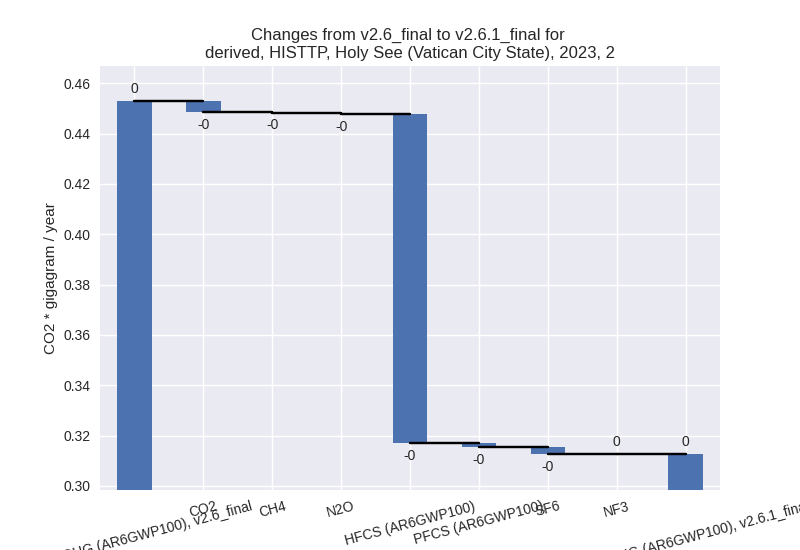
For 1990-2023 the changes per gas are: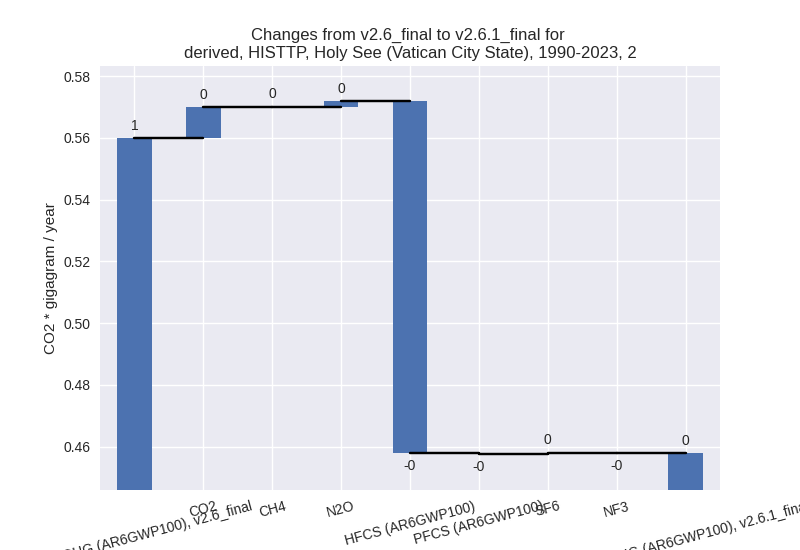
- M.AG: Total sectoral emissions in 2022 are 0.27 Gg
CO2 / year which is 1.8% of M.0.EL emissions. 2023 Emissions have
changed by -12.1% (-0.04 Gg CO2 /
year). 1990-2023 Emissions have changed by 2.5% (0.01 Gg CO2 / year). For 2023 the
changes per gas
are:
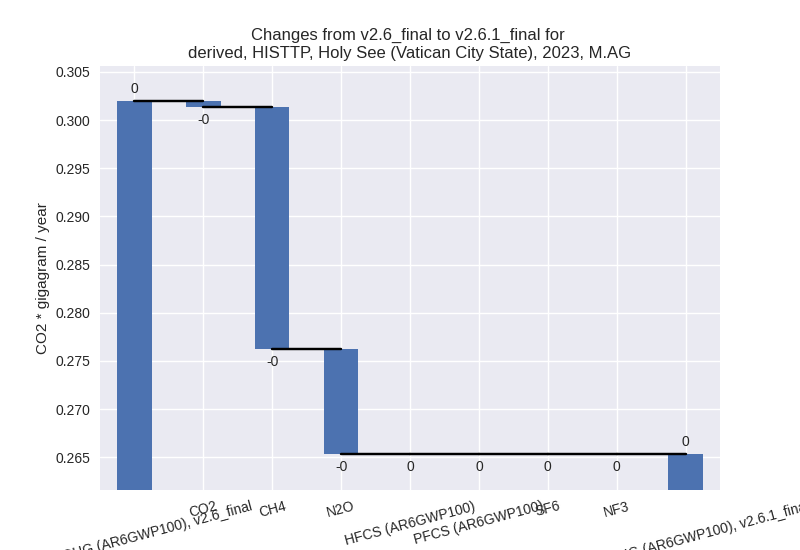
For 1990-2023 the changes per gas are: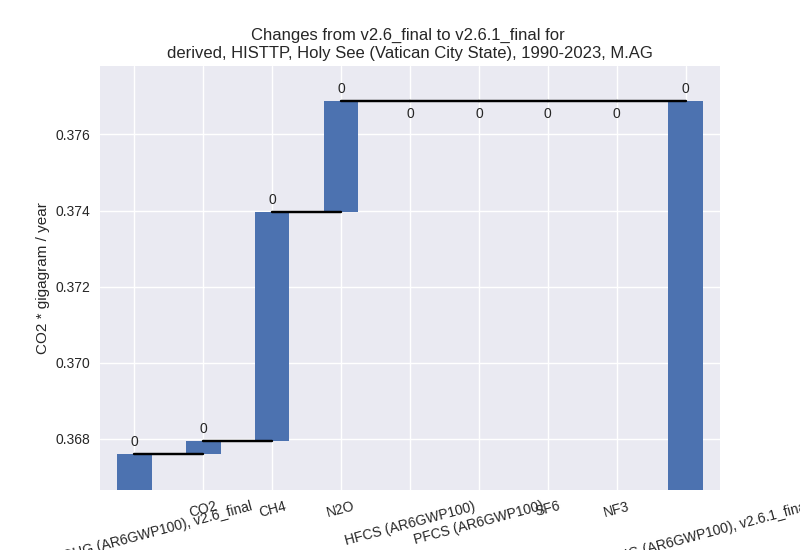
The changes come from the following subsectors:- 3.A: Total sectoral emissions in 2022 are 0.19 Gg
CO2 / year which is 68.7% of category M.AG emissions. 2023 Emissions
have changed by -12.2% (-0.03 Gg CO2
/ year). 1990-2023 Emissions have changed by 2.4% (0.01 Gg CO2 / year). For 2023 the
changes per gas
are:
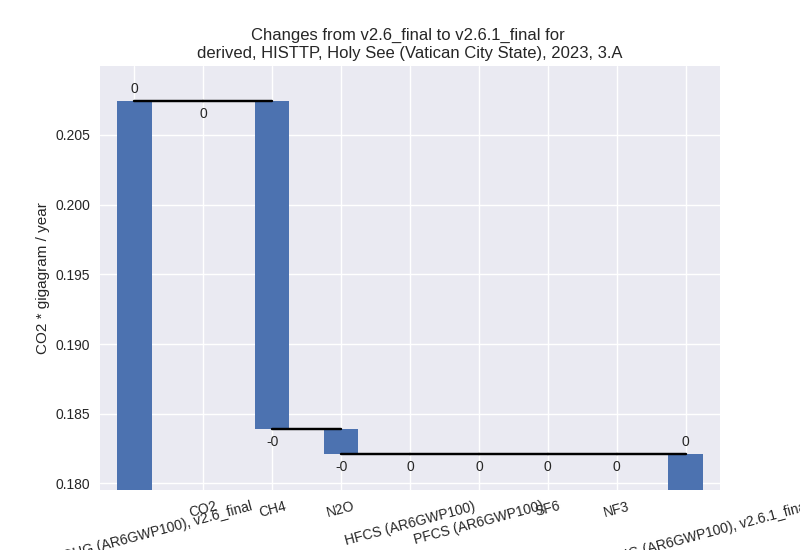
For 1990-2023 the changes per gas are: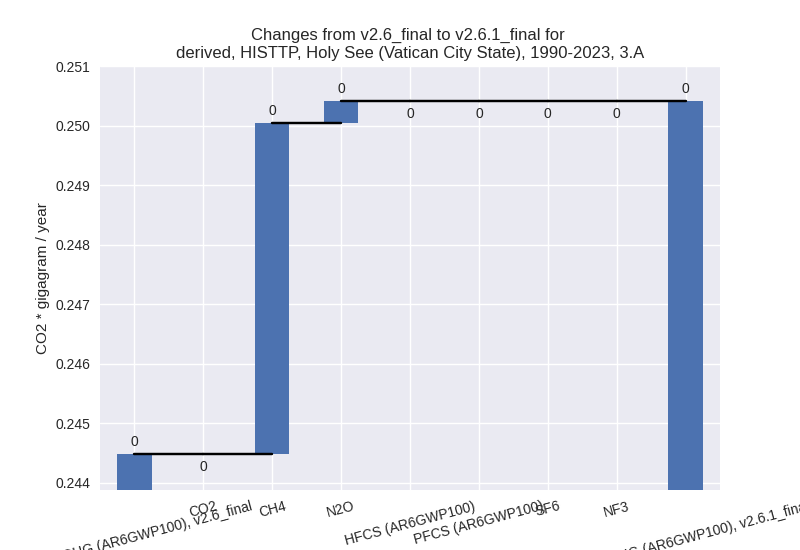
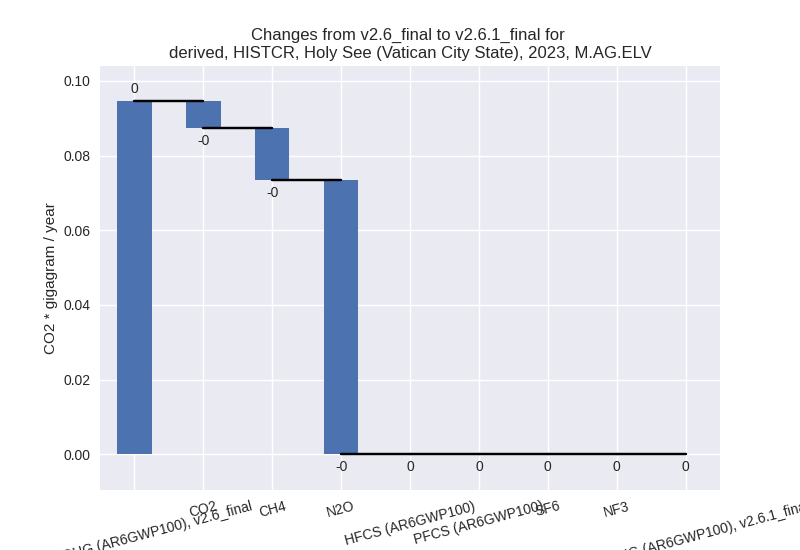
There is no subsector information available in PRIMAP-hist. - M.AG.ELV: Total sectoral emissions in 2022 are 0.08
Gg CO2 / year which is 31.3% of category M.AG emissions. 2023 Emissions
have changed by -12.0% (-0.01 Gg CO2
/ year). 1990-2023 Emissions have changed by 2.7% (0.00 Gg CO2 / year). For 2023 the
changes per gas
are:
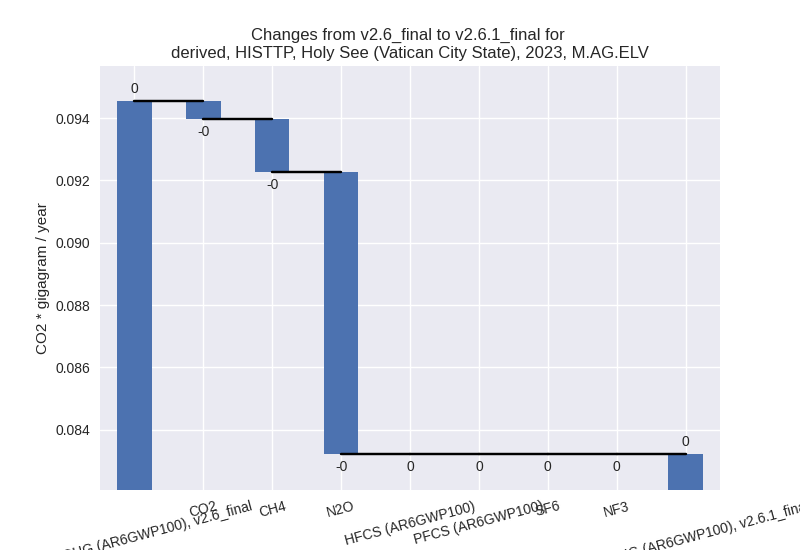
For 1990-2023 the changes per gas are: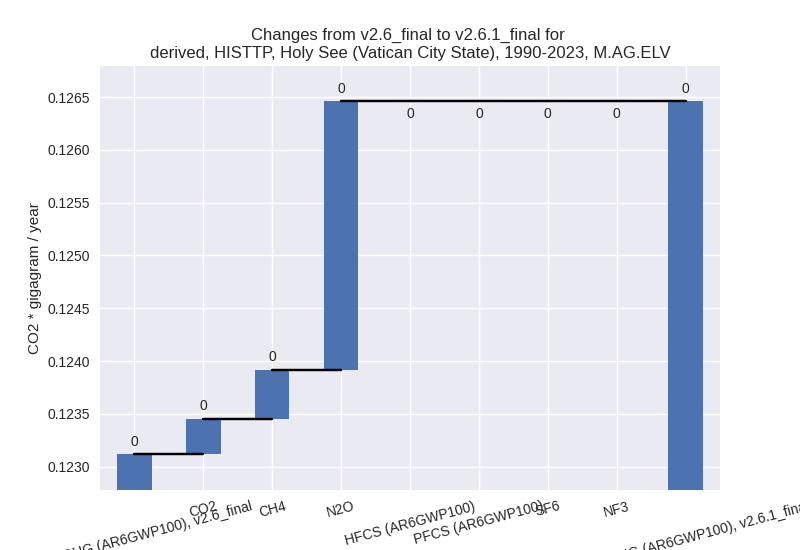
There is no subsector information available in PRIMAP-hist.
- 3.A: Total sectoral emissions in 2022 are 0.19 Gg
CO2 / year which is 68.7% of category M.AG emissions. 2023 Emissions
have changed by -12.2% (-0.03 Gg CO2
/ year). 1990-2023 Emissions have changed by 2.4% (0.01 Gg CO2 / year). For 2023 the
changes per gas
are:
- 4: Total sectoral emissions in 2022 are 0.11 Gg CO2
/ year which is 0.7% of M.0.EL emissions. 2023 Emissions have changed by
-10.3% (-0.01 Gg CO2 / year).
1990-2023 Emissions have changed by -0.8% (-0.00 Gg CO2 / year). For 2023 the
changes per gas
are:
- 5: Total sectoral emissions in 2022 are 0.01 Gg CO2
/ year which is 0.0% of M.0.EL emissions. 2023 Emissions have changed by
-14.9% (-0.00 Gg CO2 / year).
1990-2023 Emissions have changed by -3.6% (-0.00 Gg CO2 / year). For 2023 the
changes per gas
are:

For 1990-2023 the changes per gas are: