Changes in PRIMAP-hist v2.6.1_final compared to v2.6_final for Vanuatu
2025-03-19
Johannes Gütschow
Change analysis for Vanuatu for PRIMAP-hist v2.6.1_final compared to v2.6_final
Overview over emissions by sector and gas
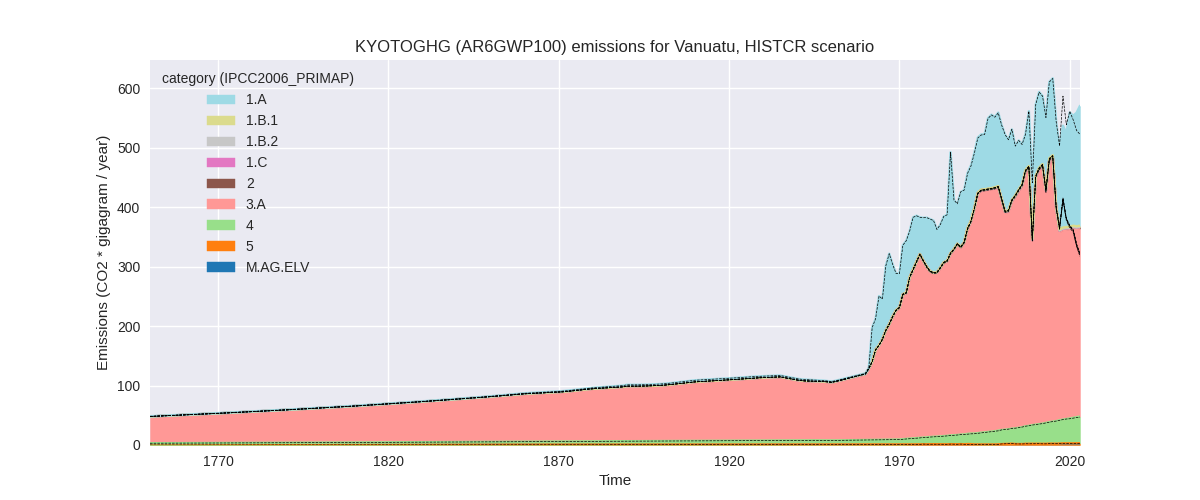
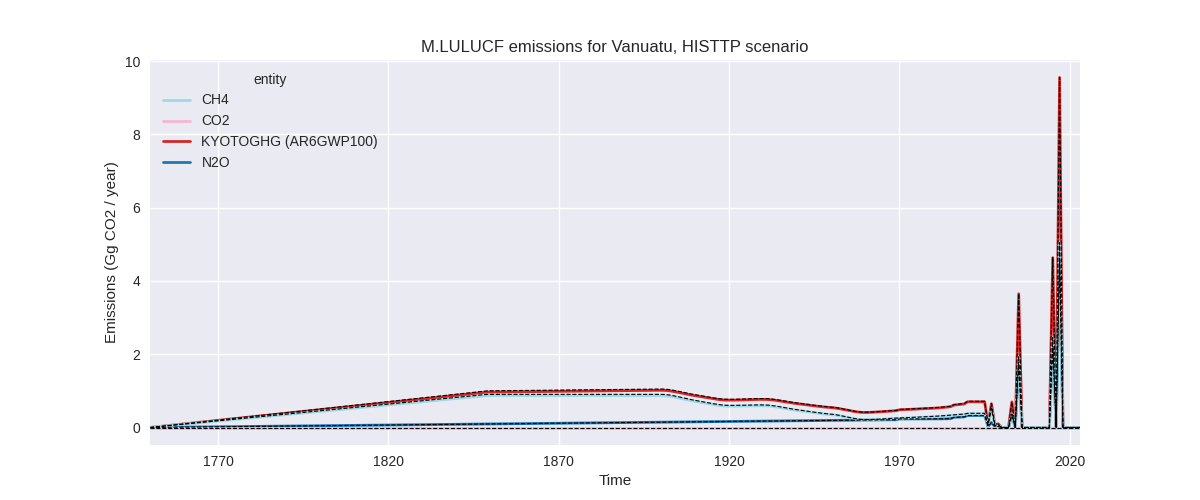
The following figures show the aggregate national total emissions excluding LULUCF AR6GWP100 for the country reported priority scenario. The dotted linesshow the v2.6_final data.
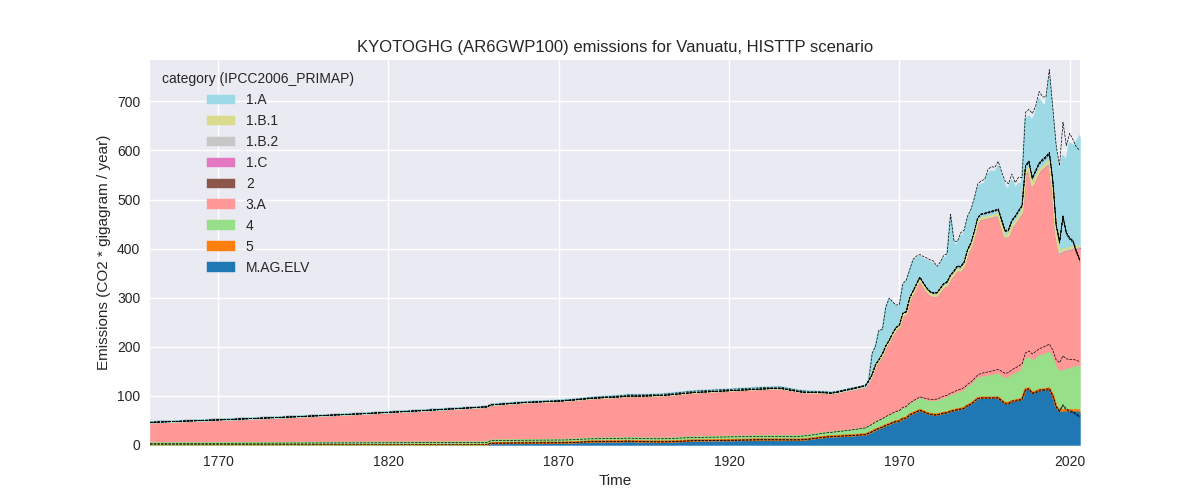
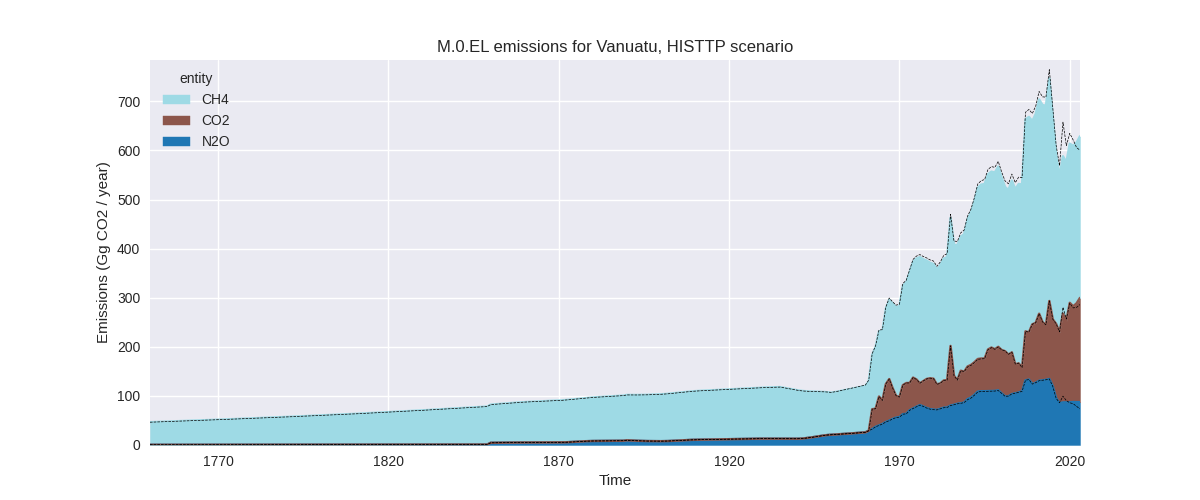
The following figures show the aggregate national total emissions excluding LULUCF AR6GWP100 for the third party priority scenario. The dotted linesshow the v2.6_final data.
Overview over changes
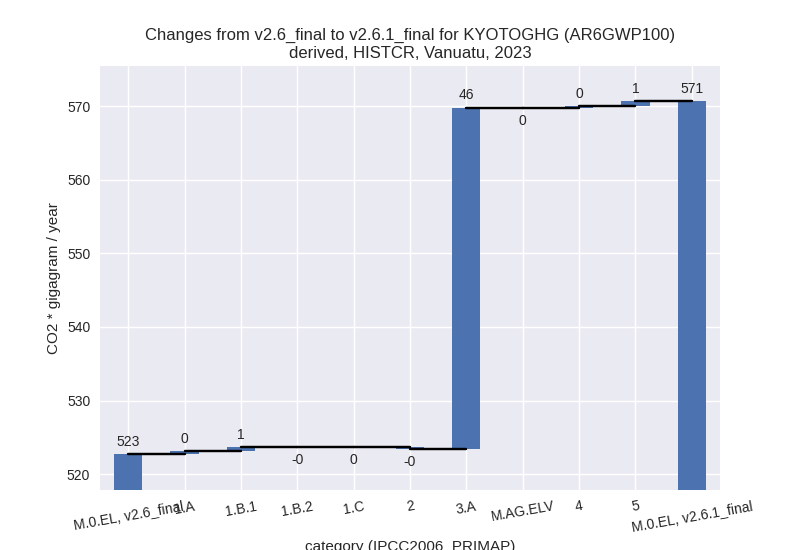
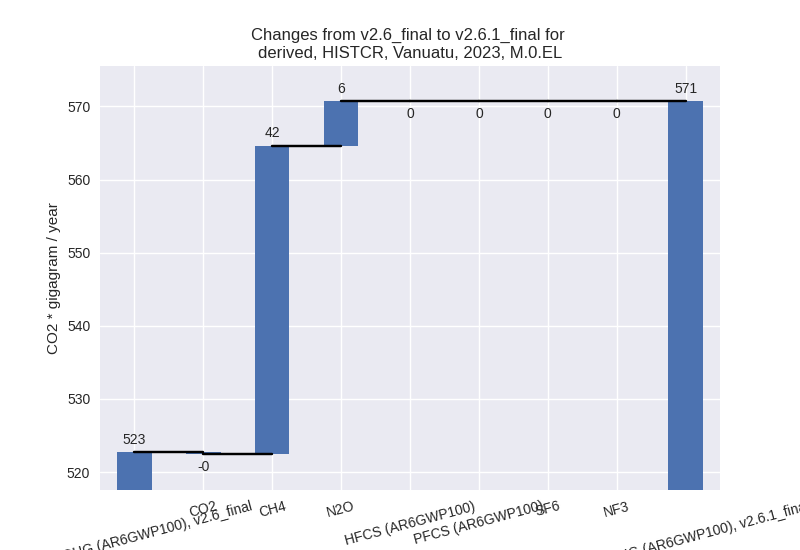
In the country reported priority scenario we have the following changes for aggregate Kyoto GHG and national total emissions excluding LULUCF (M.0.EL):
- Emissions in 2023 have changed by 9.2%% (47.99 Gg CO2 / year)
- Emissions in 1990-2023 have changed by 0.1%% (0.63 Gg CO2 / year)
In the third party priority scenario we have the following changes for aggregate Kyoto GHG and national total emissions excluding LULUCF (M.0.EL):
- Emissions in 2023 have changed by 4.7%% (28.42 Gg CO2 / year)
- Emissions in 1990-2023 have changed by -2.3%% (-13.74 Gg CO2 / year)
Most important changes per scenario and time frame
In the country reported priority scenario the following sector-gas combinations have the highest absolute impact on national total KyotoGHG (AR6GWP100) emissions in 2023 (top 5):
- 1: 3.A, CH4 with 41.60 Gg CO2 / year (18.5%)
- 2: 3.A, N2O with 4.79 Gg CO2 / year (10.6%)
- 3: 5, N2O with 0.68 Gg CO2 / year (30.9%)
- 4: 1.B.1, CH4 with 0.52 Gg CO2 / year (38.1%)
- 5: 1.A, N2O with 0.43 Gg CO2 / year (35.1%)
In the country reported priority scenario the following sector-gas combinations have the highest absolute impact on national total KyotoGHG (AR6GWP100) emissions in 1990-2023 (top 5):
- 1: 1.B.1, CH4 with 0.40 Gg CO2 / year (46.6%)
- 2: 3.A, CH4 with 0.39 Gg CO2 / year (0.1%)
- 3: 3.A, N2O with -0.15 Gg CO2 / year (-0.2%)
- 4: 2, CO2 with -0.11 Gg CO2 / year (-12.0%)
- 5: 1.A, N2O with 0.05 Gg CO2 / year (8.4%)
In the third party priority scenario the following sector-gas combinations have the highest absolute impact on national total KyotoGHG (AR6GWP100) emissions in 2023 (top 5):
- 1: 3.A, CH4 with 36.42 Gg CO2 / year (18.5%)
- 2: 4, CH4 with -22.05 Gg CO2 / year (-20.5%)
- 3: M.AG.ELV, N2O with 11.17 Gg CO2 / year (19.9%)
- 4: 1.A, N2O with 0.89 Gg CO2 / year (34.0%)
- 5: 3.A, N2O with 0.77 Gg CO2 / year (10.6%)
In the third party priority scenario the following sector-gas combinations have the highest absolute impact on national total KyotoGHG (AR6GWP100) emissions in 1990-2023 (top 5):
- 1: 4, CH4 with -14.82 Gg CO2 / year (-20.6%)
- 2: 1.B.1, CH4 with 0.40 Gg CO2 / year (46.6%)
- 3: 3.A, CH4 with 0.34 Gg CO2 / year (0.1%)
- 4: M.AG.ELV, N2O with 0.16 Gg CO2 / year (0.2%)
- 5: 1.A, N2O with 0.15 Gg CO2 / year (7.6%)
Notes on data changes
Here we list notes explaining important emissions changes for the country.
- No new country reported data has been included. Country reported data covers only 2007-2015 thus the third party data has a high influence on the CR time-series.
- The most important CR changes are for agricultural data where FAO data has changed after 2017.
- In the TP scenario we additionally have lower waste CH4 emissions from the new EDGAR data.
Changes by sector and gas
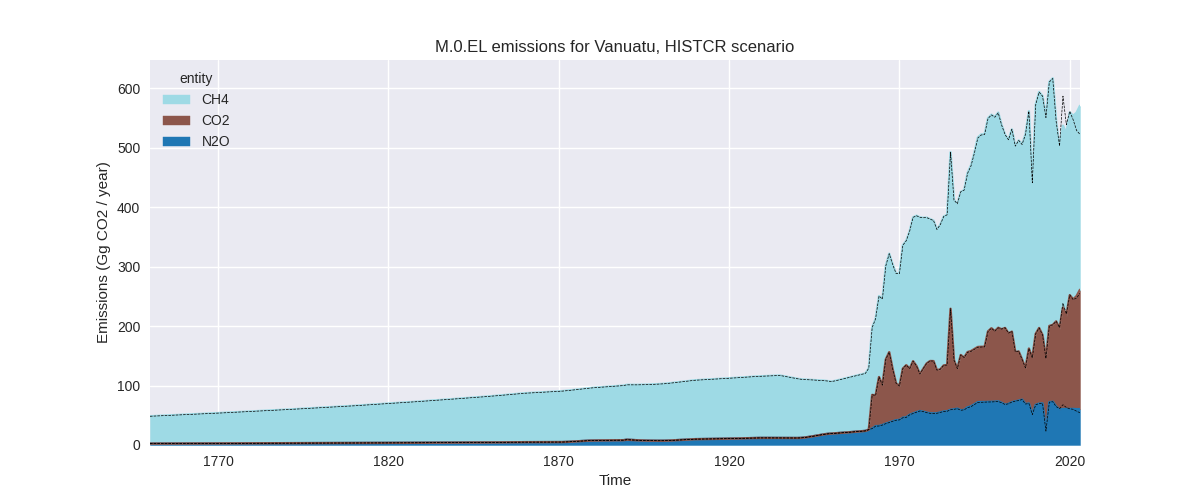
For each scenario and time frame the changes are displayed for all individual sectors and all individual gases. In the sector plot we use aggregate Kyoto GHGs in AR6GWP100. In the gas plot we usenational total emissions without LULUCF.
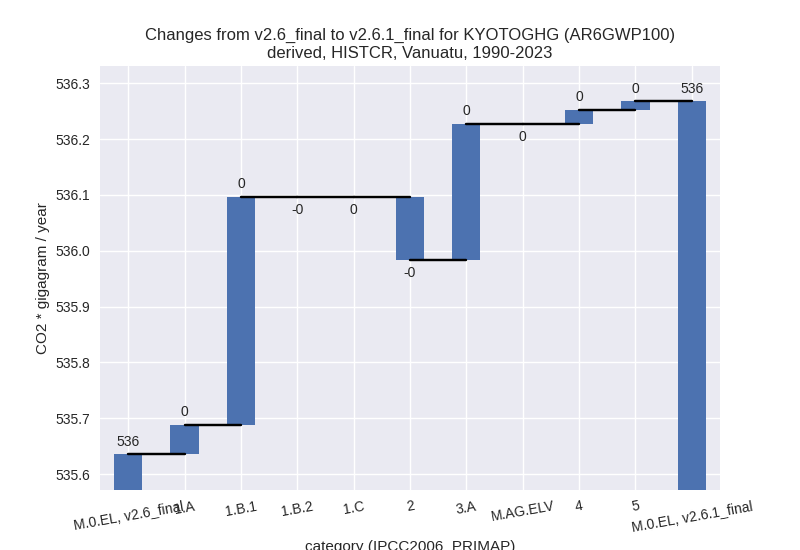
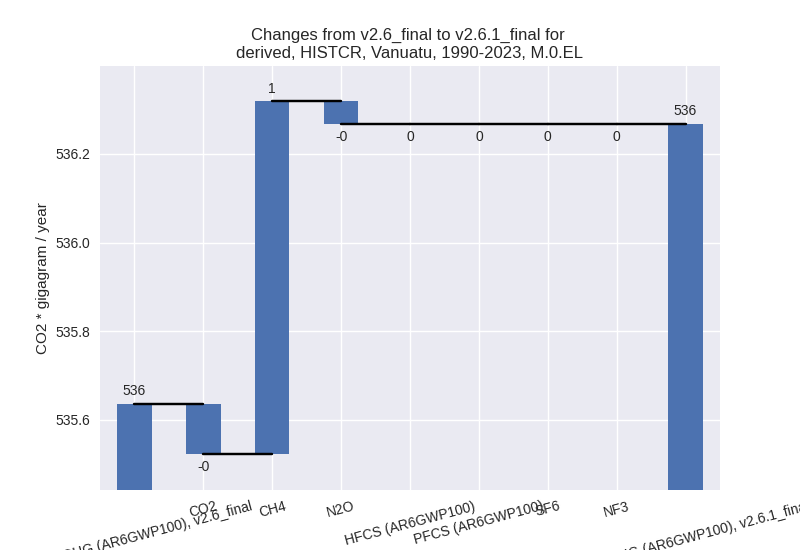
country reported scenario
2023
1990-2023
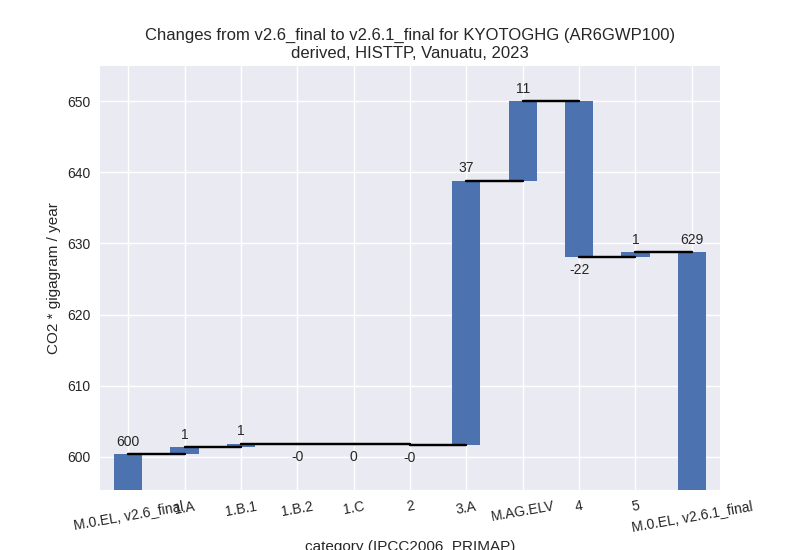
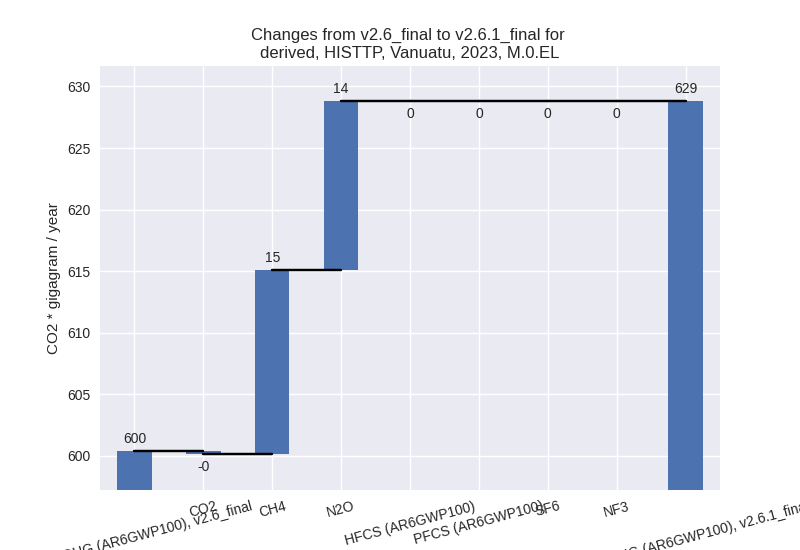
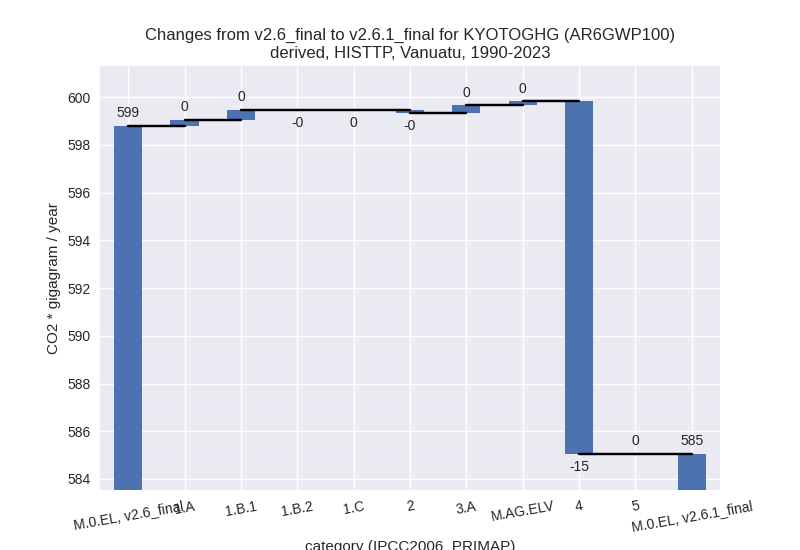
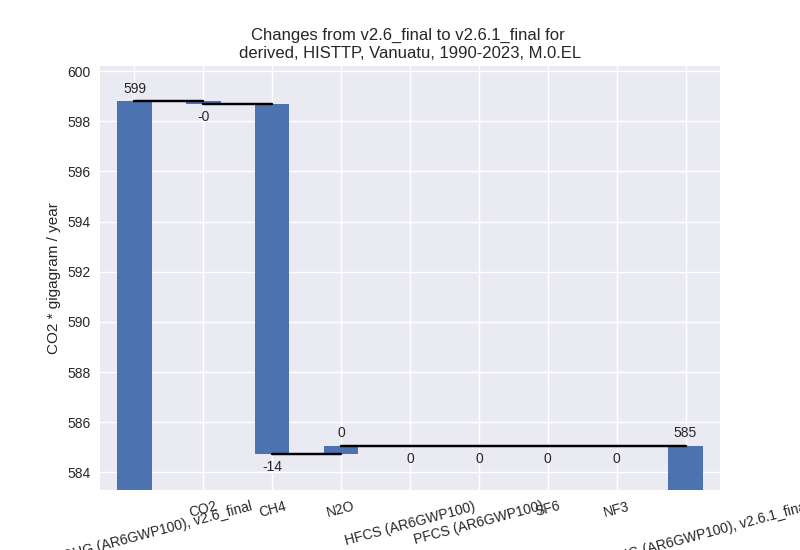
third party scenario
2023
1990-2023
Detailed changes for the scenarios:
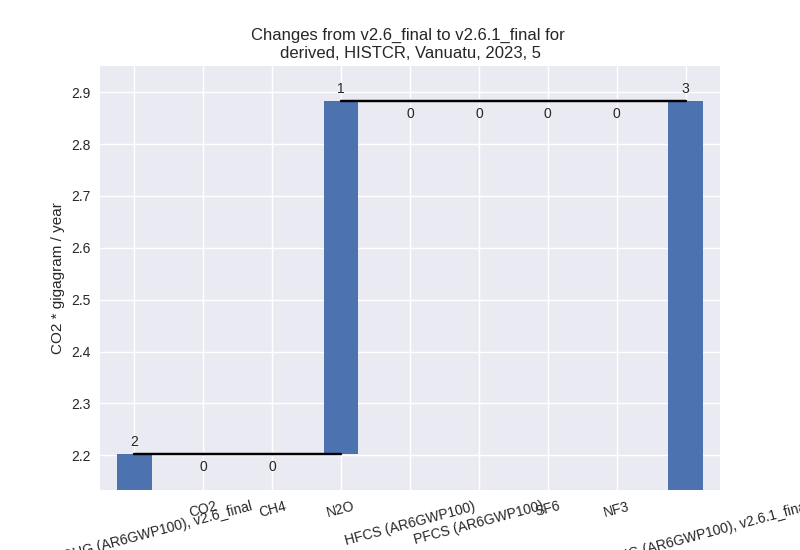
country reported scenario (HISTCR):
Most important changes per time frame
For 2023 the following sector-gas combinations have the highest absolute impact on national total KyotoGHG (AR6GWP100) emissions in 2023 (top 5):
- 1: 3.A, CH4 with 41.60 Gg CO2 / year (18.5%)
- 2: 3.A, N2O with 4.79 Gg CO2 / year (10.6%)
- 3: 5, N2O with 0.68 Gg CO2 / year (30.9%)
- 4: 1.B.1, CH4 with 0.52 Gg CO2 / year (38.1%)
- 5: 1.A, N2O with 0.43 Gg CO2 / year (35.1%)
For 1990-2023 the following sector-gas combinations have the highest absolute impact on national total KyotoGHG (AR6GWP100) emissions in 1990-2023 (top 5):
- 1: 1.B.1, CH4 with 0.40 Gg CO2 / year (46.6%)
- 2: 3.A, CH4 with 0.39 Gg CO2 / year (0.1%)
- 3: 3.A, N2O with -0.15 Gg CO2 / year (-0.2%)
- 4: 2, CO2 with -0.11 Gg CO2 / year (-12.0%)
- 5: 1.A, N2O with 0.05 Gg CO2 / year (8.4%)
Changes in the main sectors for aggregate KyotoGHG (AR6GWP100) are
- 1: Total sectoral emissions in 2022 are 193.00 Gg CO2 / year which is 34.5% of M.0.EL emissions. 2023 Emissions have changed by 0.5% (0.96 Gg CO2 / year). 1990-2023 Emissions have changed by 0.4% (0.46 Gg CO2 / year).
- 2: Total sectoral emissions in 2022 are 2.67 Gg CO2
/ year which is 0.5% of M.0.EL emissions. 2023 Emissions have changed by
-8.5% (-0.25 Gg CO2 / year).
1990-2023 Emissions have changed by -5.2% (-0.11 Gg CO2 / year). For 2023 the
changes per gas
are:

For 1990-2023 the changes per gas are:
- M.AG: Total sectoral emissions in 2022 are 316.56
Gg CO2 / year which is 56.6% of M.0.EL emissions. 2023 Emissions have
changed by 17.2% (46.39 Gg CO2 /
year). 1990-2023 Emissions have changed by 0.1% (0.24 Gg CO2 / year). For 2023 the
changes per gas
are:
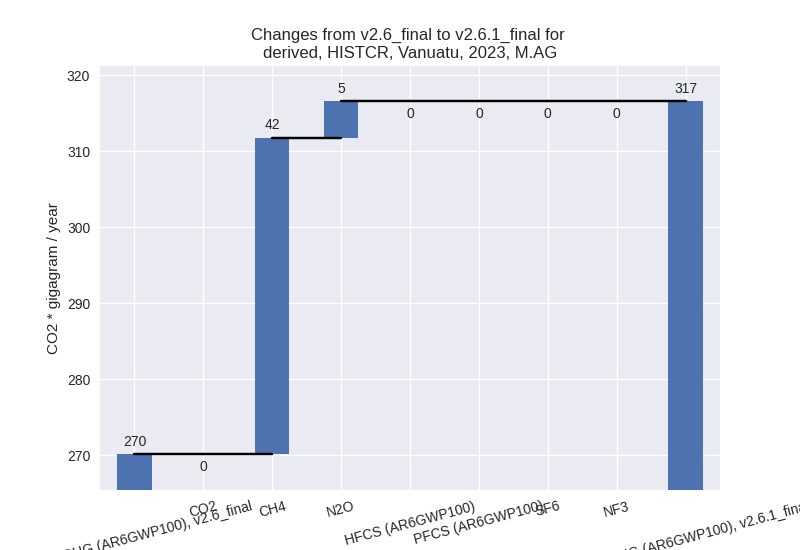
The changes come from the following subsectors:- 3.A: Total sectoral emissions in 2022 are 316.56 Gg
CO2 / year which is 100.0% of category M.AG emissions. 2023 Emissions
have changed by 17.2% (46.39 Gg CO2
/ year). 1990-2023 Emissions have changed by 0.1% (0.24 Gg CO2 / year). For 2023 the
changes per gas
are:

There is no subsector information available in PRIMAP-hist.
- 3.A: Total sectoral emissions in 2022 are 316.56 Gg
CO2 / year which is 100.0% of category M.AG emissions. 2023 Emissions
have changed by 17.2% (46.39 Gg CO2
/ year). 1990-2023 Emissions have changed by 0.1% (0.24 Gg CO2 / year). For 2023 the
changes per gas
are:
- 4: Total sectoral emissions in 2022 are 43.98 Gg CO2 / year which is 7.9% of M.0.EL emissions. 2023 Emissions have changed by 0.5% (0.21 Gg CO2 / year). 1990-2023 Emissions have changed by 0.1% (0.03 Gg CO2 / year).
- 5: Total sectoral emissions in 2022 are 2.83 Gg CO2
/ year which is 0.5% of M.0.EL emissions. 2023 Emissions have changed by
30.9% (0.68 Gg CO2 / year).
1990-2023 Emissions have changed by 0.9% (0.02 Gg CO2 / year). For 2023 the
changes per gas
are:
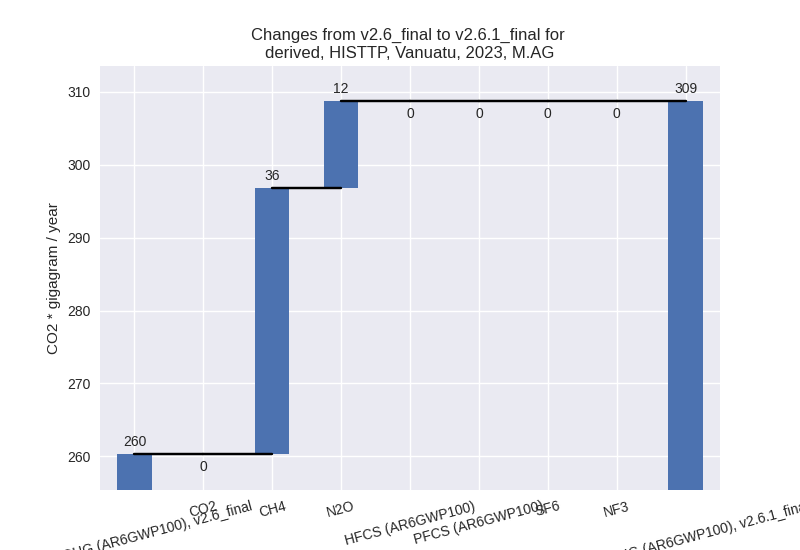
third party scenario (HISTTP):
Most important changes per time frame
For 2023 the following sector-gas combinations have the highest absolute impact on national total KyotoGHG (AR6GWP100) emissions in 2023 (top 5):
- 1: 3.A, CH4 with 36.42 Gg CO2 / year (18.5%)
- 2: 4, CH4 with -22.05 Gg CO2 / year (-20.5%)
- 3: M.AG.ELV, N2O with 11.17 Gg CO2 / year (19.9%)
- 4: 1.A, N2O with 0.89 Gg CO2 / year (34.0%)
- 5: 3.A, N2O with 0.77 Gg CO2 / year (10.6%)
For 1990-2023 the following sector-gas combinations have the highest absolute impact on national total KyotoGHG (AR6GWP100) emissions in 1990-2023 (top 5):
- 1: 4, CH4 with -14.82 Gg CO2 / year (-20.6%)
- 2: 1.B.1, CH4 with 0.40 Gg CO2 / year (46.6%)
- 3: 3.A, CH4 with 0.34 Gg CO2 / year (0.1%)
- 4: M.AG.ELV, N2O with 0.16 Gg CO2 / year (0.2%)
- 5: 1.A, N2O with 0.15 Gg CO2 / year (7.6%)
Changes in the main sectors for aggregate KyotoGHG (AR6GWP100) are
- 1: Total sectoral emissions in 2022 are 213.89 Gg CO2 / year which is 34.7% of M.0.EL emissions. 2023 Emissions have changed by 0.7% (1.49 Gg CO2 / year). 1990-2023 Emissions have changed by 0.6% (0.67 Gg CO2 / year).
- 2: Total sectoral emissions in 2022 are 2.67 Gg CO2
/ year which is 0.4% of M.0.EL emissions. 2023 Emissions have changed by
-8.5% (-0.25 Gg CO2 / year).
1990-2023 Emissions have changed by -5.2% (-0.11 Gg CO2 / year). For 2023 the
changes per gas
are:

For 1990-2023 the changes per gas are: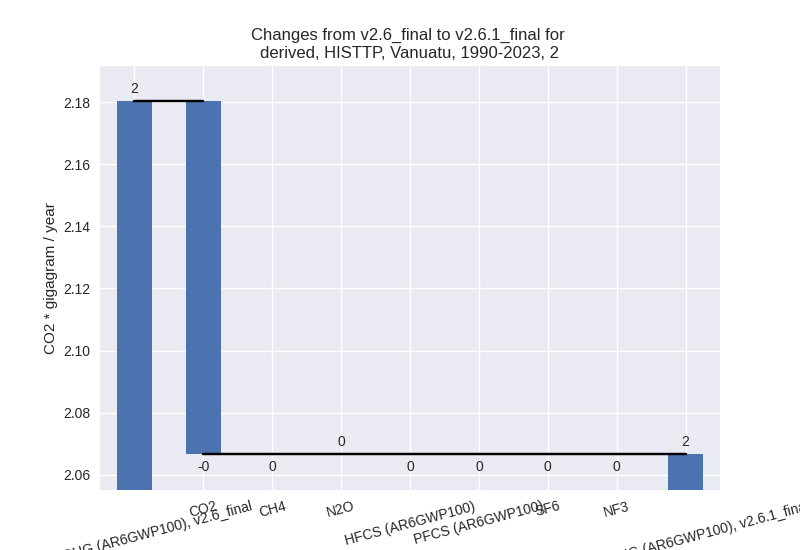
- M.AG: Total sectoral emissions in 2022 are 308.85
Gg CO2 / year which is 50.2% of M.0.EL emissions. 2023 Emissions have
changed by 18.6% (48.36 Gg CO2 /
year). 1990-2023 Emissions have changed by 0.1% (0.47 Gg CO2 / year). For 2023 the
changes per gas
are:
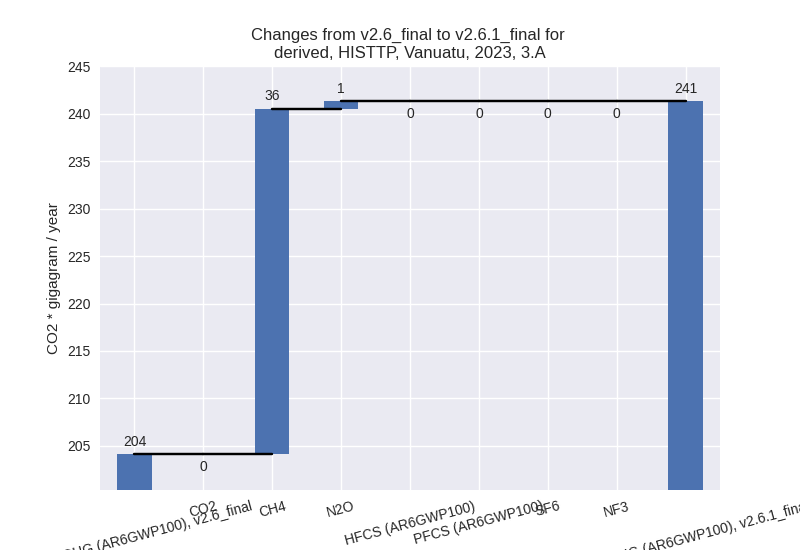
The changes come from the following subsectors:- 3.A: Total sectoral emissions in 2022 are 241.23 Gg
CO2 / year which is 78.1% of category M.AG emissions. 2023 Emissions
have changed by 18.2% (37.19 Gg CO2
/ year). 1990-2023 Emissions have changed by 0.1% (0.32 Gg CO2 / year). For 2023 the
changes per gas
are:
There is no subsector information available in PRIMAP-hist. - M.AG.ELV: Total sectoral emissions in 2022 are
67.63 Gg CO2 / year which is 21.9% of category M.AG emissions. 2023
Emissions have changed by 19.9%
(11.17 Gg CO2 / year). 1990-2023 Emissions have changed by 0.2% (0.16 Gg CO2 / year). For 2023 the
changes per gas
are:
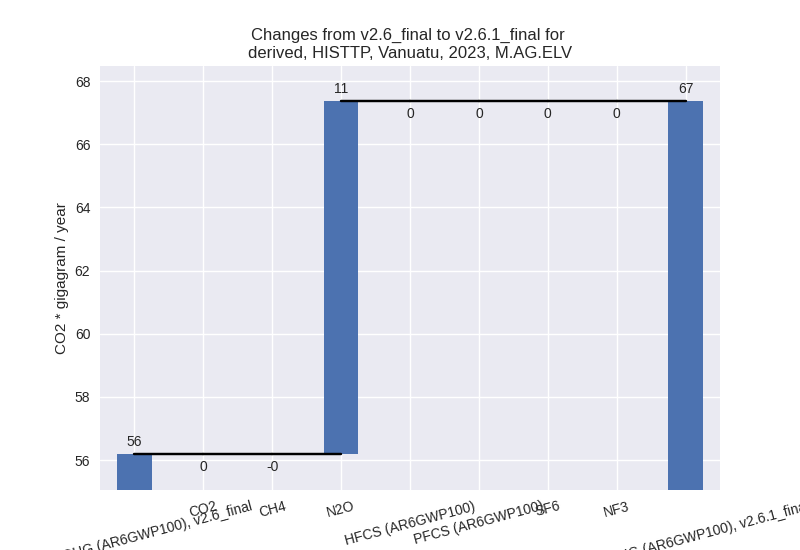
There is no subsector information available in PRIMAP-hist.
- 3.A: Total sectoral emissions in 2022 are 241.23 Gg
CO2 / year which is 78.1% of category M.AG emissions. 2023 Emissions
have changed by 18.2% (37.19 Gg CO2
/ year). 1990-2023 Emissions have changed by 0.1% (0.32 Gg CO2 / year). For 2023 the
changes per gas
are:
- 4: Total sectoral emissions in 2022 are 87.47 Gg
CO2 / year which is 14.2% of M.0.EL emissions. 2023 Emissions have
changed by -19.7% (-21.87 Gg CO2 /
year). 1990-2023 Emissions have changed by -19.9% (-14.79 Gg CO2 / year). For 2023
the changes per gas
are:

For 1990-2023 the changes per gas are: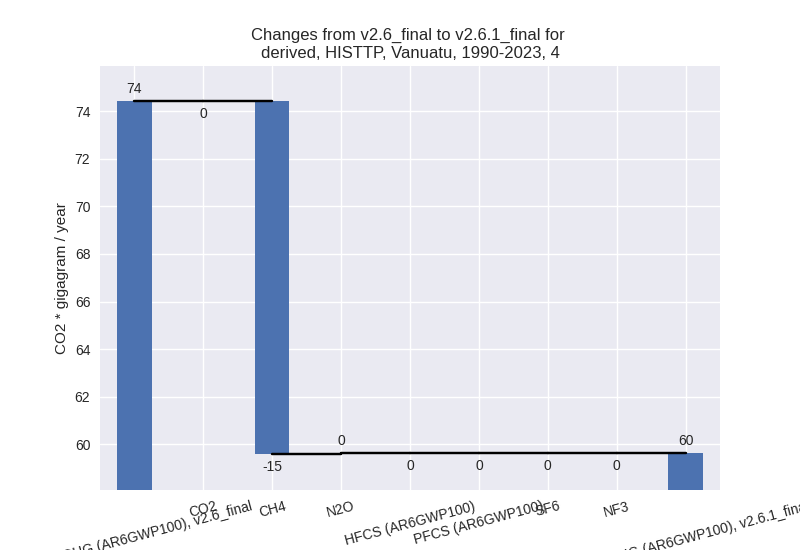
- 5: Total sectoral emissions in 2022 are 2.83 Gg CO2
/ year which is 0.5% of M.0.EL emissions. 2023 Emissions have changed by
30.9% (0.68 Gg CO2 / year).
1990-2023 Emissions have changed by 0.9% (0.02 Gg CO2 / year). For 2023 the
changes per gas
are:
