Changes in PRIMAP-hist v2.7_final compared to v2.6.1_final for Angola
2025-09-11
Johannes Gütschow
Change analysis for Angola for PRIMAP-hist v2.7_final compared to v2.6.1_final
Overview over emissions by sector and gas
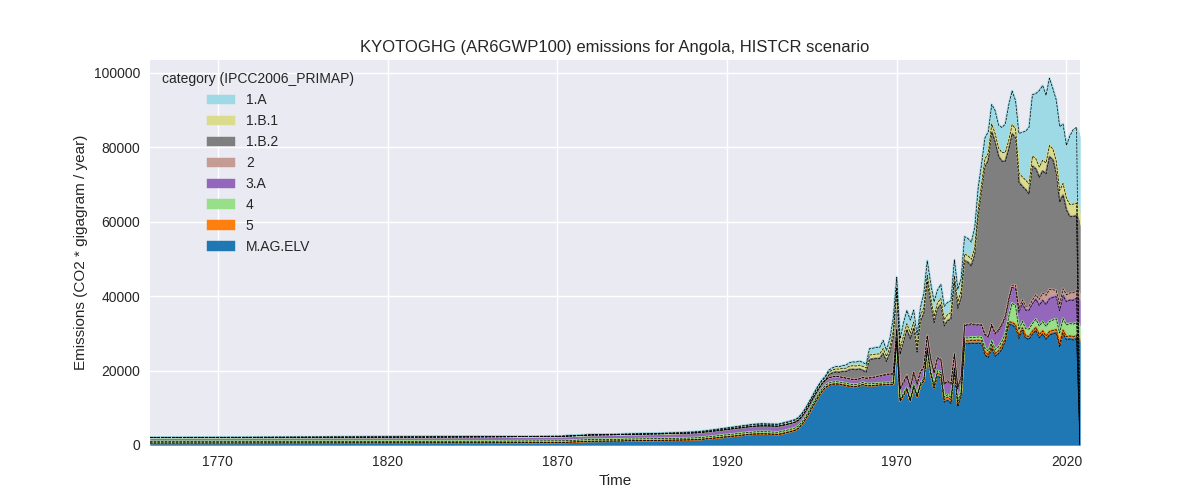
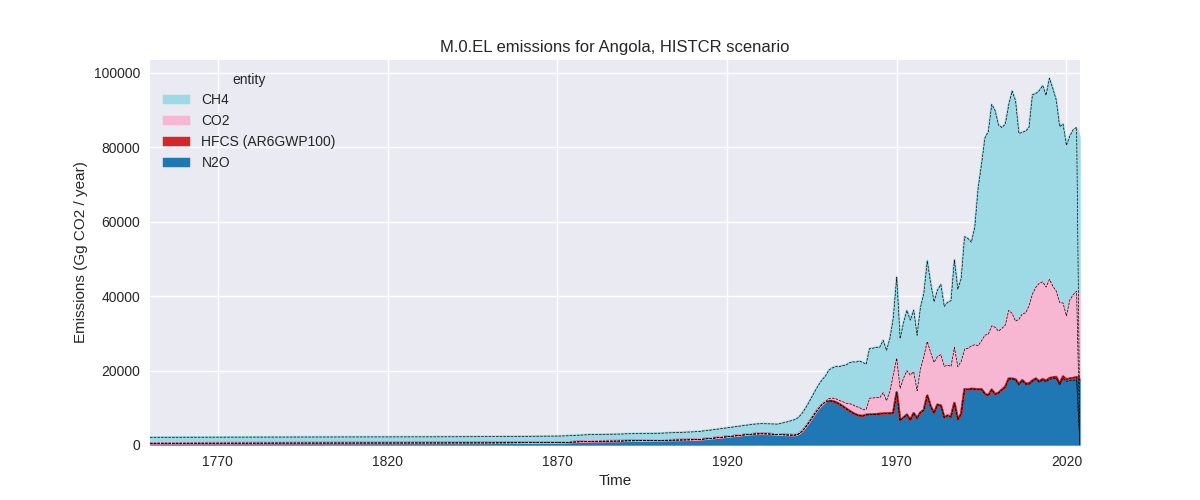
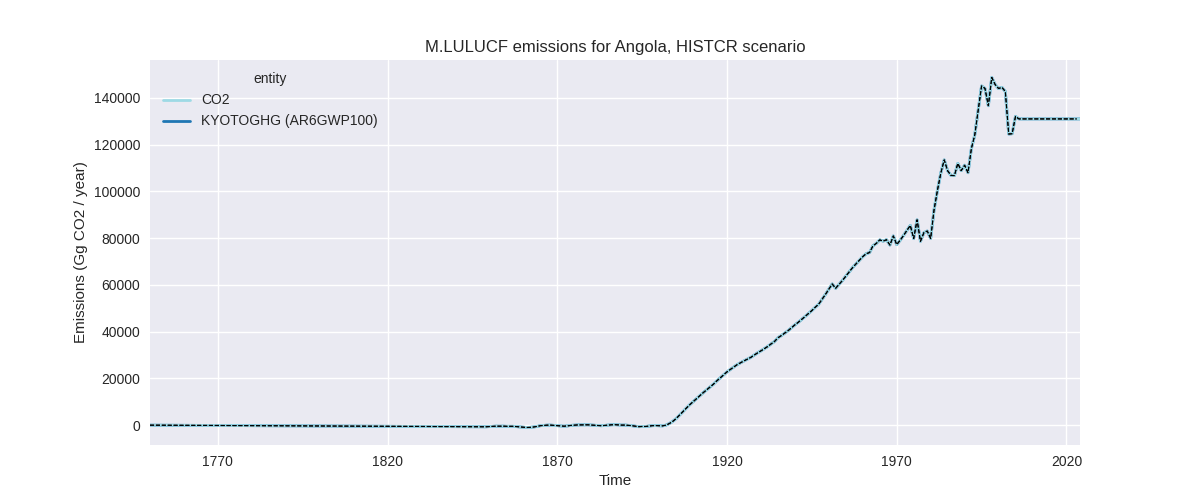
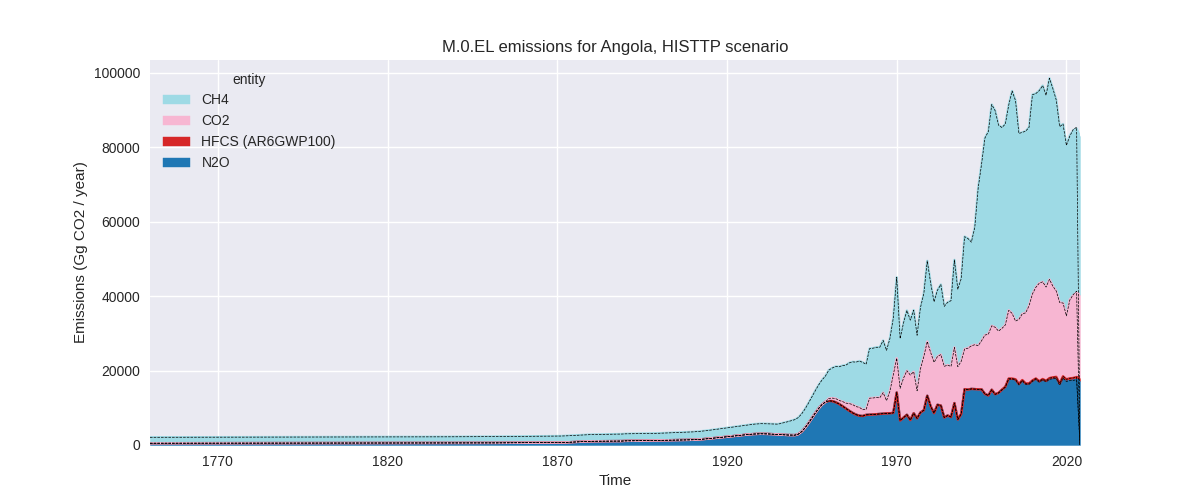
The following figures show the aggregate national total emissions excluding LULUCF AR6GWP100 for the country reported priority scenario. The dotted linesshow the v2.6.1_final data.
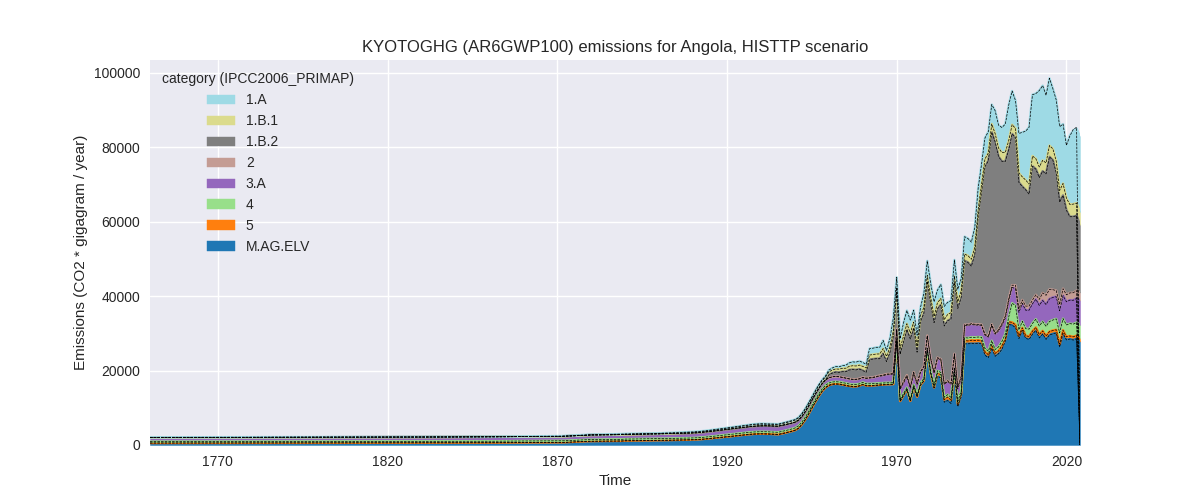
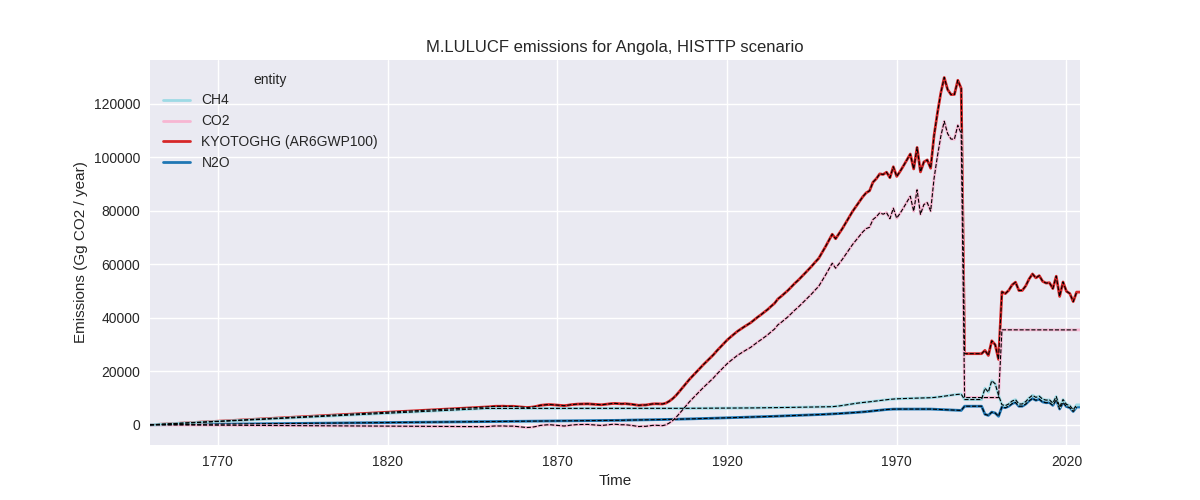
The following figures show the aggregate national total emissions excluding LULUCF AR6GWP100 for the third party priority scenario. The dotted linesshow the v2.6.1_final data.
Overview over changes
In the country reported priority scenario we have the following changes for aggregate Kyoto GHG and national total emissions excluding LULUCF (M.0.EL):
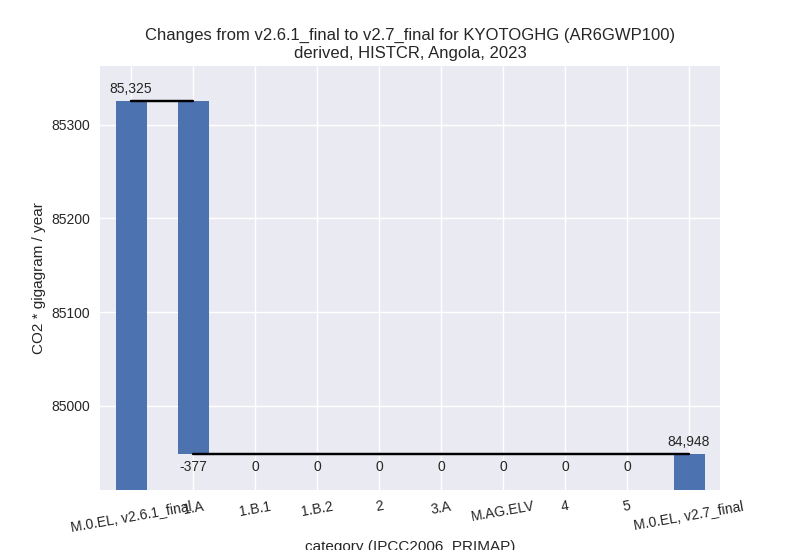
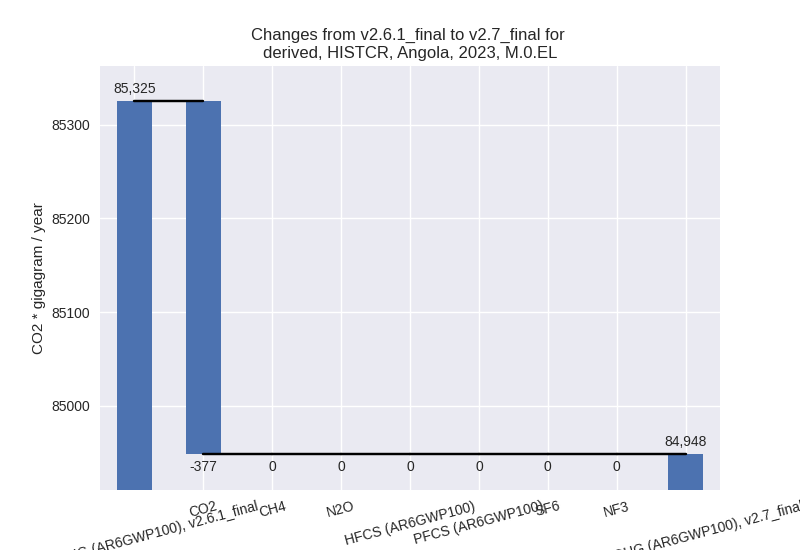
- Emissions in 2023 have changed by -0.4%% (-376.72 Gg CO2 / year)
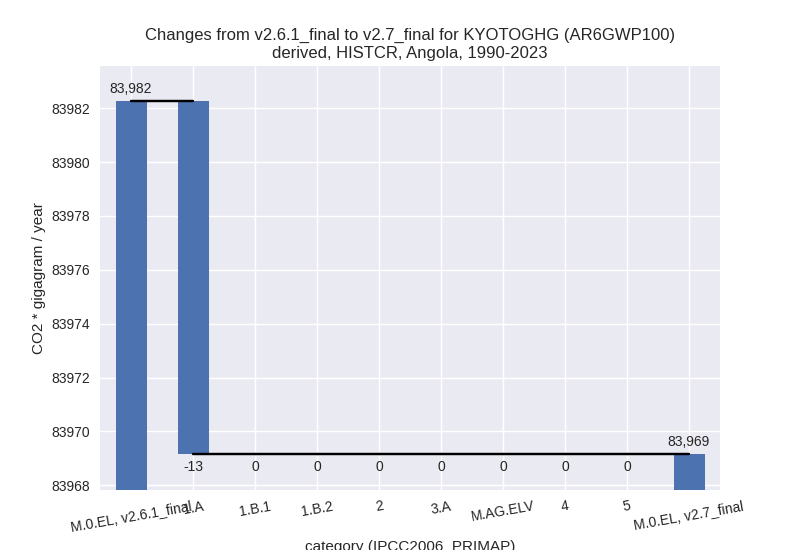
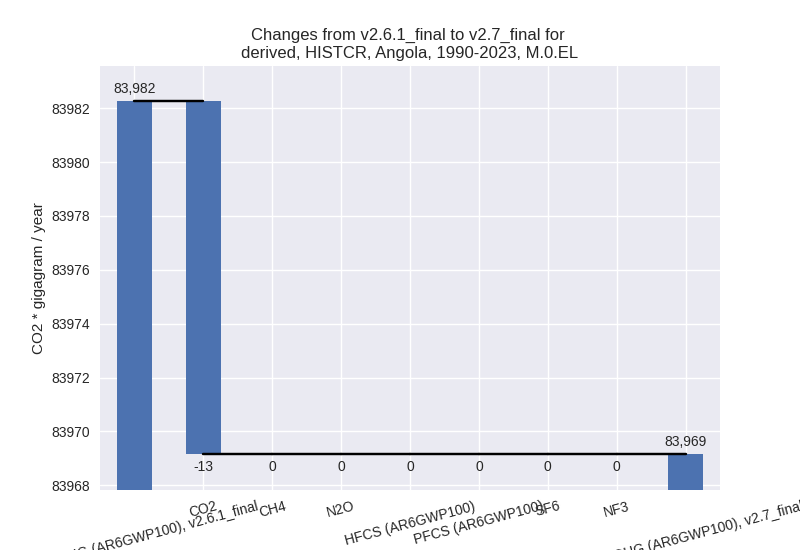
- Emissions in 1990-2023 have changed by -0.0%% (-13.10 Gg CO2 / year)
In the third party priority scenario we have the following changes for aggregate Kyoto GHG and national total emissions excluding LULUCF (M.0.EL):
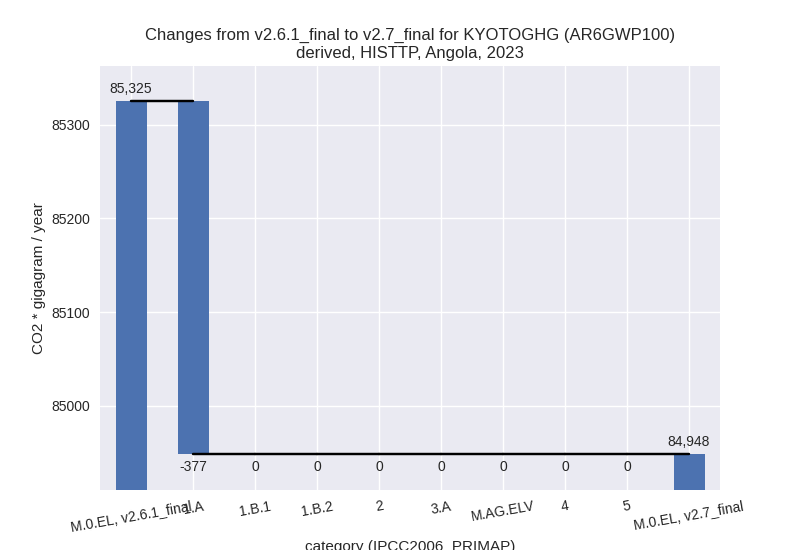
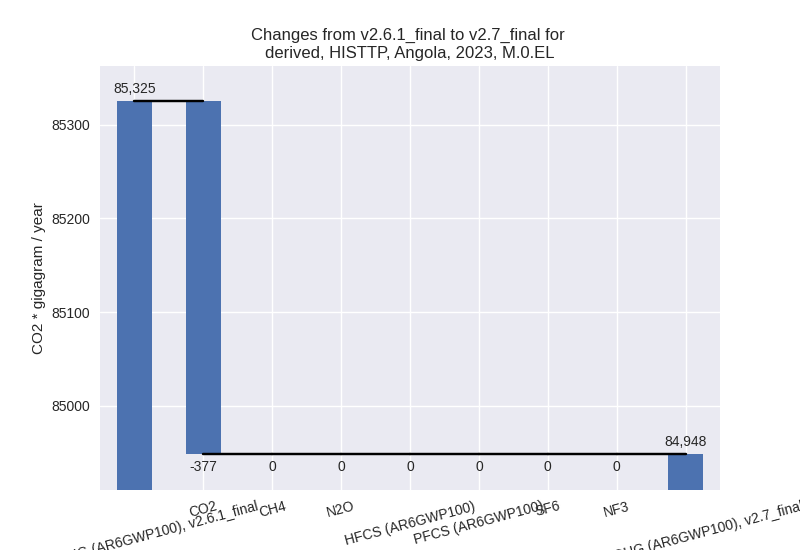
- Emissions in 2023 have changed by -0.4%% (-376.72 Gg CO2 / year)
- Emissions in 1990-2023 have changed by -0.0%% (-13.10 Gg CO2 / year)
Most important changes per scenario and time frame
In the country reported priority scenario the following sector-gas combinations have the highest absolute impact on national total KyotoGHG (AR6GWP100) emissions in 2023 (top 5):
- 1: 1.A, CO2 with -376.72 Gg CO2 / year (-2.1%)
- 2: 1.A, CH4 with 0.00 Gg CO2 / year (0.0%)
- 3: 1.A, N2O with 0.00 Gg CO2 / year (0.0%)
- 4: 5, N2O with 0.00 Gg CO2 / year (0.0%)
- 5: 4, N2O with 0.00 Gg CO2 / year (0.0%)
In the country reported priority scenario the following sector-gas combinations have the highest absolute impact on national total KyotoGHG (AR6GWP100) emissions in 1990-2023 (top 5):
- 1: 1.A, CO2 with -13.10 Gg CO2 / year (-0.1%)
- 2: 1.A, CH4 with 0.00 Gg CO2 / year (0.0%)
- 3: 1.A, N2O with 0.00 Gg CO2 / year (0.0%)
- 4: 5, N2O with 0.00 Gg CO2 / year (0.0%)
- 5: 4, N2O with 0.00 Gg CO2 / year (0.0%)
In the third party priority scenario the following sector-gas combinations have the highest absolute impact on national total KyotoGHG (AR6GWP100) emissions in 2023 (top 5):
- 1: 1.A, CO2 with -376.72 Gg CO2 / year (-2.1%)
- 2: 1.A, CH4 with 0.00 Gg CO2 / year (0.0%)
- 3: 1.A, N2O with 0.00 Gg CO2 / year (0.0%)
- 4: 5, N2O with 0.00 Gg CO2 / year (0.0%)
- 5: 4, N2O with 0.00 Gg CO2 / year (0.0%)
In the third party priority scenario the following sector-gas combinations have the highest absolute impact on national total KyotoGHG (AR6GWP100) emissions in 1990-2023 (top 5):
- 1: 1.A, CO2 with -13.10 Gg CO2 / year (-0.1%)
- 2: 1.A, CH4 with 0.00 Gg CO2 / year (0.0%)
- 3: 1.A, N2O with 0.00 Gg CO2 / year (0.0%)
- 4: 5, N2O with 0.00 Gg CO2 / year (0.0%)
- 5: 4, N2O with 0.00 Gg CO2 / year (0.0%)
Notes on data changes
Here we list notes explaining important emissions changes for the country.
- There is no usable country reported data for Aruba, thus the CR and TP time-series are identical.
- The only change for CR and TP time-series is a reduction in energy CO2 for post-2020 originating from the new EI data.
Changes by sector and gas
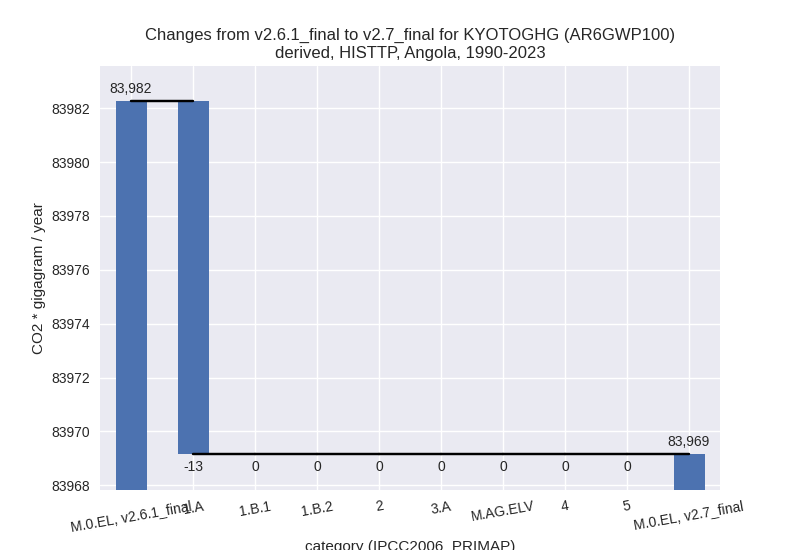
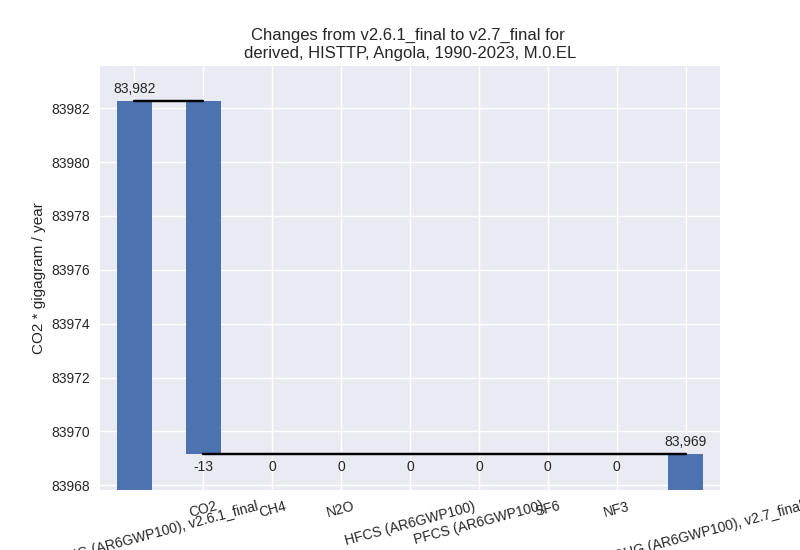
For each scenario and time frame the changes are displayed for all individual sectors and all individual gases. In the sector plot we use aggregate Kyoto GHGs in AR6GWP100. In the gas plot we usenational total emissions without LULUCF.
country reported scenario
2023
1990-2023
third party scenario
2023
1990-2023
Detailed changes for the scenarios:
country reported scenario (HISTCR):
Most important changes per time frame
For 2023 the following sector-gas combinations have the highest absolute impact on national total KyotoGHG (AR6GWP100) emissions in 2023 (top 5):
- 1: 1.A, CO2 with -376.72 Gg CO2 / year (-2.1%)
- 2: 1.A, CH4 with 0.00 Gg CO2 / year (0.0%)
- 3: 1.A, N2O with 0.00 Gg CO2 / year (0.0%)
- 4: 5, N2O with 0.00 Gg CO2 / year (0.0%)
- 5: 4, N2O with 0.00 Gg CO2 / year (0.0%)
For 1990-2023 the following sector-gas combinations have the highest absolute impact on national total KyotoGHG (AR6GWP100) emissions in 1990-2023 (top 5):
- 1: 1.A, CO2 with -13.10 Gg CO2 / year (-0.1%)
- 2: 1.A, CH4 with 0.00 Gg CO2 / year (0.0%)
- 3: 1.A, N2O with 0.00 Gg CO2 / year (0.0%)
- 4: 5, N2O with 0.00 Gg CO2 / year (0.0%)
- 5: 4, N2O with 0.00 Gg CO2 / year (0.0%)
Changes in the main sectors for aggregate KyotoGHG (AR6GWP100) are
- 1: Total sectoral emissions in 2022 are 43580.29 Gg CO2 / year which is 51.6% of M.0.EL emissions. 2023 Emissions have changed by -0.9% (-376.72 Gg CO2 / year). 1990-2023 Emissions have changed by -0.0% (-13.10 Gg CO2 / year).
- 2: Total sectoral emissions in 2022 are 2040.94 Gg CO2 / year which is 2.4% of M.0.EL emissions. 2023 Emissions have changed by 0.0% (0.00 Gg CO2 / year). 1990-2023 Emissions have changed by 0.0% (0.00 Gg CO2 / year).
- M.AG: Total sectoral emissions in 2022 are 34565.44 Gg CO2 / year which is 40.9% of M.0.EL emissions. 2023 Emissions have changed by 0.0% (0.00 Gg CO2 / year). 1990-2023 Emissions have changed by 0.0% (0.00 Gg CO2 / year).
- 4: Total sectoral emissions in 2022 are 3422.12 Gg CO2 / year which is 4.1% of M.0.EL emissions. 2023 Emissions have changed by 0.0% (0.00 Gg CO2 / year). 1990-2023 Emissions have changed by 0.0% (0.00 Gg CO2 / year).
- 5: Total sectoral emissions in 2022 are 859.35 Gg CO2 / year which is 1.0% of M.0.EL emissions. 2023 Emissions have changed by 0.0% (0.00 Gg CO2 / year). 1990-2023 Emissions have changed by 0.0% (0.00 Gg CO2 / year).
third party scenario (HISTTP):
Most important changes per time frame
For 2023 the following sector-gas combinations have the highest absolute impact on national total KyotoGHG (AR6GWP100) emissions in 2023 (top 5):
- 1: 1.A, CO2 with -376.72 Gg CO2 / year (-2.1%)
- 2: 1.A, CH4 with 0.00 Gg CO2 / year (0.0%)
- 3: 1.A, N2O with 0.00 Gg CO2 / year (0.0%)
- 4: 5, N2O with 0.00 Gg CO2 / year (0.0%)
- 5: 4, N2O with 0.00 Gg CO2 / year (0.0%)
For 1990-2023 the following sector-gas combinations have the highest absolute impact on national total KyotoGHG (AR6GWP100) emissions in 1990-2023 (top 5):
- 1: 1.A, CO2 with -13.10 Gg CO2 / year (-0.1%)
- 2: 1.A, CH4 with 0.00 Gg CO2 / year (0.0%)
- 3: 1.A, N2O with 0.00 Gg CO2 / year (0.0%)
- 4: 5, N2O with 0.00 Gg CO2 / year (0.0%)
- 5: 4, N2O with 0.00 Gg CO2 / year (0.0%)
Changes in the main sectors for aggregate KyotoGHG (AR6GWP100) are
- 1: Total sectoral emissions in 2022 are 43580.29 Gg CO2 / year which is 51.6% of M.0.EL emissions. 2023 Emissions have changed by -0.9% (-376.72 Gg CO2 / year). 1990-2023 Emissions have changed by -0.0% (-13.10 Gg CO2 / year).
- 2: Total sectoral emissions in 2022 are 2040.94 Gg CO2 / year which is 2.4% of M.0.EL emissions. 2023 Emissions have changed by 0.0% (0.00 Gg CO2 / year). 1990-2023 Emissions have changed by 0.0% (0.00 Gg CO2 / year).
- M.AG: Total sectoral emissions in 2022 are 34565.44 Gg CO2 / year which is 40.9% of M.0.EL emissions. 2023 Emissions have changed by 0.0% (0.00 Gg CO2 / year). 1990-2023 Emissions have changed by 0.0% (0.00 Gg CO2 / year).
- 4: Total sectoral emissions in 2022 are 3422.12 Gg CO2 / year which is 4.1% of M.0.EL emissions. 2023 Emissions have changed by 0.0% (0.00 Gg CO2 / year). 1990-2023 Emissions have changed by 0.0% (0.00 Gg CO2 / year).
- 5: Total sectoral emissions in 2022 are 859.35 Gg CO2 / year which is 1.0% of M.0.EL emissions. 2023 Emissions have changed by 0.0% (0.00 Gg CO2 / year). 1990-2023 Emissions have changed by 0.0% (0.00 Gg CO2 / year).