Changes in PRIMAP-hist v2.7_final compared to v2.6.1_final for Australia
2025-09-11
Johannes Gütschow
Change analysis for Australia for PRIMAP-hist v2.7_final compared to v2.6.1_final
Overview over emissions by sector and gas
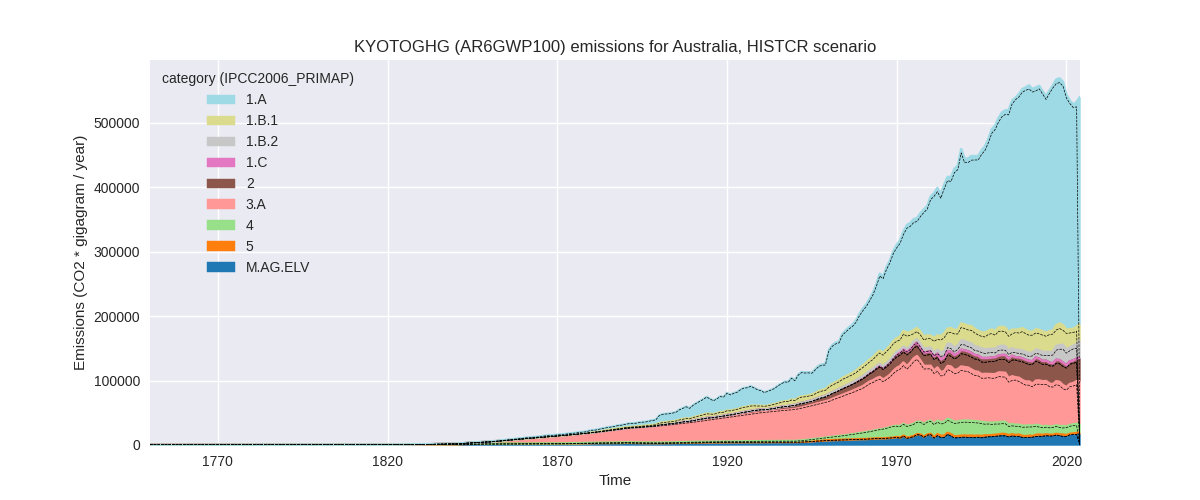
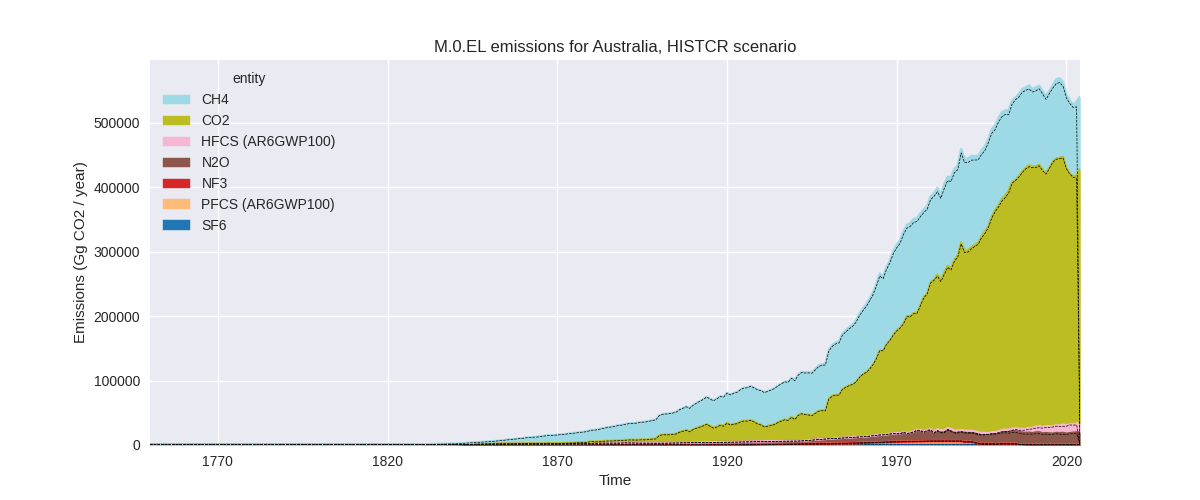
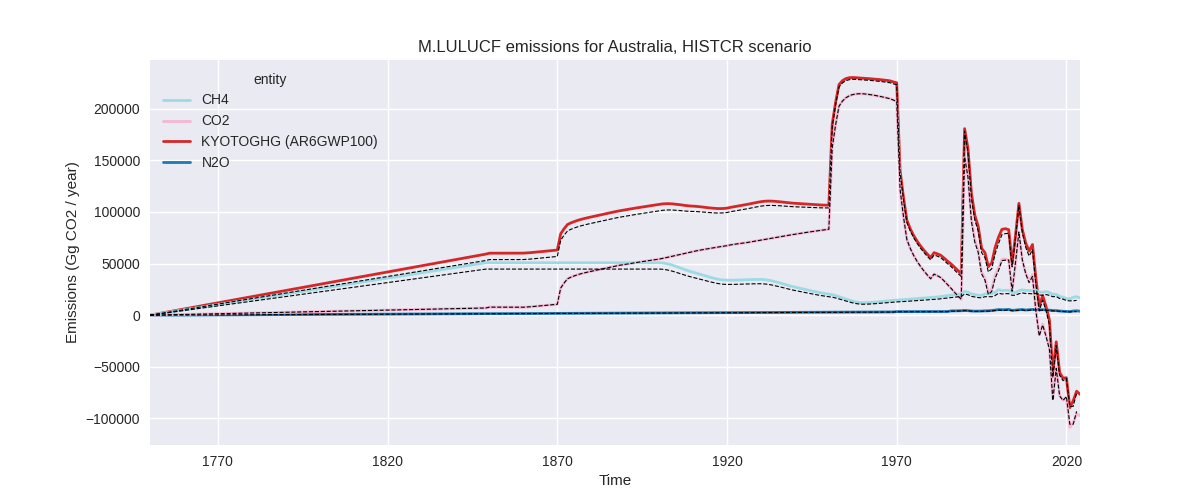
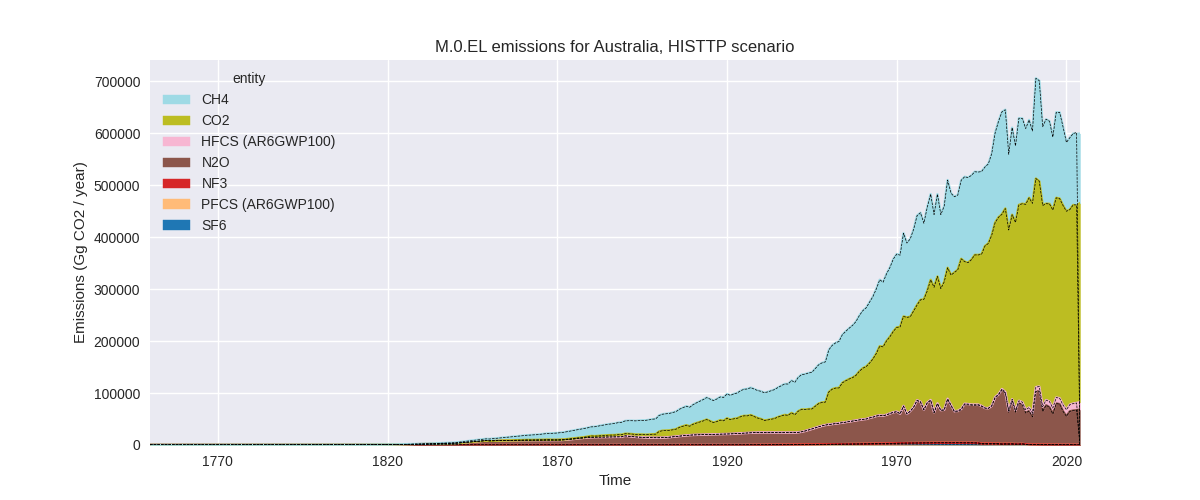
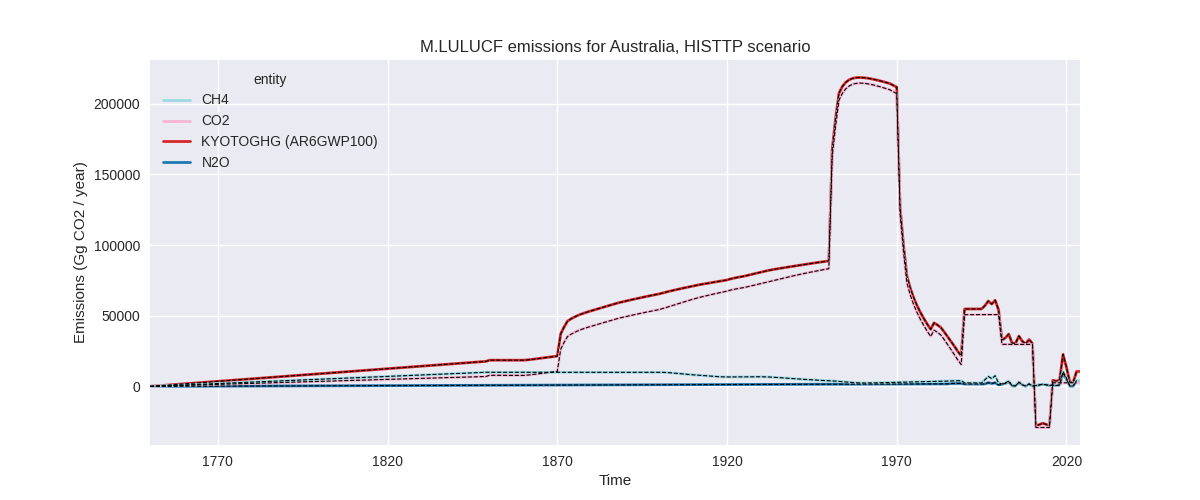
The following figures show the aggregate national total emissions excluding LULUCF AR6GWP100 for the country reported priority scenario. The dotted linesshow the v2.6.1_final data.
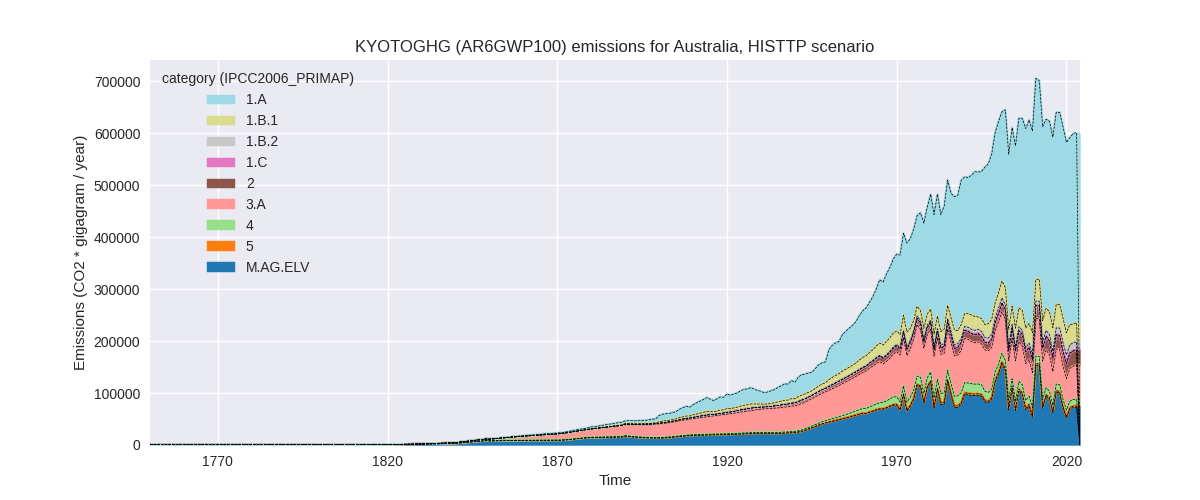
The following figures show the aggregate national total emissions excluding LULUCF AR6GWP100 for the third party priority scenario. The dotted linesshow the v2.6.1_final data.
Overview over changes
In the country reported priority scenario we have the following changes for aggregate Kyoto GHG and national total emissions excluding LULUCF (M.0.EL):
- Emissions in 2023 have changed by 1.5%% (7696.94 Gg CO2 / year)
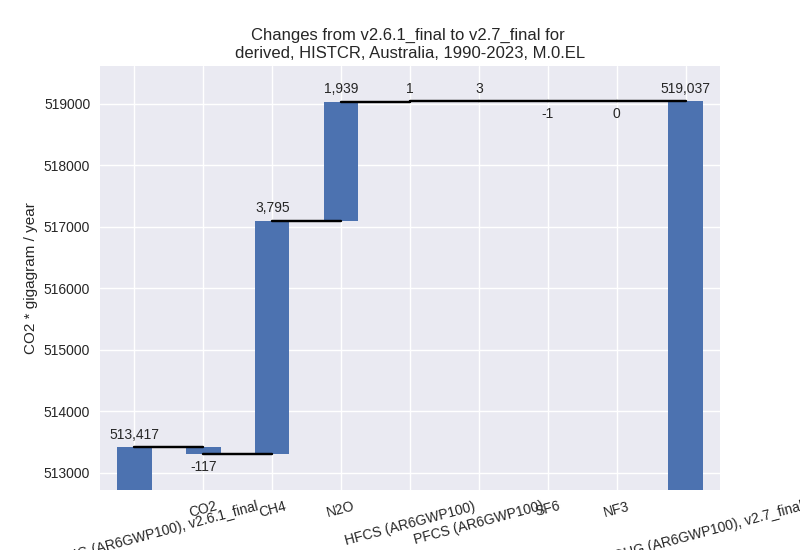
- Emissions in 1990-2023 have changed by 1.1%% (5620.04 Gg CO2 / year)
In the third party priority scenario we have the following changes for aggregate Kyoto GHG and national total emissions excluding LULUCF (M.0.EL):
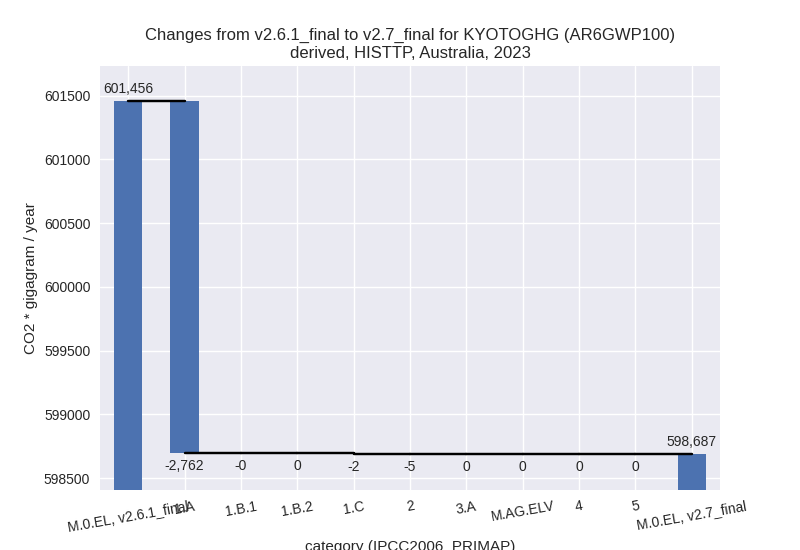
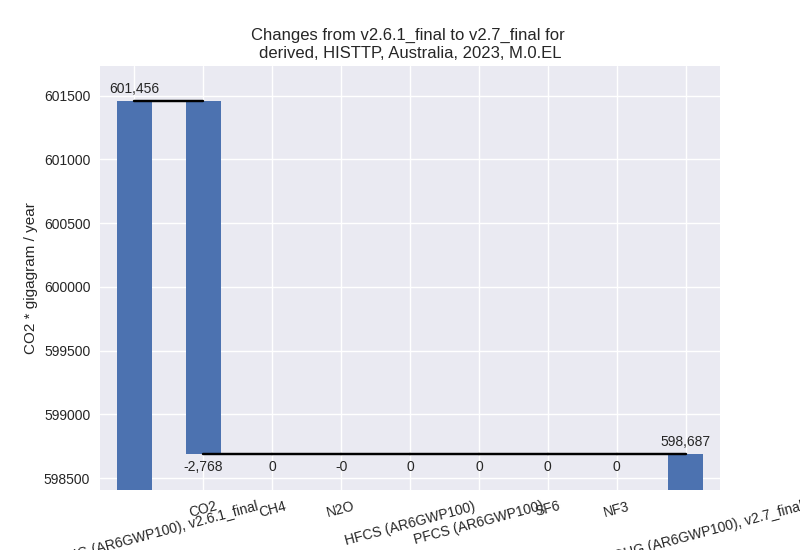
- Emissions in 2023 have changed by -0.5%% (-2768.38 Gg CO2 / year)
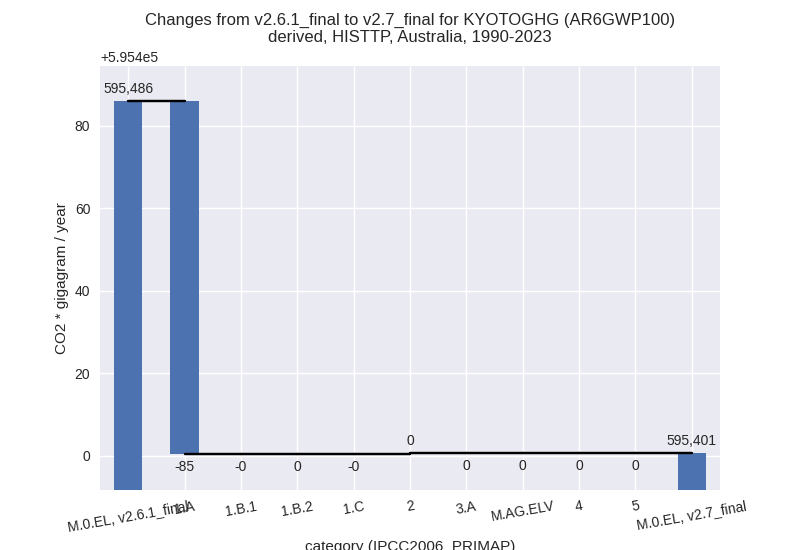
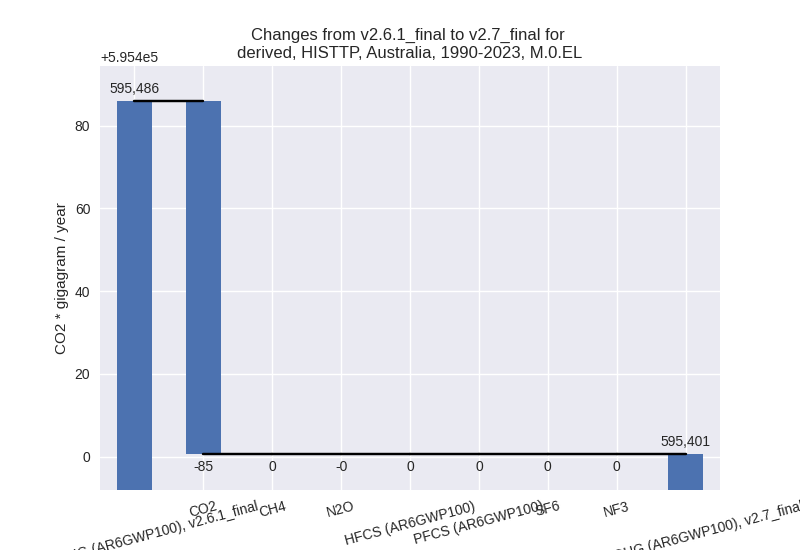
- Emissions in 1990-2023 have changed by -0.0%% (-85.29 Gg CO2 / year)
Most important changes per scenario and time frame
In the country reported priority scenario the following sector-gas combinations have the highest absolute impact on national total KyotoGHG (AR6GWP100) emissions in 2023 (top 5):
- 1: 3.A, CH4 with 2895.28 Gg CO2 / year (4.6%)
- 2: 5, N2O with 2410.92 Gg CO2 / year (inf%)
- 3: 1.A, CO2 with 1744.77 Gg CO2 / year (0.5%)
- 4: 1.B.2, CH4 with 602.32 Gg CO2 / year (8.5%)
- 5: 1.A, N2O with -499.65 Gg CO2 / year (-19.3%)
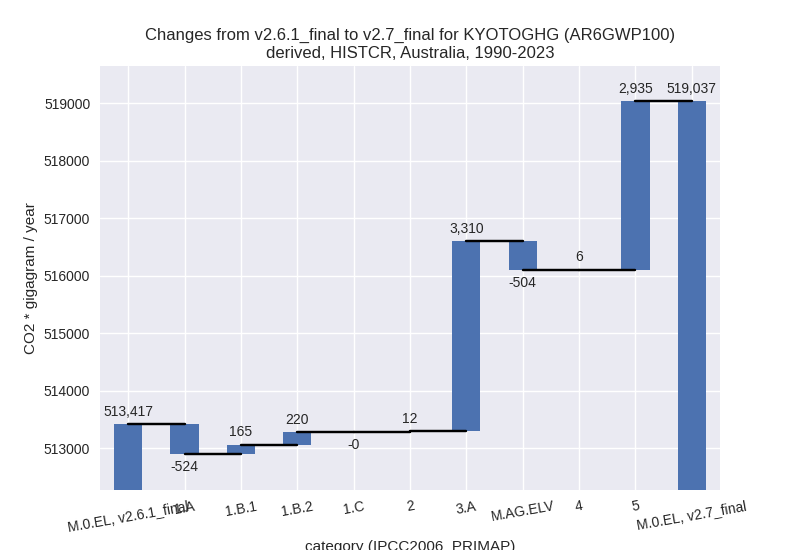
In the country reported priority scenario the following sector-gas combinations have the highest absolute impact on national total KyotoGHG (AR6GWP100) emissions in 1990-2023 (top 5):
- 1: 3.A, CH4 with 3319.97 Gg CO2 / year (4.9%)
- 2: 5, N2O with 2729.19 Gg CO2 / year (inf%)
- 3: M.AG.ELV, N2O with -508.06 Gg CO2 / year (-4.8%)
- 4: 1.B.2, CH4 with 303.01 Gg CO2 / year (4.2%)
- 5: 1.A, N2O with -271.74 Gg CO2 / year (-9.7%)
In the third party priority scenario the following sector-gas combinations have the highest absolute impact on national total KyotoGHG (AR6GWP100) emissions in 2023 (top 5):
- 1: 1.A, CO2 with -2761.93 Gg CO2 / year (-0.8%)
- 2: 2, CO2 with -4.63 Gg CO2 / year (-0.0%)
- 3: 1.C, CO2 with -1.55 Gg CO2 / year (-40.0%)
- 4: 2, N2O with -0.18 Gg CO2 / year (-0.0%)
- 5: 1.B.1, N2O with -0.10 Gg CO2 / year (-20.2%)
In the third party priority scenario the following sector-gas combinations have the highest absolute impact on national total KyotoGHG (AR6GWP100) emissions in 1990-2023 (top 5):
- 1: 1.A, CO2 with -85.49 Gg CO2 / year (-0.0%)
- 2: 2, CO2 with 0.25 Gg CO2 / year (0.0%)
- 3: 1.C, CO2 with -0.05 Gg CO2 / year (-8.2%)
- 4: 2, N2O with -0.01 Gg CO2 / year (-0.0%)
- 5: 1.B.1, N2O with -0.00 Gg CO2 / year (-2.0%)
Notes on data changes
Here we list notes explaining important emissions changes for the country.
- Data from BTR1 has been replaced by data from the 2025 National Inventory Submission. This leads to changes in several sectors and gases which are small in terms of total emissions.
- N2O in the “other” category is now non-zero as it is no longer marked “NO” (not occurring) which we interpret as 0 but “NA” (not applicable) which we interpret as missing data and fill using third party sources (EDGAR)
- Higher emissions in the livestock sector (3.A) come from higher estimates of cattle population.
- In 1.A, CO2 country reported data replaces EI based extrapolation for 2023 leading to a very small incre4ase in emissions.
- Lower N2O in 1.A comes from lower liquid fuel emissions factors.
- Higher CH4 in 1.B.2 comes from higher gas flaring emissions.
- Lower N2O in agriculture excluding livestock mainly comes from lower estimates of indirect N2O from managed soils.
- Changes in the TP scenario are very small and mainly come from the updated EI data for energy CO2.
Changes by sector and gas
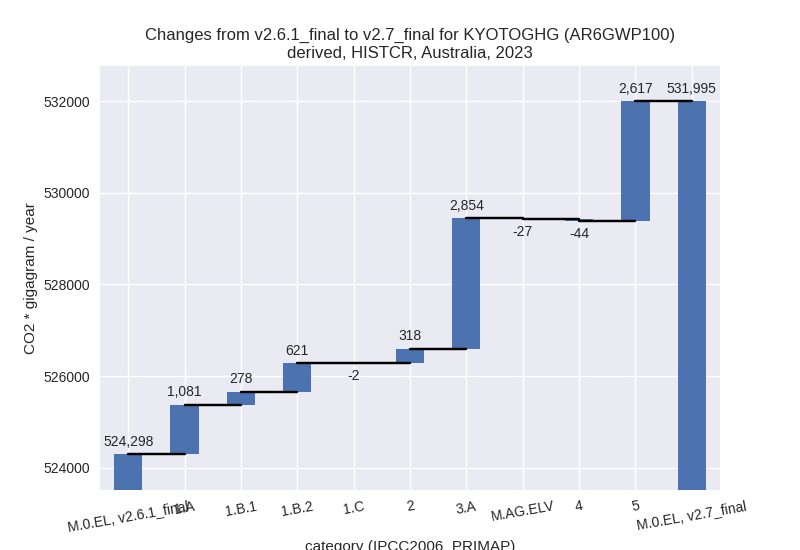
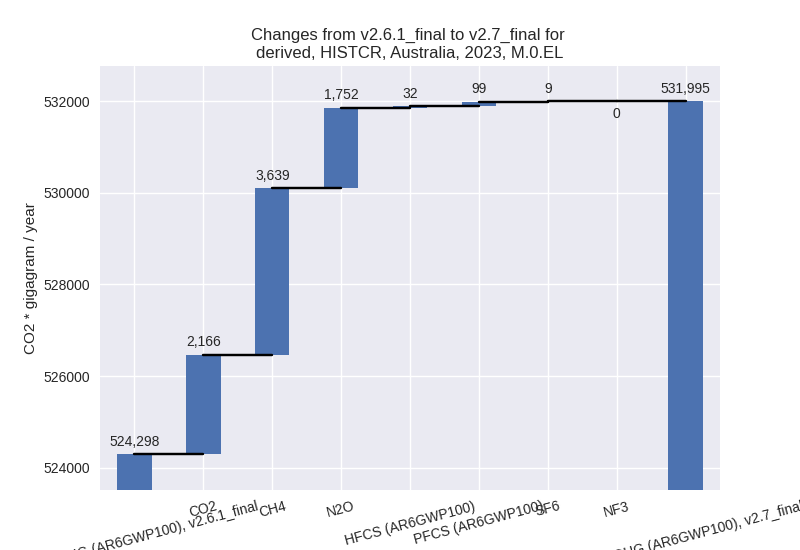
For each scenario and time frame the changes are displayed for all individual sectors and all individual gases. In the sector plot we use aggregate Kyoto GHGs in AR6GWP100. In the gas plot we usenational total emissions without LULUCF.
country reported scenario
2023
1990-2023
third party scenario
2023
1990-2023
Detailed changes for the scenarios:
country reported scenario (HISTCR):
Most important changes per time frame
For 2023 the following sector-gas combinations have the highest absolute impact on national total KyotoGHG (AR6GWP100) emissions in 2023 (top 5):
- 1: 3.A, CH4 with 2895.28 Gg CO2 / year (4.6%)
- 2: 5, N2O with 2410.92 Gg CO2 / year (inf%)
- 3: 1.A, CO2 with 1744.77 Gg CO2 / year (0.5%)
- 4: 1.B.2, CH4 with 602.32 Gg CO2 / year (8.5%)
- 5: 1.A, N2O with -499.65 Gg CO2 / year (-19.3%)
For 1990-2023 the following sector-gas combinations have the highest absolute impact on national total KyotoGHG (AR6GWP100) emissions in 1990-2023 (top 5):
- 1: 3.A, CH4 with 3319.97 Gg CO2 / year (4.9%)
- 2: 5, N2O with 2729.19 Gg CO2 / year (inf%)
- 3: M.AG.ELV, N2O with -508.06 Gg CO2 / year (-4.8%)
- 4: 1.B.2, CH4 with 303.01 Gg CO2 / year (4.2%)
- 5: 1.A, N2O with -271.74 Gg CO2 / year (-9.7%)
Changes in the main sectors for aggregate KyotoGHG (AR6GWP100) are
- 1: Total sectoral emissions in 2022 are 397004.75 Gg CO2 / year which is 75.2% of M.0.EL emissions. 2023 Emissions have changed by 0.5% (1978.38 Gg CO2 / year). 1990-2023 Emissions have changed by -0.0% (-138.91 Gg CO2 / year).
- 2: Total sectoral emissions in 2022 are 35002.64 Gg CO2 / year which is 6.6% of M.0.EL emissions. 2023 Emissions have changed by 0.9% (318.10 Gg CO2 / year). 1990-2023 Emissions have changed by 0.0% (12.02 Gg CO2 / year).
- M.AG: Total sectoral emissions in 2022 are 79766.93
Gg CO2 / year which is 15.1% of M.0.EL emissions. 2023 Emissions have
changed by 3.5% (2827.28 Gg CO2 /
year). 1990-2023 Emissions have changed by 3.4% (2806.13 Gg CO2 / year). For 2023 the
changes per gas
are:
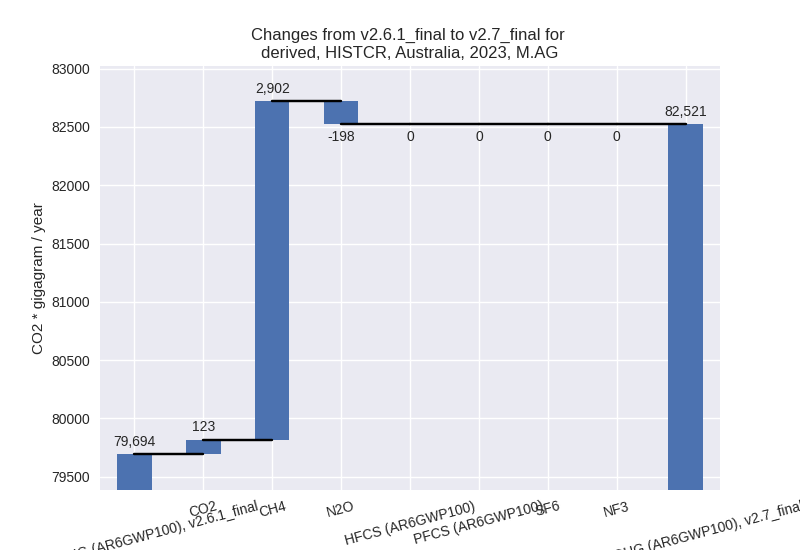
For 1990-2023 the changes per gas are: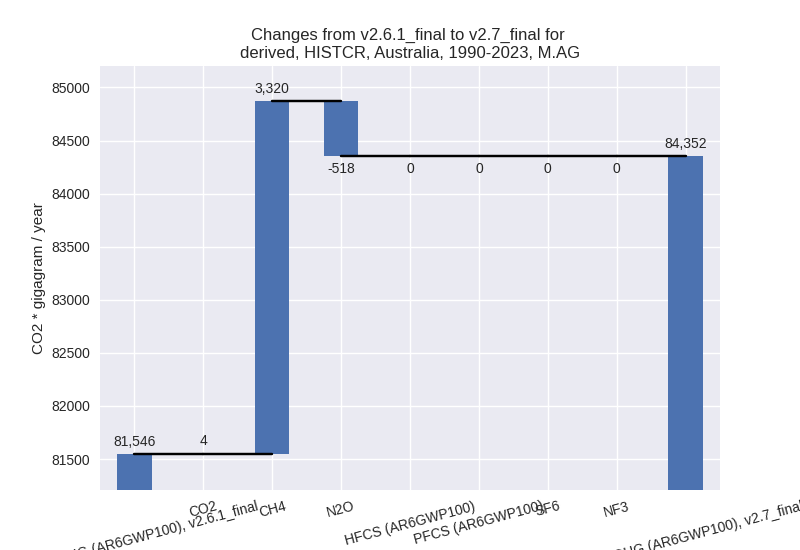
The changes come from the following subsectors:- 3.A: Total sectoral emissions in 2022 are 63990.73
Gg CO2 / year which is 80.2% of category M.AG emissions. 2023 Emissions
have changed by 4.5% (2854.26 Gg CO2
/ year). 1990-2023 Emissions have changed by 4.8% (3310.35 Gg CO2 / year). For 2023 the
changes per gas
are:
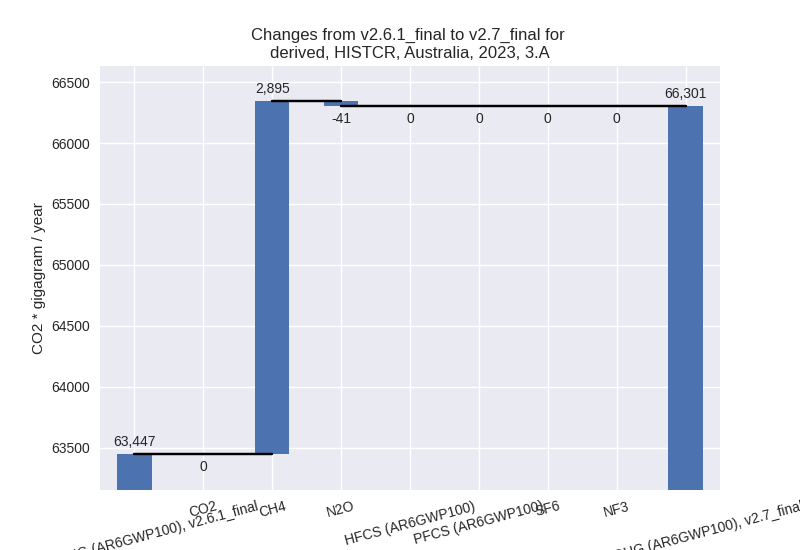
For 1990-2023 the changes per gas are: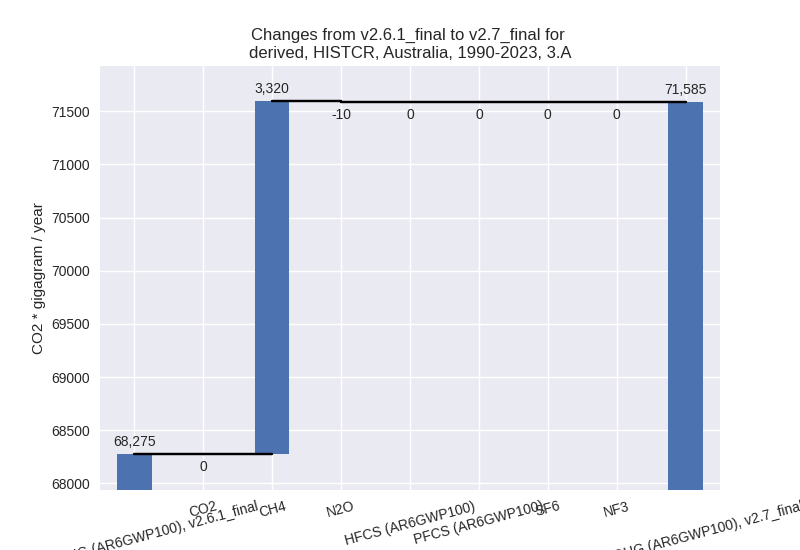
There is no subsector information available in PRIMAP-hist. - M.AG.ELV: Total sectoral emissions in 2022 are
15776.20 Gg CO2 / year which is 19.8% of category M.AG emissions. 2023
Emissions have changed by -0.2%
(-26.98 Gg CO2 / year). 1990-2023 Emissions have changed by -3.8% (-504.22 Gg CO2 / year). For
1990-2023 the changes per gas
are:
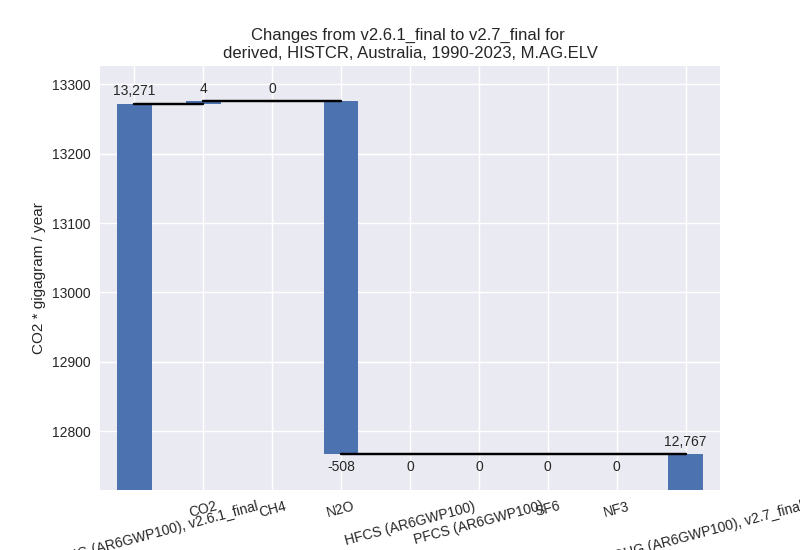
There is no subsector information available in PRIMAP-hist.
- 3.A: Total sectoral emissions in 2022 are 63990.73
Gg CO2 / year which is 80.2% of category M.AG emissions. 2023 Emissions
have changed by 4.5% (2854.26 Gg CO2
/ year). 1990-2023 Emissions have changed by 4.8% (3310.35 Gg CO2 / year). For 2023 the
changes per gas
are:
- 4: Total sectoral emissions in 2022 are 14002.45 Gg CO2 / year which is 2.7% of M.0.EL emissions. 2023 Emissions have changed by -0.3% (-43.69 Gg CO2 / year). 1990-2023 Emissions have changed by 0.0% (5.66 Gg CO2 / year).
- 5: Total sectoral emissions in 2022 are 2231.24 Gg
CO2 / year which is 0.4% of M.0.EL emissions. 2023 Emissions have
changed by inf% (2616.86 Gg CO2 /
year). 1990-2023 Emissions have changed by inf% (2935.13 Gg CO2 / year). For 2023 the
changes per gas
are:
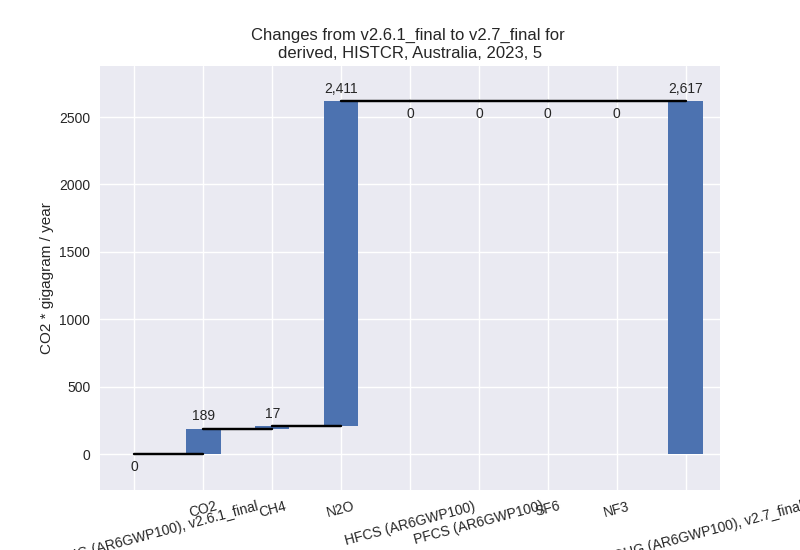
For 1990-2023 the changes per gas are: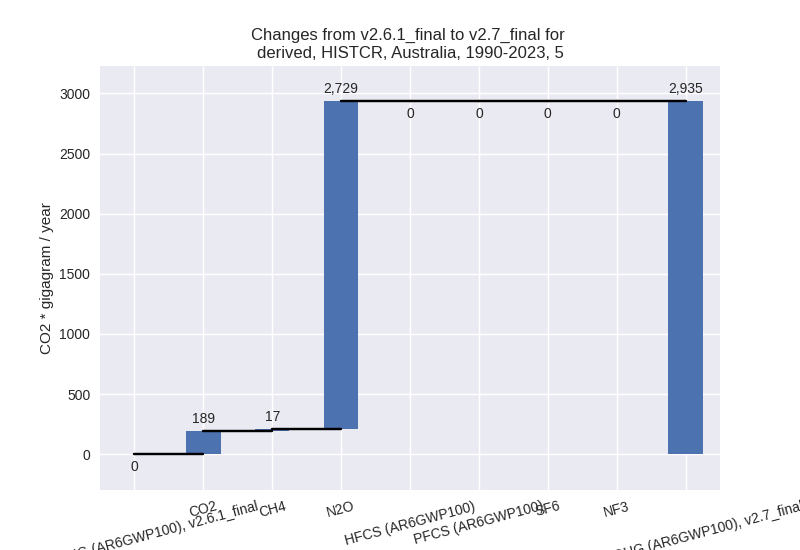
third party scenario (HISTTP):
Most important changes per time frame
For 2023 the following sector-gas combinations have the highest absolute impact on national total KyotoGHG (AR6GWP100) emissions in 2023 (top 5):
- 1: 1.A, CO2 with -2761.93 Gg CO2 / year (-0.8%)
- 2: 2, CO2 with -4.63 Gg CO2 / year (-0.0%)
- 3: 1.C, CO2 with -1.55 Gg CO2 / year (-40.0%)
- 4: 2, N2O with -0.18 Gg CO2 / year (-0.0%)
- 5: 1.B.1, N2O with -0.10 Gg CO2 / year (-20.2%)
For 1990-2023 the following sector-gas combinations have the highest absolute impact on national total KyotoGHG (AR6GWP100) emissions in 1990-2023 (top 5):
- 1: 1.A, CO2 with -85.49 Gg CO2 / year (-0.0%)
- 2: 2, CO2 with 0.25 Gg CO2 / year (0.0%)
- 3: 1.C, CO2 with -0.05 Gg CO2 / year (-8.2%)
- 4: 2, N2O with -0.01 Gg CO2 / year (-0.0%)
- 5: 1.B.1, N2O with -0.00 Gg CO2 / year (-2.0%)
Changes in the main sectors for aggregate KyotoGHG (AR6GWP100) are
- 1: Total sectoral emissions in 2022 are 418297.87 Gg CO2 / year which is 69.8% of M.0.EL emissions. 2023 Emissions have changed by -0.7% (-2763.57 Gg CO2 / year). 1990-2023 Emissions have changed by -0.0% (-85.53 Gg CO2 / year).
- 2: Total sectoral emissions in 2022 are 29323.60 Gg CO2 / year which is 4.9% of M.0.EL emissions. 2023 Emissions have changed by -0.0% (-4.80 Gg CO2 / year). 1990-2023 Emissions have changed by 0.0% (0.25 Gg CO2 / year).
- M.AG: Total sectoral emissions in 2022 are 136839.89 Gg CO2 / year which is 22.8% of M.0.EL emissions. 2023 Emissions have changed by 0.0% (0.00 Gg CO2 / year). 1990-2023 Emissions have changed by 0.0% (0.00 Gg CO2 / year).
- 4: Total sectoral emissions in 2022 are 12702.63 Gg CO2 / year which is 2.1% of M.0.EL emissions. 2023 Emissions have changed by 0.0% (0.00 Gg CO2 / year). 1990-2023 Emissions have changed by 0.0% (0.00 Gg CO2 / year).
- 5: Total sectoral emissions in 2022 are 2231.24 Gg CO2 / year which is 0.4% of M.0.EL emissions. 2023 Emissions have changed by 0.0% (0.00 Gg CO2 / year). 1990-2023 Emissions have changed by 0.0% (0.00 Gg CO2 / year).