Changes in PRIMAP-hist v2.7_final compared to v2.6.1_final for Cuba
2025-09-11
Johannes Gütschow
Change analysis for Cuba for PRIMAP-hist v2.7_final compared to v2.6.1_final
Overview over emissions by sector and gas
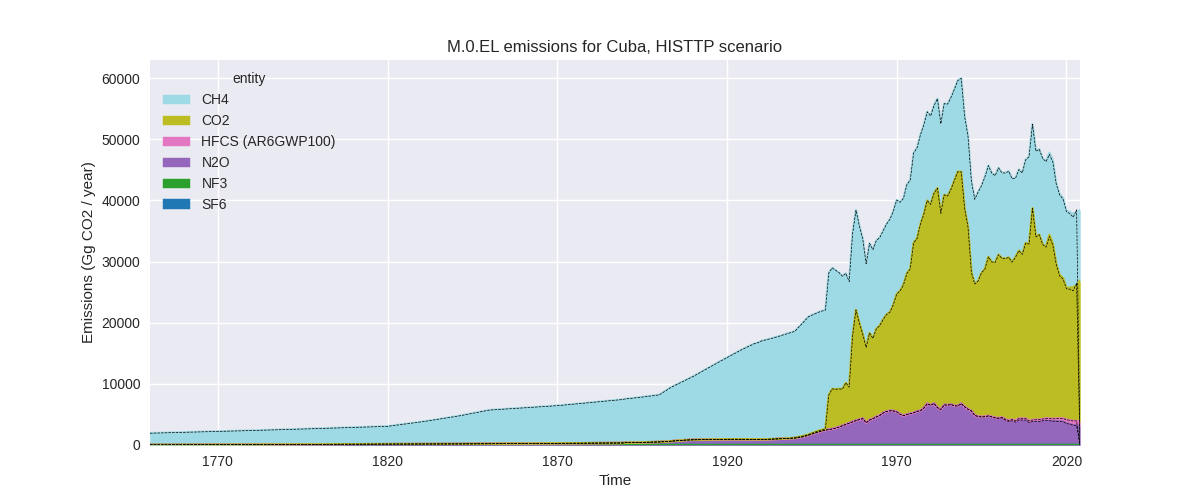
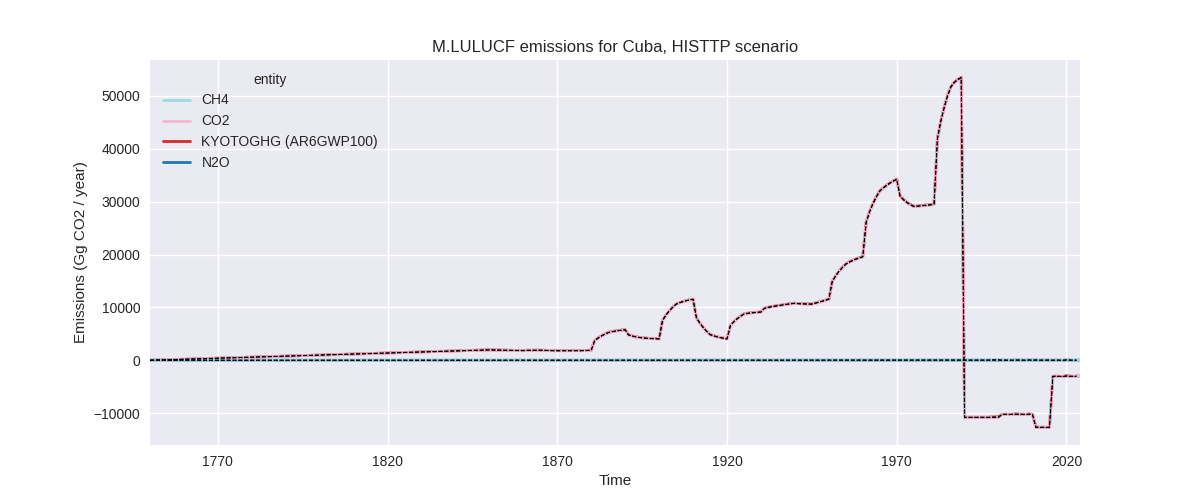
The following figures show the aggregate national total emissions excluding LULUCF AR6GWP100 for the country reported priority scenario. The dotted linesshow the v2.6.1_final data.
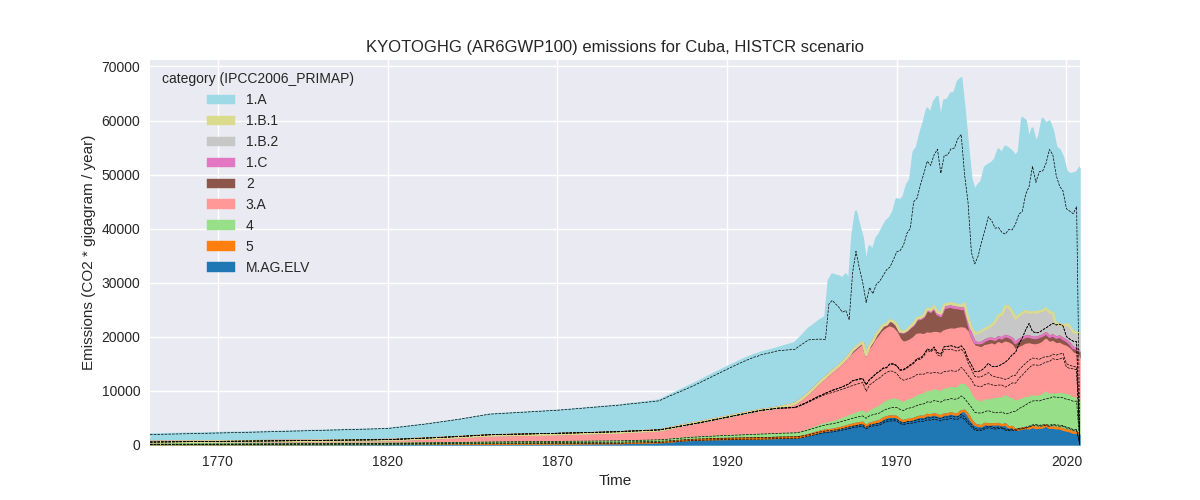
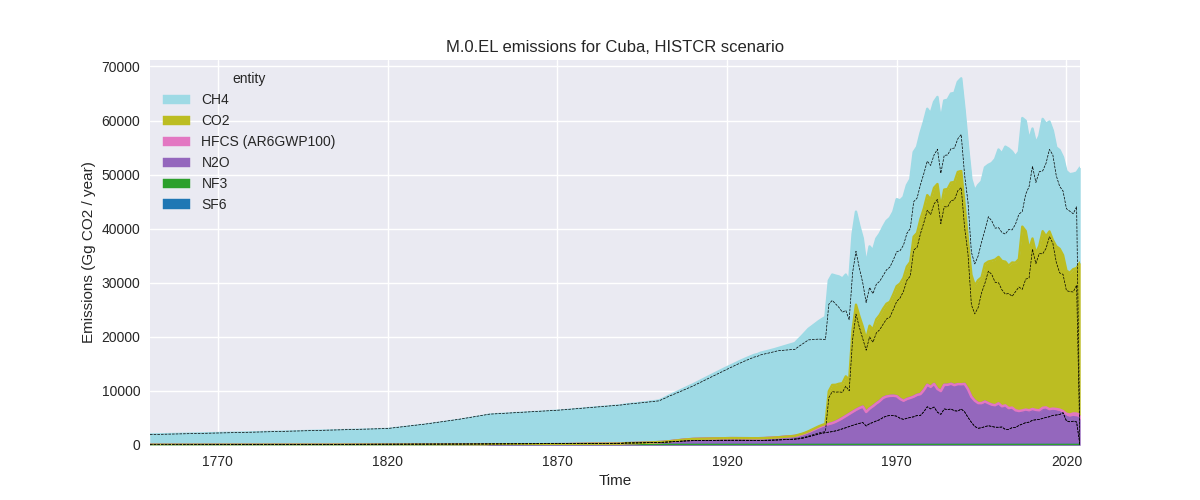
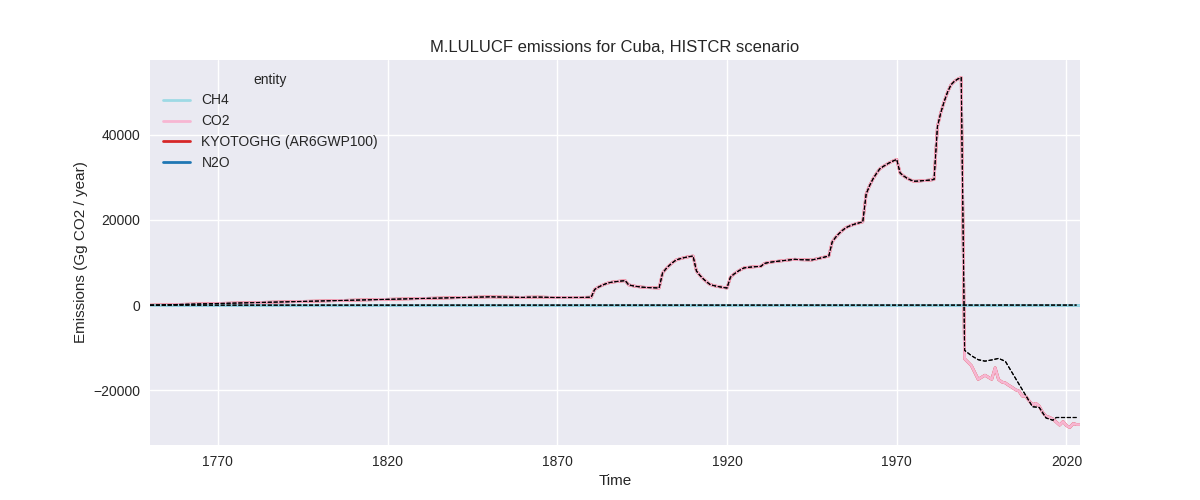
The following figures show the aggregate national total emissions excluding LULUCF AR6GWP100 for the third party priority scenario. The dotted linesshow the v2.6.1_final data.
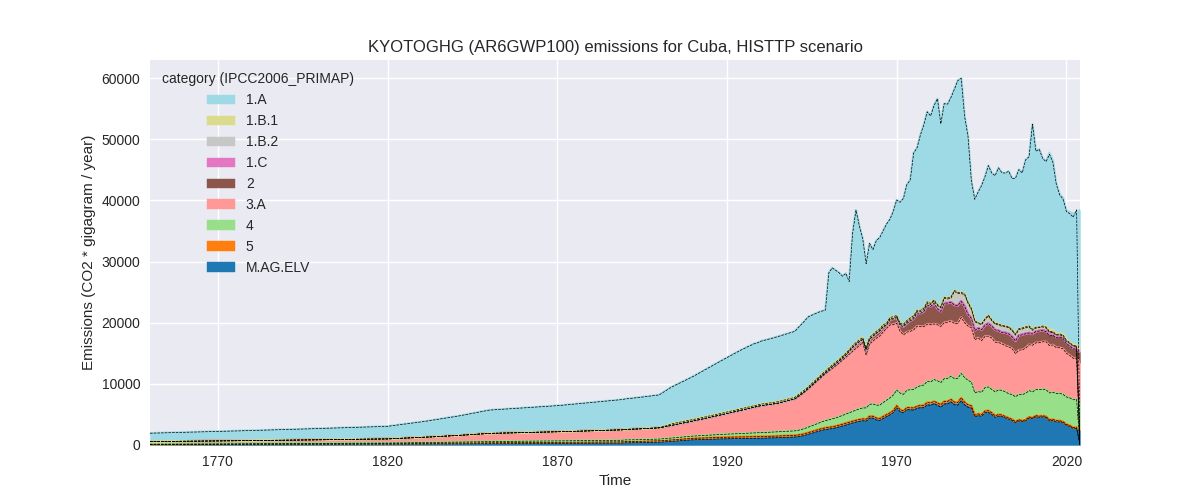
Overview over changes
In the country reported priority scenario we have the following changes for aggregate Kyoto GHG and national total emissions excluding LULUCF (M.0.EL):
- Emissions in 2023 have changed by 14.3%% (6303.71 Gg CO2 / year)
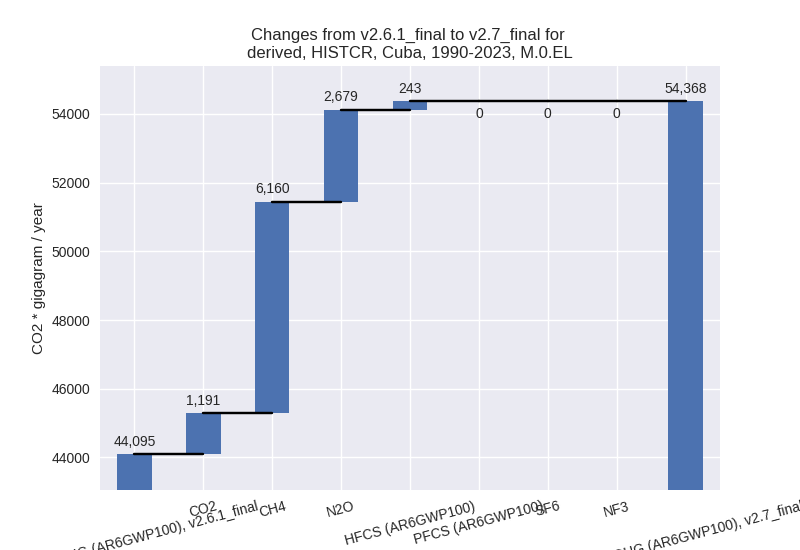
- Emissions in 1990-2023 have changed by 23.3%% (10272.99 Gg CO2 / year)
In the third party priority scenario we have the following changes for aggregate Kyoto GHG and national total emissions excluding LULUCF (M.0.EL):
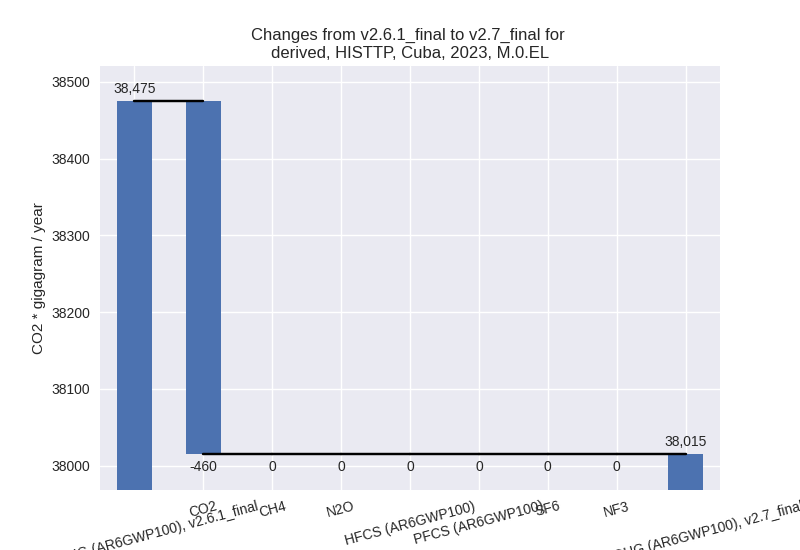
- Emissions in 2023 have changed by -1.2%% (-459.92 Gg CO2 / year)
- Emissions in 1990-2023 have changed by 0.1%% (41.54 Gg CO2 / year)
Most important changes per scenario and time frame
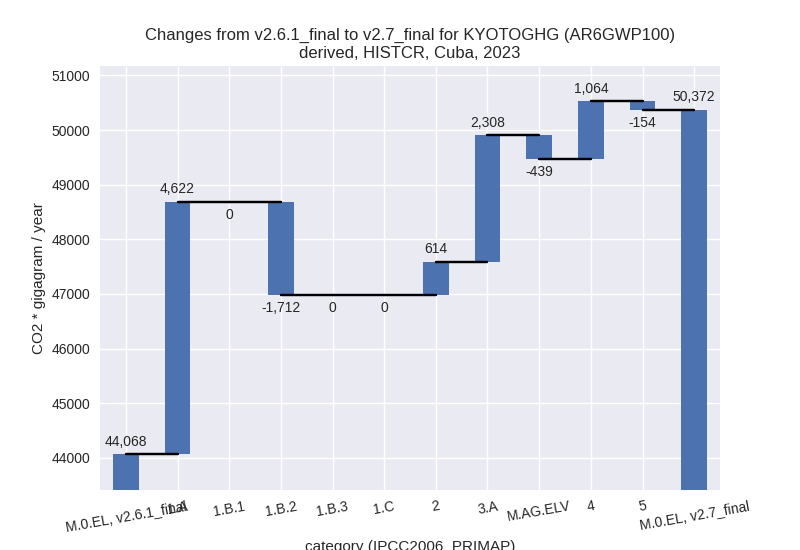
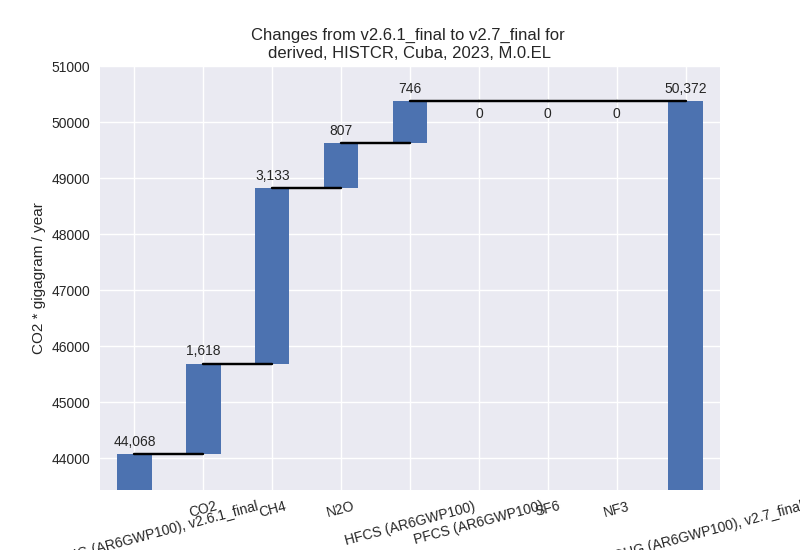
In the country reported priority scenario the following sector-gas combinations have the highest absolute impact on national total KyotoGHG (AR6GWP100) emissions in 2023 (top 5):
- 1: 3.A, CH4 with 2711.33 Gg CO2 / year (61.3%)
- 2: 1.B.2, CH4 with -1707.96 Gg CO2 / year (-36.3%)
- 3: 1.A, CO2 with 1688.71 Gg CO2 / year (6.8%)
- 4: 1.A, N2O with 1681.19 Gg CO2 / year (2022.5%)
- 5: 1.A, CH4 with 1252.18 Gg CO2 / year (2326.8%)
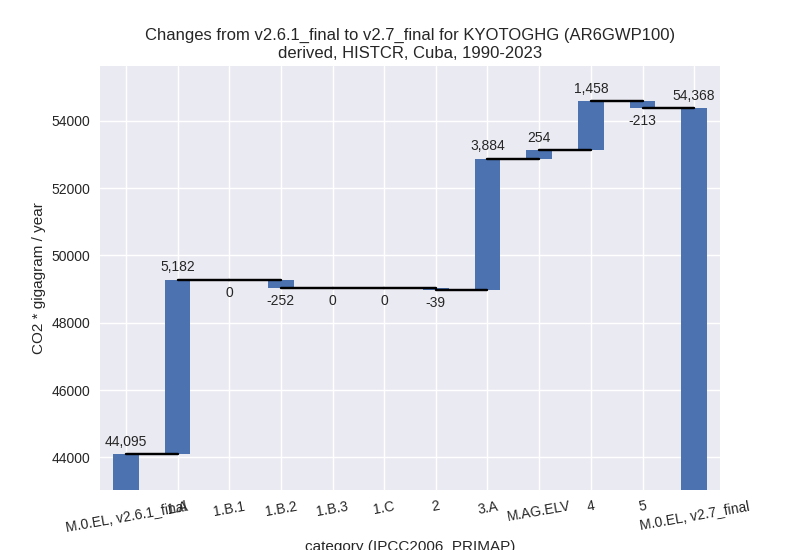
In the country reported priority scenario the following sector-gas combinations have the highest absolute impact on national total KyotoGHG (AR6GWP100) emissions in 1990-2023 (top 5):
- 1: 3.A, CH4 with 3489.34 Gg CO2 / year (69.2%)
- 2: 1.A, N2O with 2152.33 Gg CO2 / year (1385.3%)
- 3: 1.A, CH4 with 1548.35 Gg CO2 / year (876.4%)
- 4: 1.A, CO2 with 1480.92 Gg CO2 / year (5.8%)
- 5: 4, CH4 with 1446.97 Gg CO2 / year (38.5%)
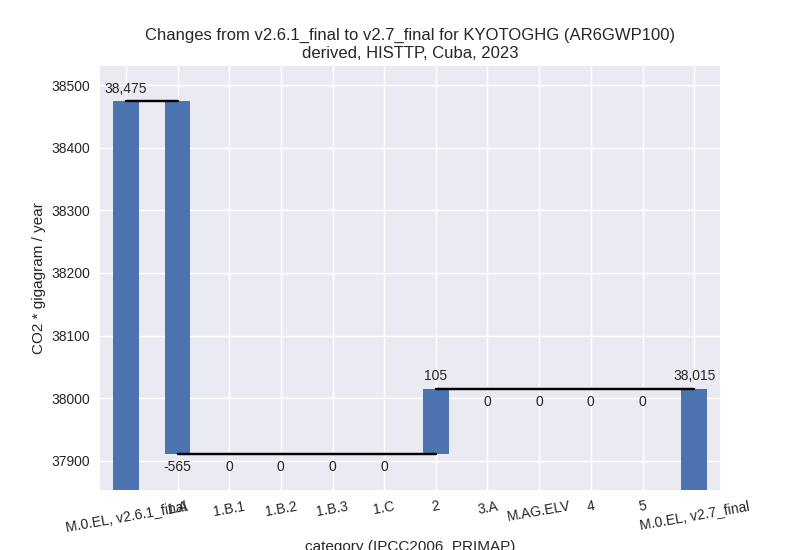
In the third party priority scenario the following sector-gas combinations have the highest absolute impact on national total KyotoGHG (AR6GWP100) emissions in 2023 (top 5):
- 1: 1.A, CO2 with -564.52 Gg CO2 / year (-2.6%)
- 2: 2, CO2 with 104.60 Gg CO2 / year (24.8%)
- 3: 1.A, CH4 with 0.00 Gg CO2 / year (0.0%)
- 4: 2, HFCS (AR6GWP100) with 0.00 Gg CO2 / year (0.0%)
- 5: 5, N2O with 0.00 Gg CO2 / year (0.0%)
In the third party priority scenario the following sector-gas combinations have the highest absolute impact on national total KyotoGHG (AR6GWP100) emissions in 1990-2023 (top 5):
- 1: 2, CO2 with 40.00 Gg CO2 / year (3.6%)
- 2: 1.A, CO2 with 1.54 Gg CO2 / year (0.0%)
- 3: 1.A, CH4 with 0.00 Gg CO2 / year (0.0%)
- 4: 2, HFCS (AR6GWP100) with 0.00 Gg CO2 / year (0.0%)
- 5: 5, N2O with 0.00 Gg CO2 / year (0.0%)
Notes on data changes
Here we list notes explaining important emissions changes for the country.
- CRT data from BTR1 has been added which replaces and extends data
from BUR1, NC3 and UNFCCCDI. This introduces high changes for all years
and many sectors.
- CH4 from livestock is now much higher for all years and more in line with third party data. The N2O time-series is now more stable and no longer almost zero until 2002.
- Fugitive CH4 from oil and gas if higher pre-2006 and lower post-2006 now. The emissions estimates are still much higher than in EDGAR data.
- For the energy sector the non-CO2 emissions have increased by several 100 percent. CO2 is similar for most years but higher post-2016 as country reported data with higher growth rates replaces extrapolation with CDIAC and EI data.
- Emissions from waste are higher for CH4 and lower for N2O.
- Changes in the TP scenario are very small and mainly come from the updated EI data for energy CO2. CO2 from Chemical industry is also influenced by the new CR data as the EDGAR time series ends in 2013.
Changes by sector and gas
For each scenario and time frame the changes are displayed for all individual sectors and all individual gases. In the sector plot we use aggregate Kyoto GHGs in AR6GWP100. In the gas plot we usenational total emissions without LULUCF.
country reported scenario
2023
1990-2023
third party scenario
2023
1990-2023
Detailed changes for the scenarios:
country reported scenario (HISTCR):
Most important changes per time frame
For 2023 the following sector-gas combinations have the highest absolute impact on national total KyotoGHG (AR6GWP100) emissions in 2023 (top 5):
- 1: 3.A, CH4 with 2711.33 Gg CO2 / year (61.3%)
- 2: 1.B.2, CH4 with -1707.96 Gg CO2 / year (-36.3%)
- 3: 1.A, CO2 with 1688.71 Gg CO2 / year (6.8%)
- 4: 1.A, N2O with 1681.19 Gg CO2 / year (2022.5%)
- 5: 1.A, CH4 with 1252.18 Gg CO2 / year (2326.8%)
For 1990-2023 the following sector-gas combinations have the highest absolute impact on national total KyotoGHG (AR6GWP100) emissions in 1990-2023 (top 5):
- 1: 3.A, CH4 with 3489.34 Gg CO2 / year (69.2%)
- 2: 1.A, N2O with 2152.33 Gg CO2 / year (1385.3%)
- 3: 1.A, CH4 with 1548.35 Gg CO2 / year (876.4%)
- 4: 1.A, CO2 with 1480.92 Gg CO2 / year (5.8%)
- 5: 4, CH4 with 1446.97 Gg CO2 / year (38.5%)
Changes in the main sectors for aggregate KyotoGHG (AR6GWP100) are
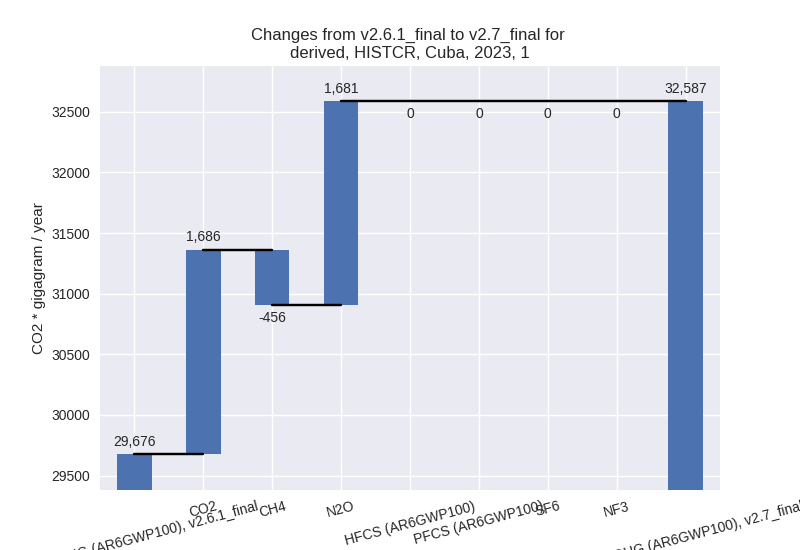
- 1: Total sectoral emissions in 2022 are 32223.89 Gg
CO2 / year which is 64.2% of M.0.EL emissions. 2023 Emissions have
changed by 9.8% (2910.44 Gg CO2 /
year). 1990-2023 Emissions have changed by 16.7% (4929.42 Gg CO2 / year). For 2023
the changes per gas
are:
For 1990-2023 the changes per gas are: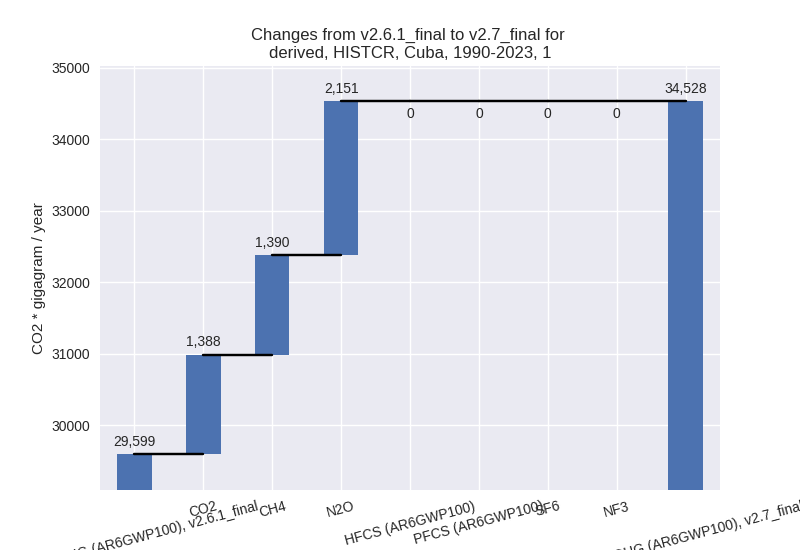
The changes come from the following subsectors:- 1.A: Total sectoral emissions in 2022 are 29279.86
Gg CO2 / year which is 90.9% of category 1 emissions. 2023 Emissions
have changed by 18.5% (4622.08 Gg
CO2 / year). 1990-2023 Emissions have changed by 20.0% (5181.60 Gg CO2 / year). For 2023
the changes per gas
are:
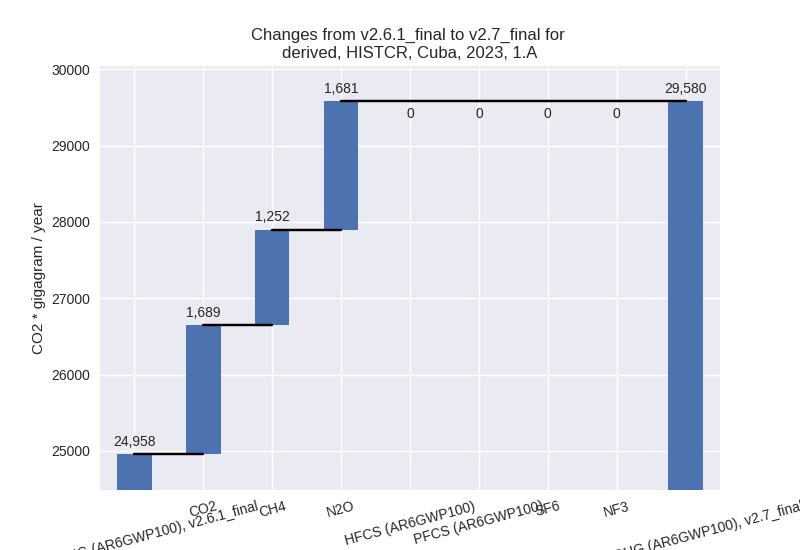
For 1990-2023 the changes per gas are: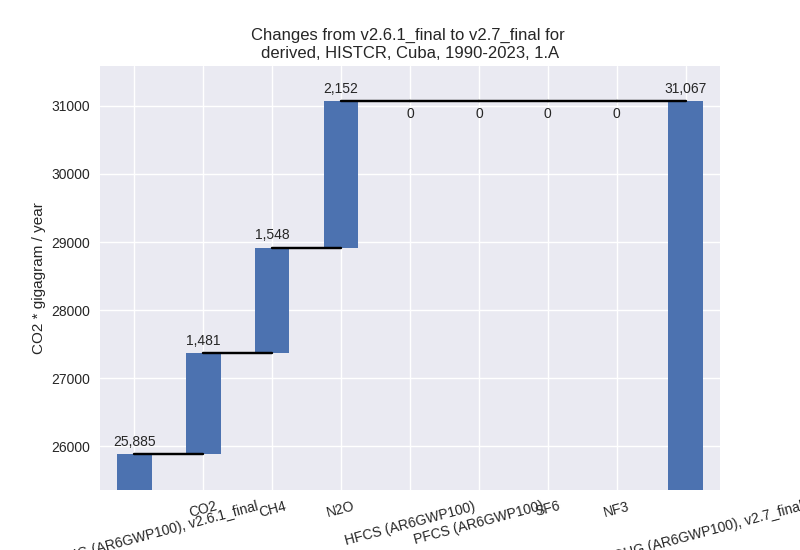
There is no subsector information available in PRIMAP-hist. - 1.B.2: Total sectoral emissions in 2022 are 2944.03
Gg CO2 / year which is 9.1% of category 1 emissions. 2023 Emissions have
changed by -36.3% (-1711.63 Gg CO2 /
year). 1990-2023 Emissions have changed by -6.8% (-252.19 Gg CO2 / year). For 2023
the changes per gas
are:
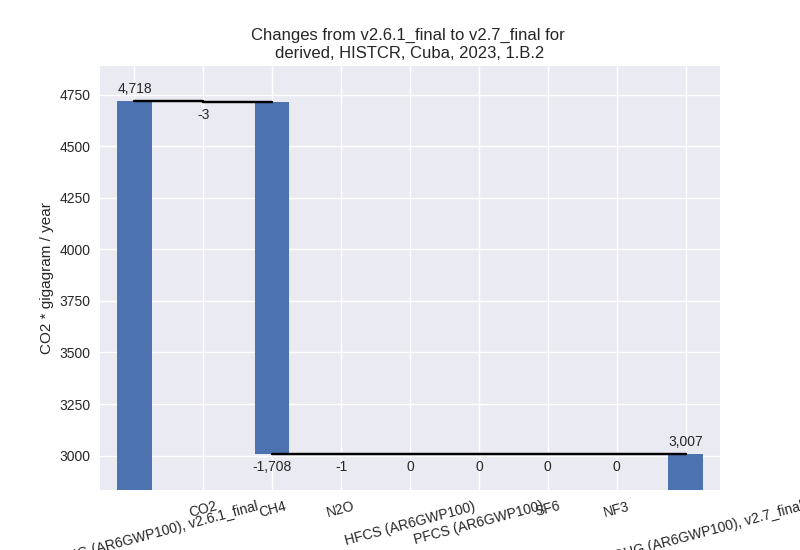
For 1990-2023 the changes per gas are: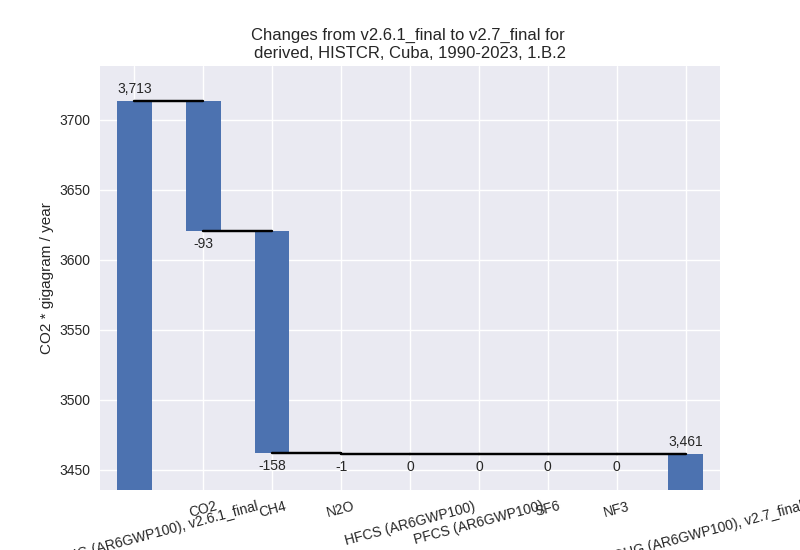
There is no subsector information available in PRIMAP-hist.
- 1.A: Total sectoral emissions in 2022 are 29279.86
Gg CO2 / year which is 90.9% of category 1 emissions. 2023 Emissions
have changed by 18.5% (4622.08 Gg
CO2 / year). 1990-2023 Emissions have changed by 20.0% (5181.60 Gg CO2 / year). For 2023
the changes per gas
are:
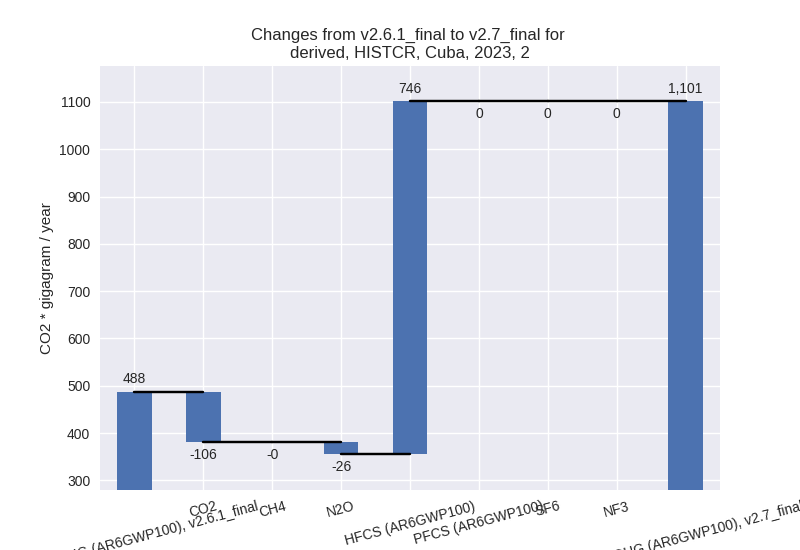
- 2: Total sectoral emissions in 2022 are 1048.70 Gg
CO2 / year which is 2.1% of M.0.EL emissions. 2023 Emissions have
changed by 125.9% (613.77 Gg CO2 /
year). 1990-2023 Emissions have changed by -2.9% (-39.40 Gg CO2 / year). For 2023 the
changes per gas
are:
For 1990-2023 the changes per gas are: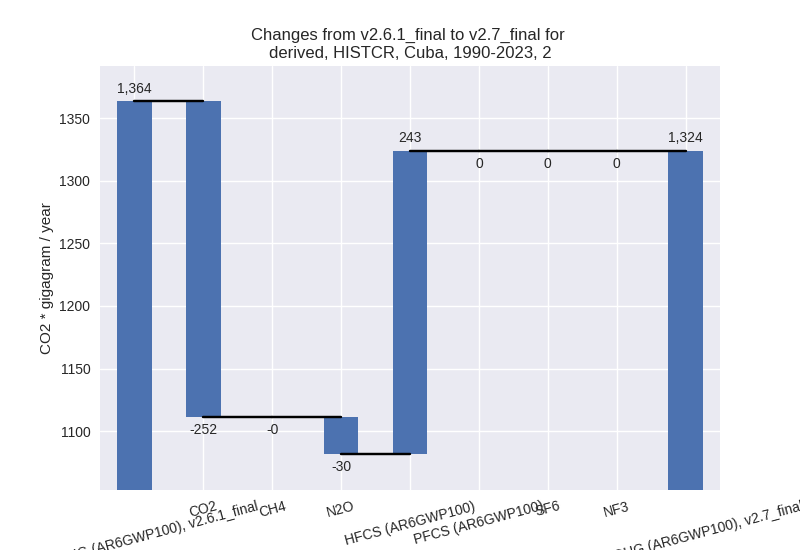
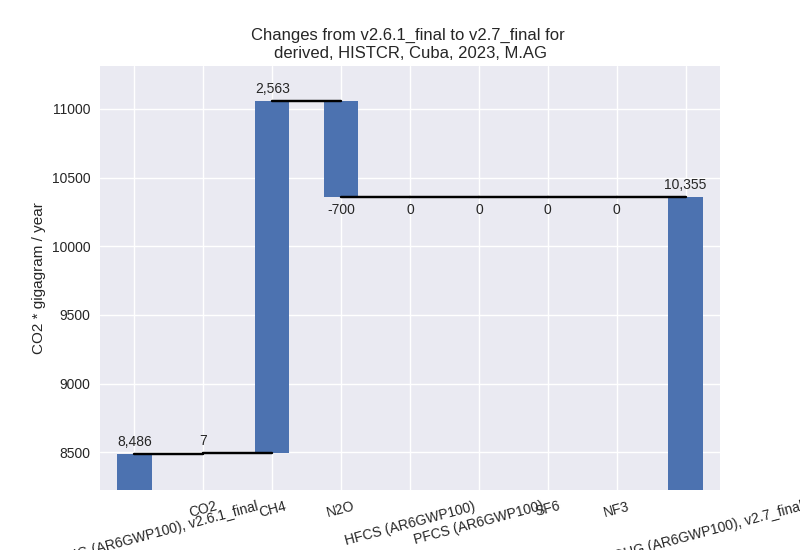
- M.AG: Total sectoral emissions in 2022 are 10609.00
Gg CO2 / year which is 21.1% of M.0.EL emissions. 2023 Emissions have
changed by 22.0% (1869.58 Gg CO2 /
year). 1990-2023 Emissions have changed by 46.0% (4138.37 Gg CO2 / year). For 2023
the changes per gas
are:
For 1990-2023 the changes per gas are: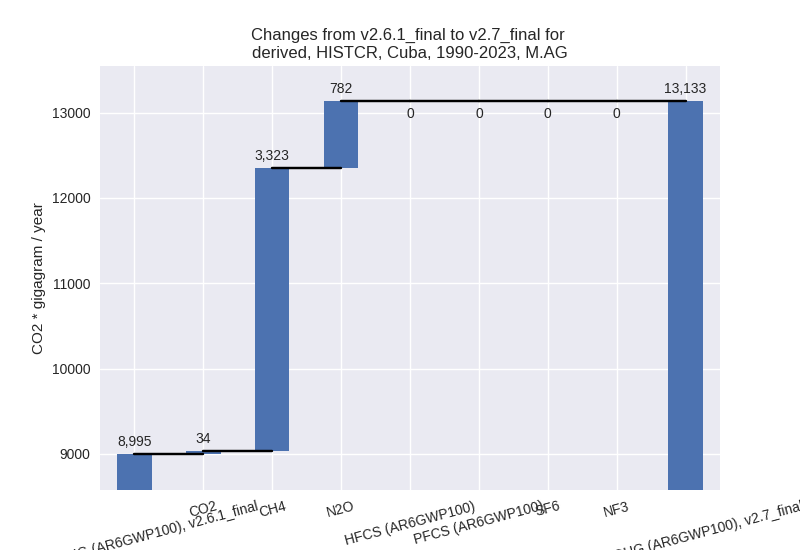
The changes come from the following subsectors:- 3.A: Total sectoral emissions in 2022 are 8326.74
Gg CO2 / year which is 78.5% of category M.AG emissions. 2023 Emissions
have changed by 39.9% (2308.27 Gg
CO2 / year). 1990-2023 Emissions have changed by 66.9% (3883.96 Gg CO2 / year). For 2023
the changes per gas
are:
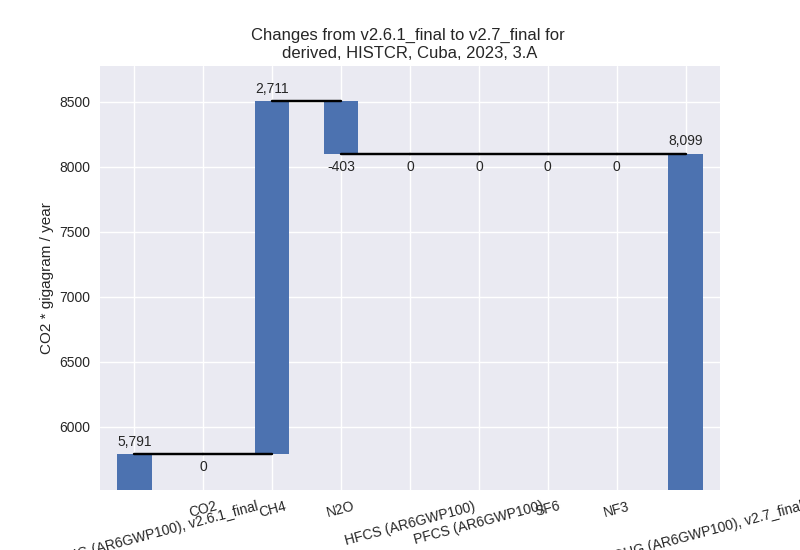
For 1990-2023 the changes per gas are: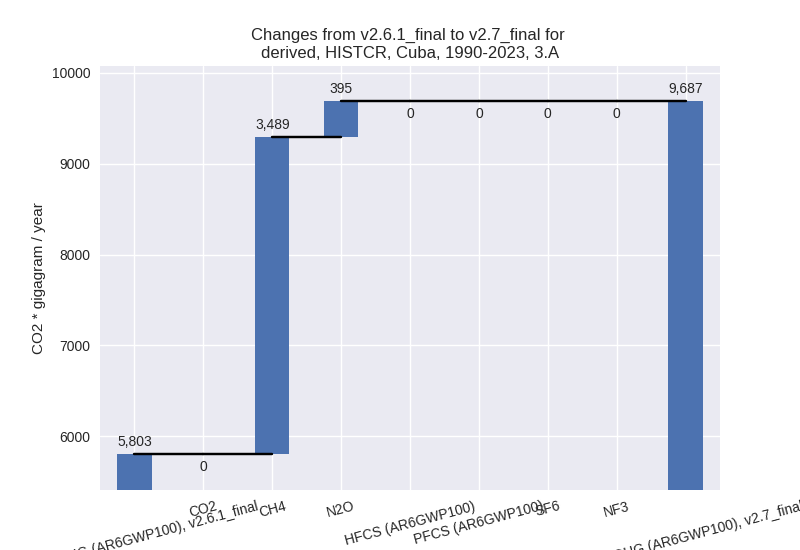
There is no subsector information available in PRIMAP-hist. - M.AG.ELV: Total sectoral emissions in 2022 are
2282.26 Gg CO2 / year which is 21.5% of category M.AG emissions. 2023
Emissions have changed by -16.3%
(-438.69 Gg CO2 / year). 1990-2023 Emissions have changed by 8.0% (254.40 Gg CO2 / year). For 2023 the
changes per gas
are:
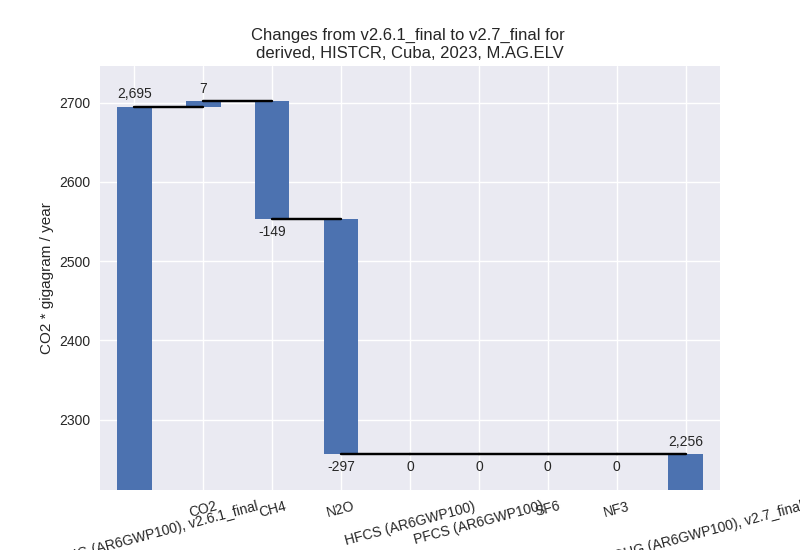
For 1990-2023 the changes per gas are: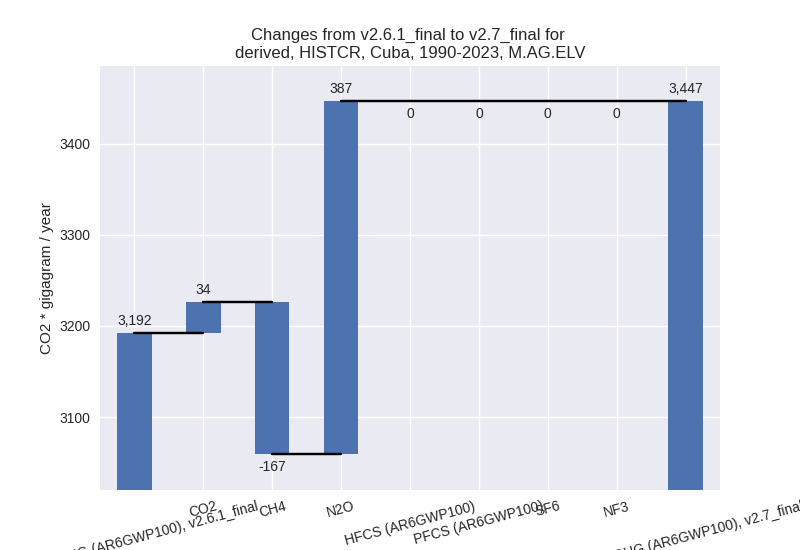
There is no subsector information available in PRIMAP-hist.
- 3.A: Total sectoral emissions in 2022 are 8326.74
Gg CO2 / year which is 78.5% of category M.AG emissions. 2023 Emissions
have changed by 39.9% (2308.27 Gg
CO2 / year). 1990-2023 Emissions have changed by 66.9% (3883.96 Gg CO2 / year). For 2023
the changes per gas
are:
- 4: Total sectoral emissions in 2022 are 6295.80 Gg
CO2 / year which is 12.5% of M.0.EL emissions. 2023 Emissions have
changed by 20.2% (1063.60 Gg CO2 /
year). 1990-2023 Emissions have changed by 37.1% (1457.94 Gg CO2 / year). For 2023
the changes per gas
are:
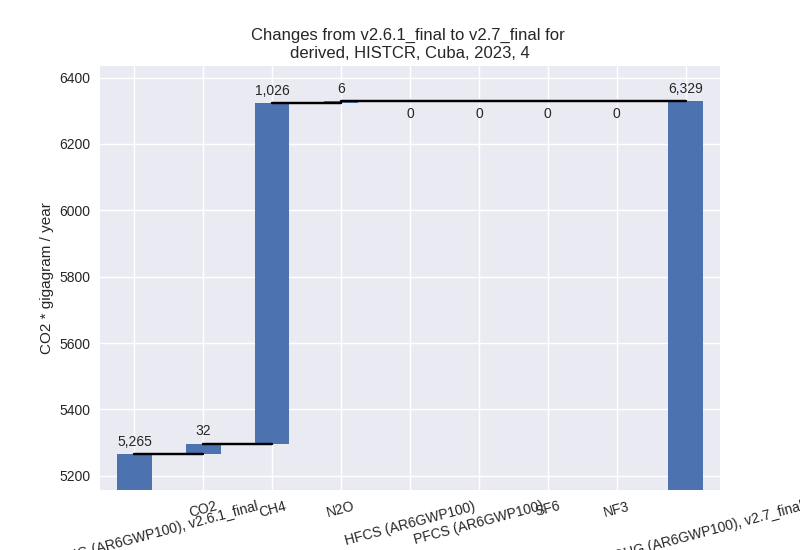
For 1990-2023 the changes per gas are: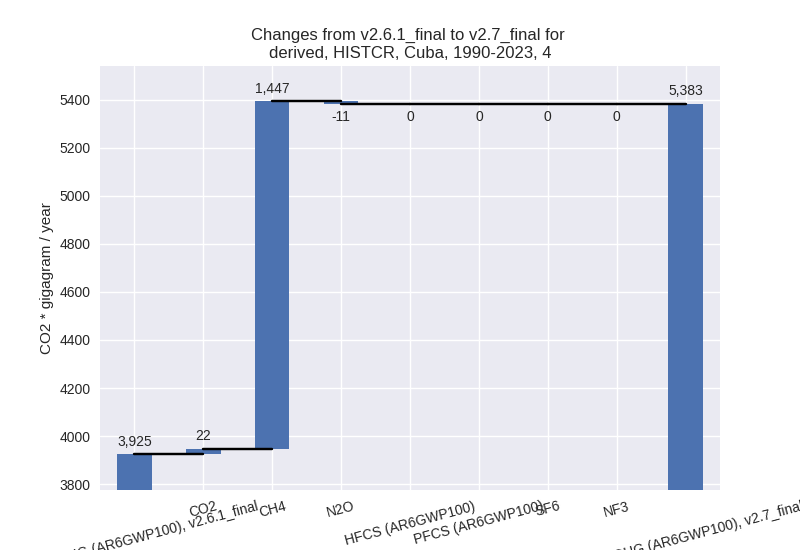
- 5: Total sectoral emissions in 2022 are 0.00 Gg CO2
/ year which is 0.0% of M.0.EL emissions. 2023 Emissions have changed by
-100.0% (-153.69 Gg CO2 / year).
1990-2023 Emissions have changed by -100.0% (-213.33 Gg CO2 / year). For 2023
the changes per gas
are:
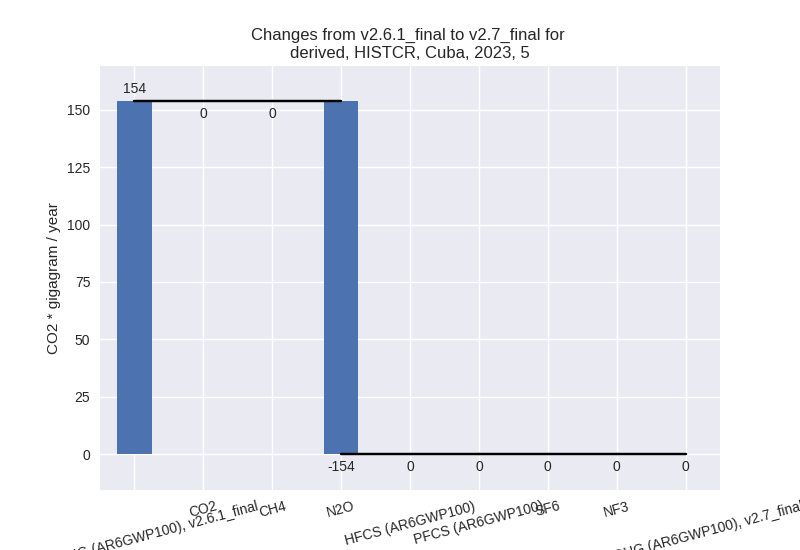
For 1990-2023 the changes per gas are: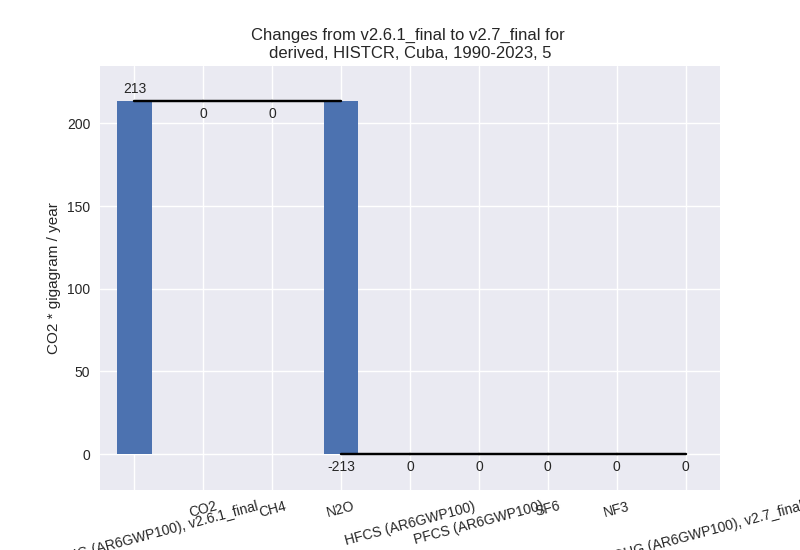
third party scenario (HISTTP):
Most important changes per time frame
For 2023 the following sector-gas combinations have the highest absolute impact on national total KyotoGHG (AR6GWP100) emissions in 2023 (top 5):
- 1: 1.A, CO2 with -564.52 Gg CO2 / year (-2.6%)
- 2: 2, CO2 with 104.60 Gg CO2 / year (24.8%)
- 3: 1.A, CH4 with 0.00 Gg CO2 / year (0.0%)
- 4: 2, HFCS (AR6GWP100) with 0.00 Gg CO2 / year (0.0%)
- 5: 5, N2O with 0.00 Gg CO2 / year (0.0%)
For 1990-2023 the following sector-gas combinations have the highest absolute impact on national total KyotoGHG (AR6GWP100) emissions in 1990-2023 (top 5):
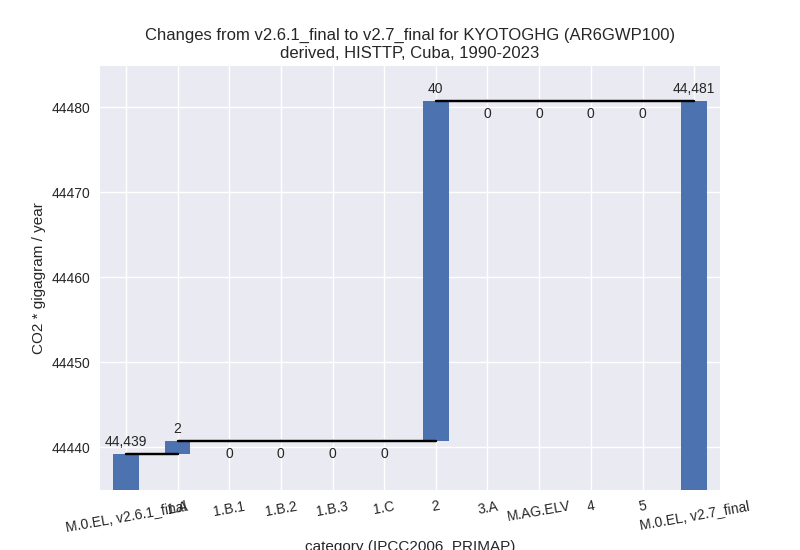
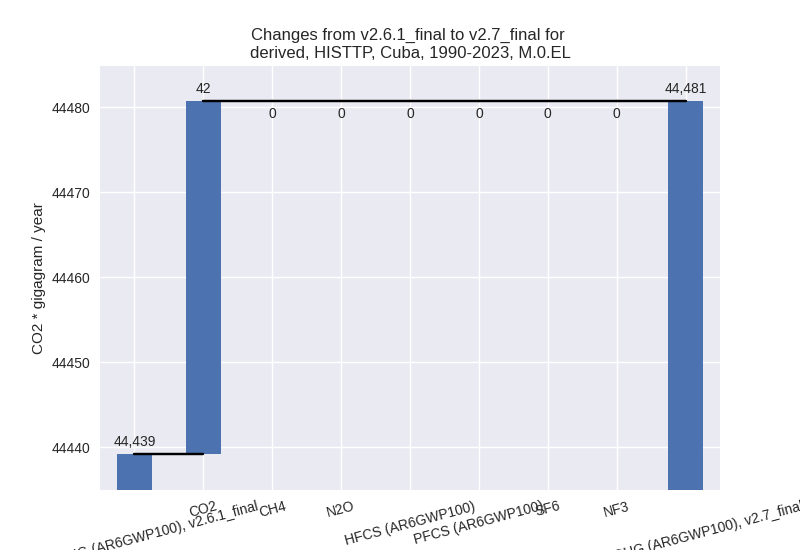
- 1: 2, CO2 with 40.00 Gg CO2 / year (3.6%)
- 2: 1.A, CO2 with 1.54 Gg CO2 / year (0.0%)
- 3: 1.A, CH4 with 0.00 Gg CO2 / year (0.0%)
- 4: 2, HFCS (AR6GWP100) with 0.00 Gg CO2 / year (0.0%)
- 5: 5, N2O with 0.00 Gg CO2 / year (0.0%)
Changes in the main sectors for aggregate KyotoGHG (AR6GWP100) are
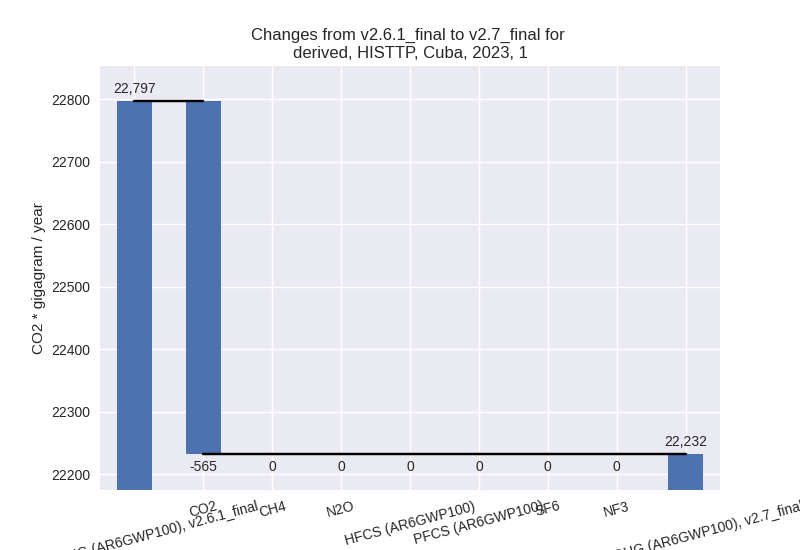
- 1: Total sectoral emissions in 2022 are 21999.37 Gg
CO2 / year which is 58.1% of M.0.EL emissions. 2023 Emissions have
changed by -2.5% (-564.52 Gg CO2 /
year). 1990-2023 Emissions have changed by 0.0% (1.54 Gg CO2 / year). For 2023 the
changes per gas
are:
The changes come from the following subsectors:- 1.A: Total sectoral emissions in 2022 are 21463.51
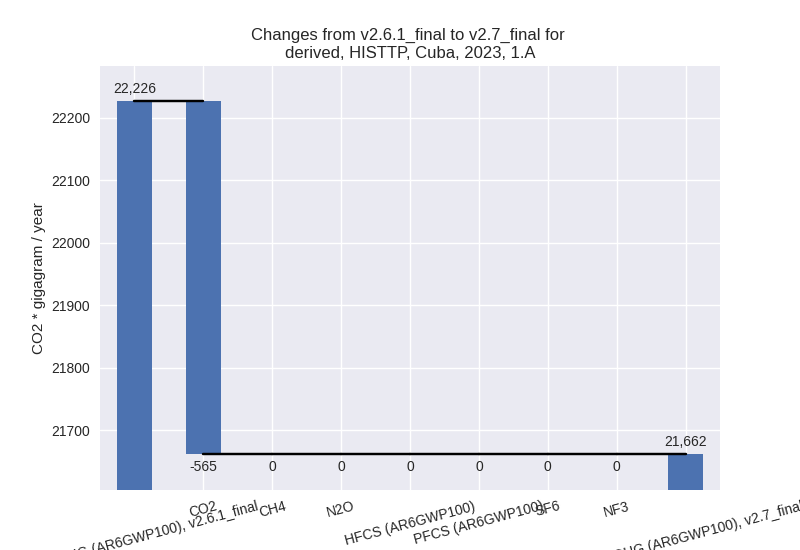
Gg CO2 / year which is 97.6% of category 1 emissions. 2023 Emissions
have changed by -2.5% (-564.52 Gg
CO2 / year). 1990-2023 Emissions have changed by 0.0% (1.54 Gg CO2 / year). For 2023 the
changes per gas
are:
There is no subsector information available in PRIMAP-hist. - 1.B.1: Total sectoral emissions in 2022 are 149.15 Gg CO2 / year which is 0.7% of category 1 emissions. 2023 Emissions have changed by 0.0% (0.00 Gg CO2 / year). 1990-2023 Emissions have changed by 0.0% (0.00 Gg CO2 / year).
- 1.B.2: Total sectoral emissions in 2022 are 386.71 Gg CO2 / year which is 1.8% of category 1 emissions. 2023 Emissions have changed by 0.0% (0.00 Gg CO2 / year). 1990-2023 Emissions have changed by 0.0% (0.00 Gg CO2 / year).
- 1.A: Total sectoral emissions in 2022 are 21463.51
Gg CO2 / year which is 97.6% of category 1 emissions. 2023 Emissions
have changed by -2.5% (-564.52 Gg
CO2 / year). 1990-2023 Emissions have changed by 0.0% (1.54 Gg CO2 / year). For 2023 the
changes per gas
are:
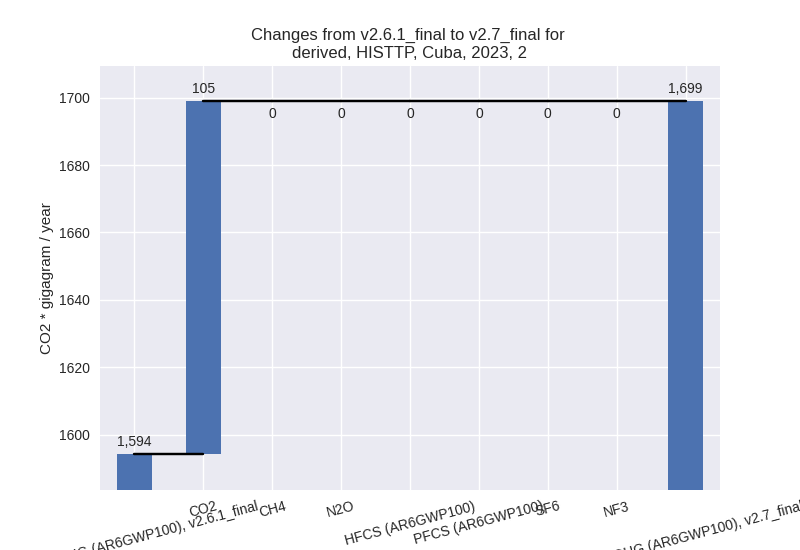
- 2: Total sectoral emissions in 2022 are 1654.83 Gg
CO2 / year which is 4.4% of M.0.EL emissions. 2023 Emissions have
changed by 6.6% (104.60 Gg CO2 /
year). 1990-2023 Emissions have changed by 2.1% (40.00 Gg CO2 / year). For 2023 the
changes per gas
are:
For 1990-2023 the changes per gas are: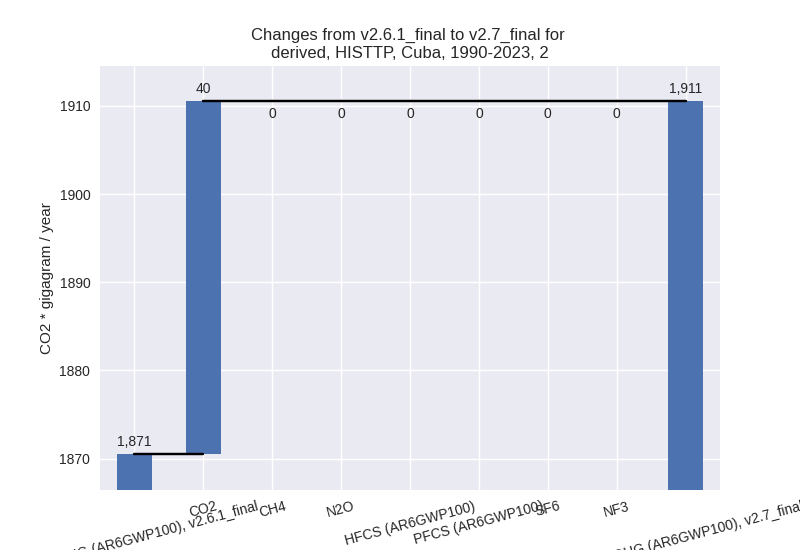
- M.AG: Total sectoral emissions in 2022 are 9493.73 Gg CO2 / year which is 25.1% of M.0.EL emissions. 2023 Emissions have changed by 0.0% (0.00 Gg CO2 / year). 1990-2023 Emissions have changed by 0.0% (0.00 Gg CO2 / year).
- 4: Total sectoral emissions in 2022 are 4555.29 Gg CO2 / year which is 12.0% of M.0.EL emissions. 2023 Emissions have changed by 0.0% (0.00 Gg CO2 / year). 1990-2023 Emissions have changed by 0.0% (0.00 Gg CO2 / year).
- 5: Total sectoral emissions in 2022 are 139.60 Gg CO2 / year which is 0.4% of M.0.EL emissions. 2023 Emissions have changed by 0.0% (0.00 Gg CO2 / year). 1990-2023 Emissions have changed by 0.0% (0.00 Gg CO2 / year).