Changes in PRIMAP-hist v2.7_final compared to v2.6.1_final for India
2025-09-11
Johannes Gütschow
Change analysis for India for PRIMAP-hist v2.7_final compared to v2.6.1_final
Overview over emissions by sector and gas
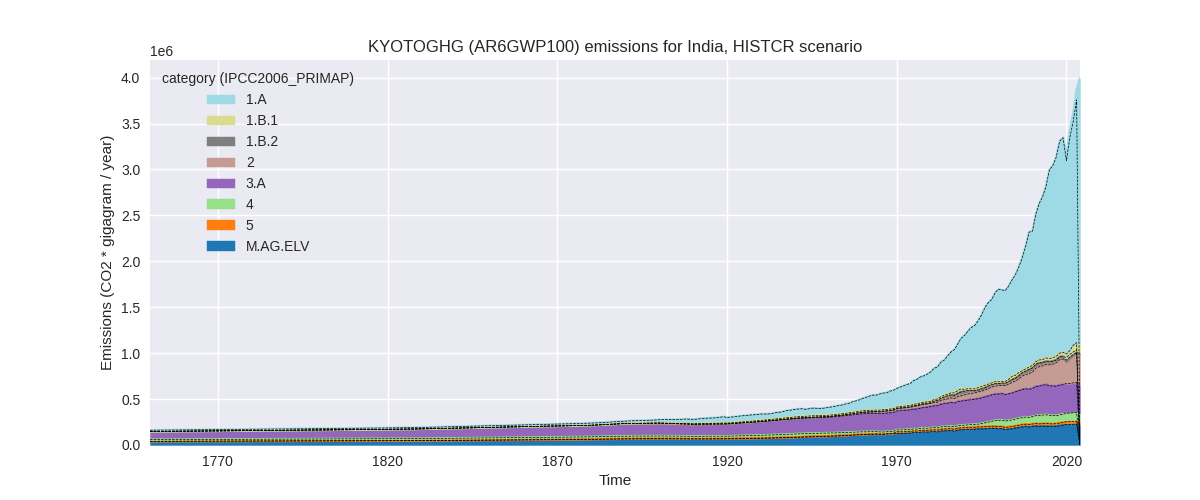
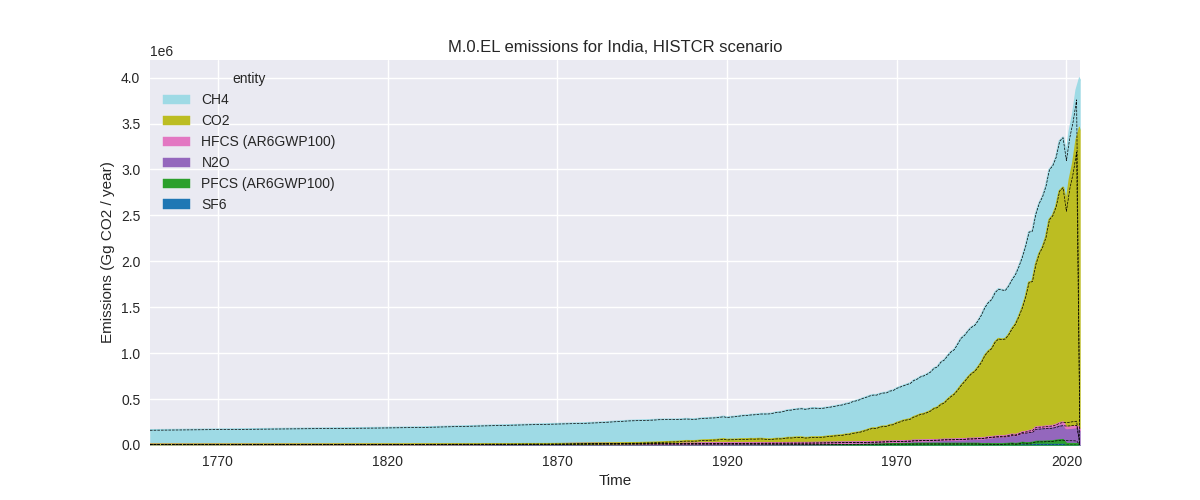
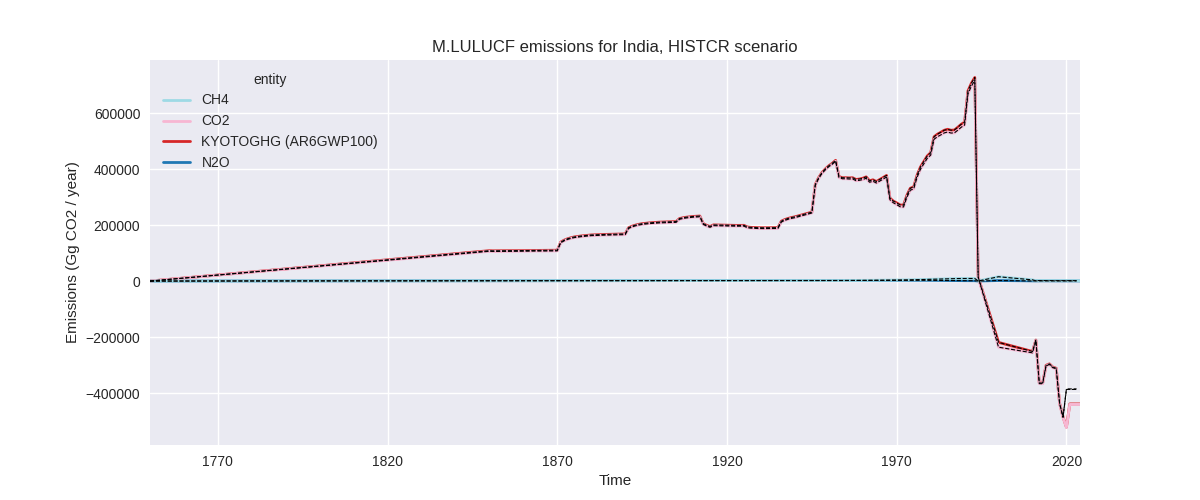
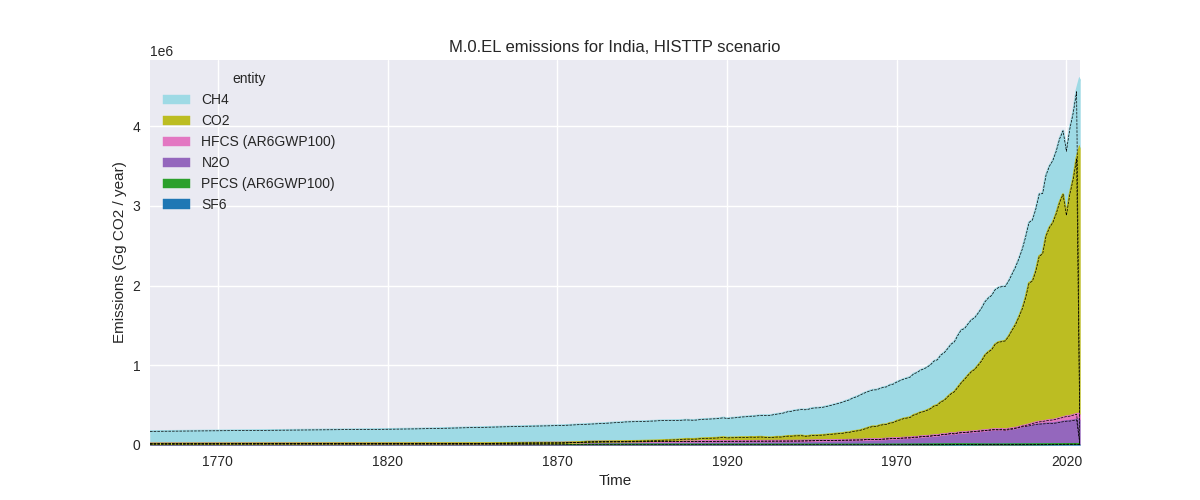
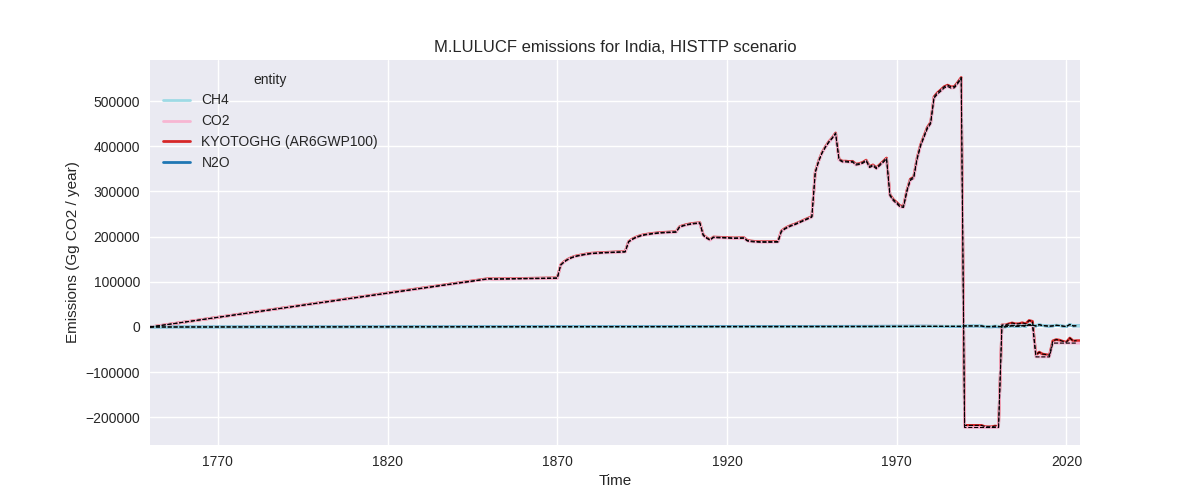
The following figures show the aggregate national total emissions excluding LULUCF AR6GWP100 for the country reported priority scenario. The dotted linesshow the v2.6.1_final data.
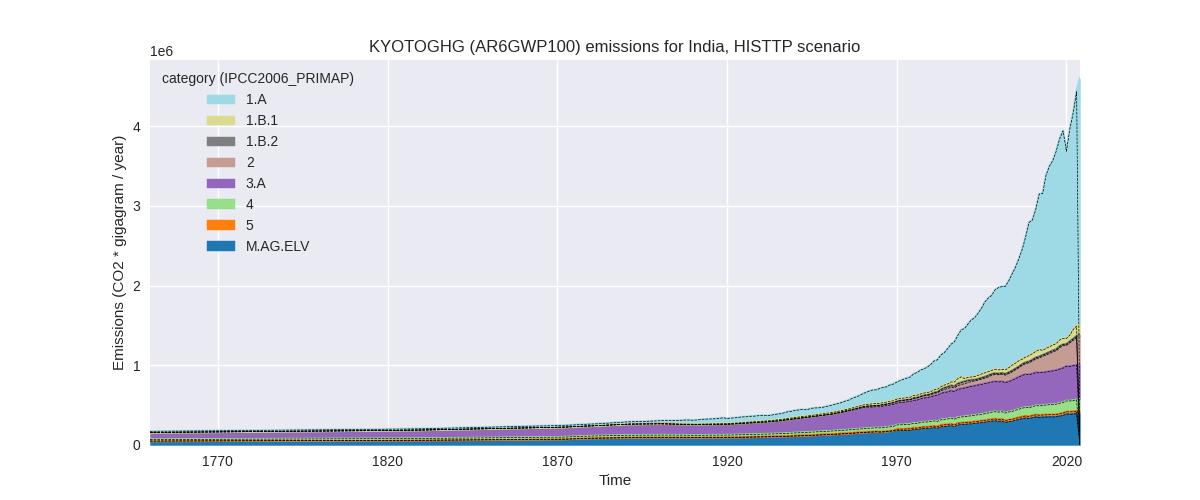
The following figures show the aggregate national total emissions excluding LULUCF AR6GWP100 for the third party priority scenario. The dotted linesshow the v2.6.1_final data.
Overview over changes
In the country reported priority scenario we have the following changes for aggregate Kyoto GHG and national total emissions excluding LULUCF (M.0.EL):
- Emissions in 2023 have changed by 2.8%% (106545.10 Gg CO2 / year)
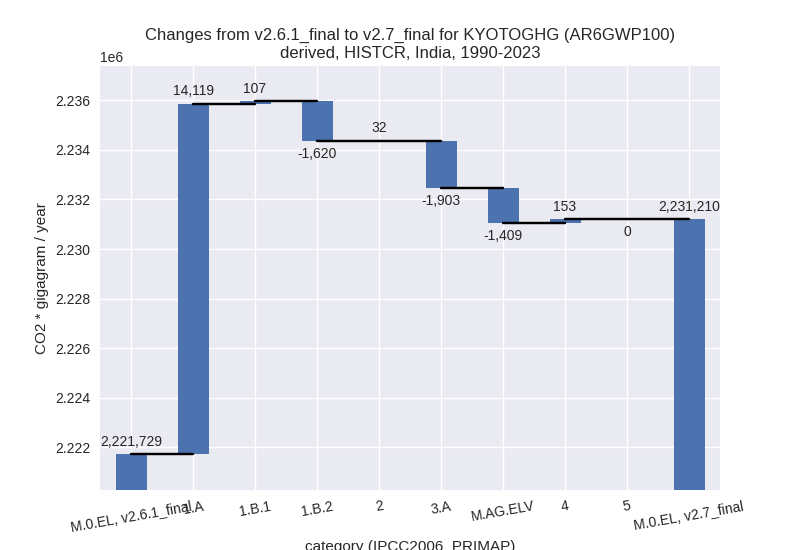
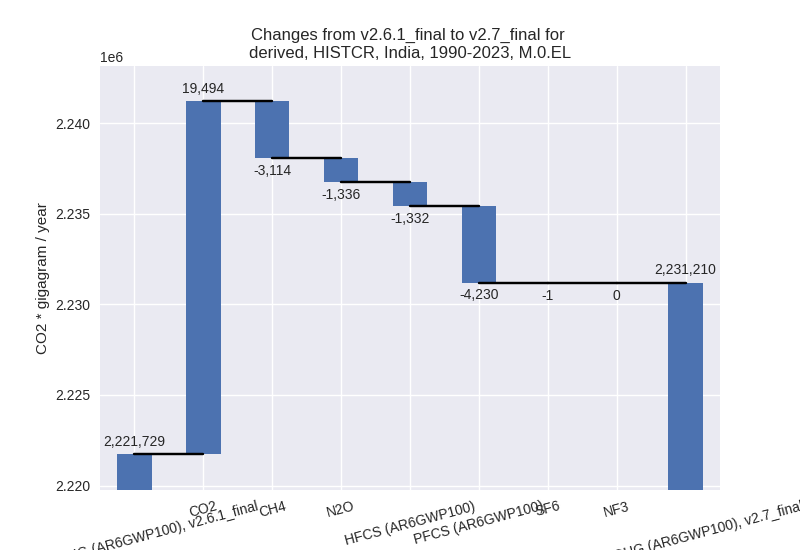
- Emissions in 1990-2023 have changed by 0.4%% (9480.91 Gg CO2 / year)
In the third party priority scenario we have the following changes for aggregate Kyoto GHG and national total emissions excluding LULUCF (M.0.EL):
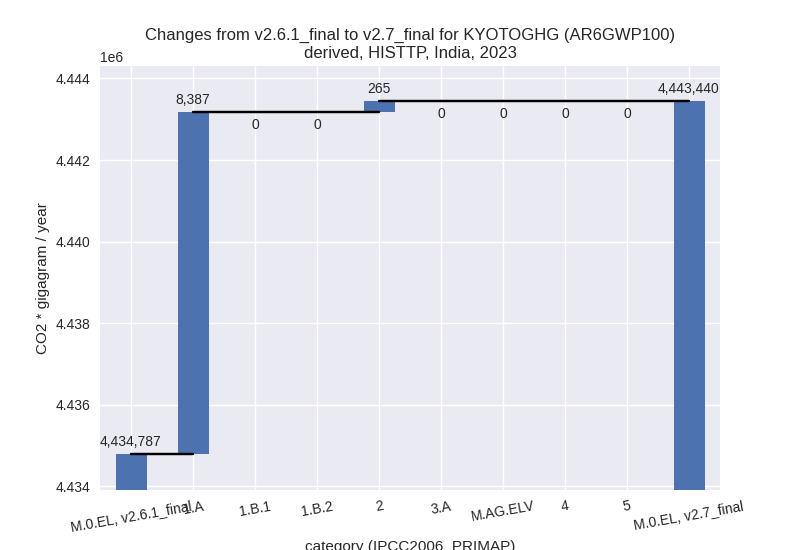
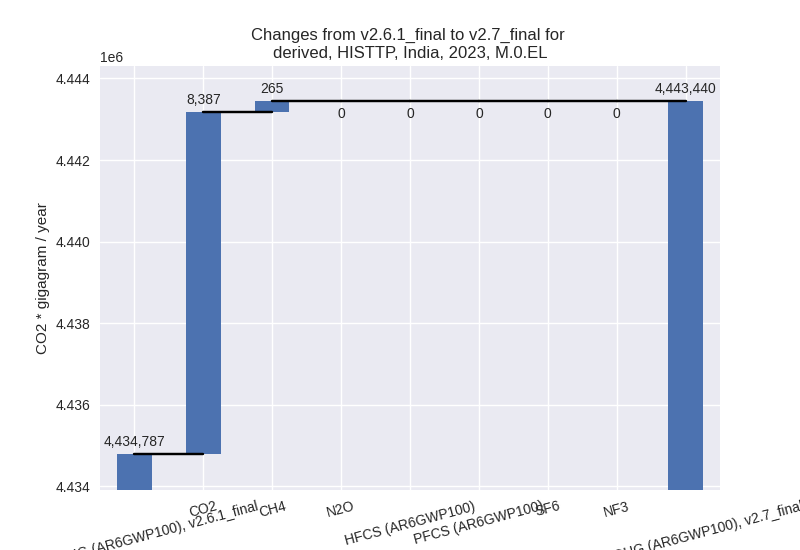
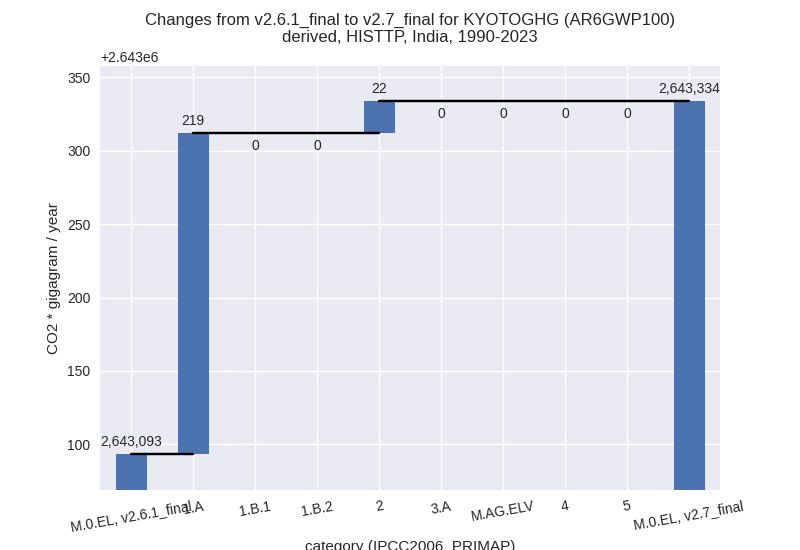
- Emissions in 2023 have changed by 0.2%% (8652.70 Gg CO2 / year)
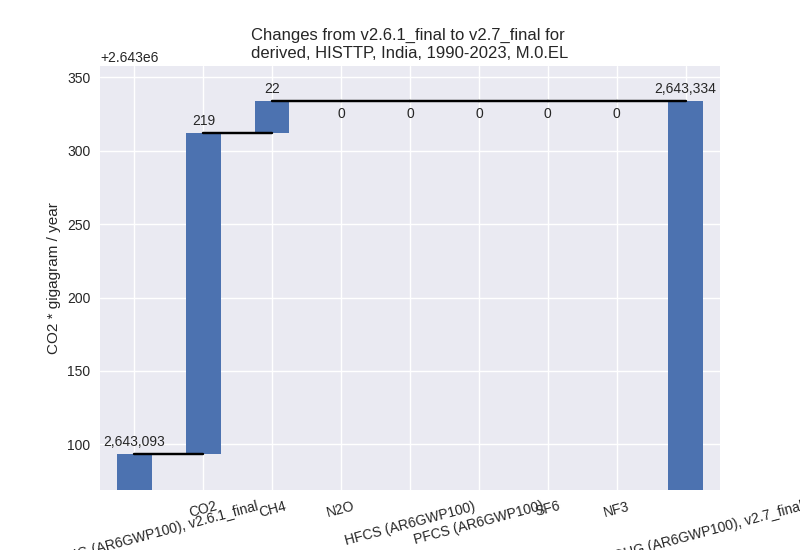
- Emissions in 1990-2023 have changed by 0.0%% (240.32 Gg CO2 / year)
Most important changes per scenario and time frame
In the country reported priority scenario the following sector-gas combinations have the highest absolute impact on national total KyotoGHG (AR6GWP100) emissions in 2023 (top 5):
- 1: 1.A, CO2 with 136211.90 Gg CO2 / year (5.2%)
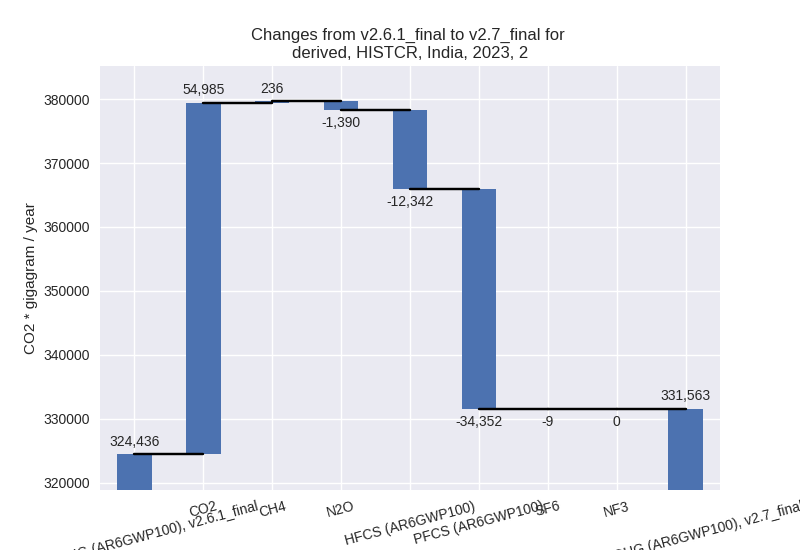
- 2: 2, CO2 with 54984.83 Gg CO2 / year (24.5%)
- 3: 2, PFCS (AR6GWP100) with -34351.97 Gg CO2 / year (-78.6%)
- 4: 1.B.2, CH4 with -14278.49 Gg CO2 / year (-56.0%)
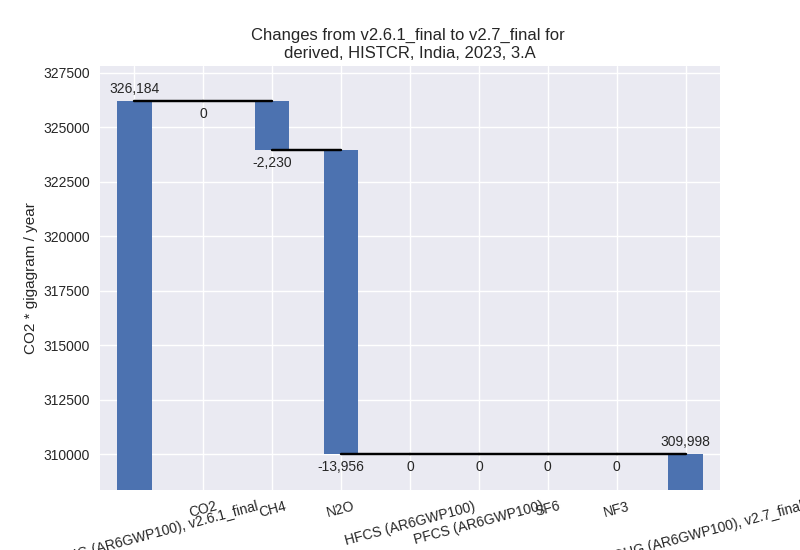
- 5: 3.A, N2O with -13956.28 Gg CO2 / year (-63.2%)
In the country reported priority scenario the following sector-gas combinations have the highest absolute impact on national total KyotoGHG (AR6GWP100) emissions in 1990-2023 (top 5):
- 1: 1.A, CO2 with 13766.40 Gg CO2 / year (1.0%)
- 2: 2, CO2 with 5727.57 Gg CO2 / year (5.0%)
- 3: 2, PFCS (AR6GWP100) with -4230.14 Gg CO2 / year (-18.0%)
- 4: 3.A, N2O with -1641.13 Gg CO2 / year (-19.4%)
- 5: 1.B.2, CH4 with -1619.78 Gg CO2 / year (-6.0%)
In the third party priority scenario the following sector-gas combinations have the highest absolute impact on national total KyotoGHG (AR6GWP100) emissions in 2023 (top 5):
- 1: 1.A, CO2 with 8387.30 Gg CO2 / year (0.3%)
- 2: 2, CH4 with 265.36 Gg CO2 / year (4.1%)
- 3: 1.A, CH4 with 0.00 Gg CO2 / year (0.0%)
- 4: 2, HFCS (AR6GWP100) with 0.00 Gg CO2 / year (0.0%)
- 5: 2, PFCS (AR6GWP100) with 0.00 Gg CO2 / year (0.0%)
In the third party priority scenario the following sector-gas combinations have the highest absolute impact on national total KyotoGHG (AR6GWP100) emissions in 1990-2023 (top 5):
- 1: 1.A, CO2 with 218.64 Gg CO2 / year (0.0%)
- 2: 2, CH4 with 21.68 Gg CO2 / year (1.1%)
- 3: 1.A, CH4 with 0.00 Gg CO2 / year (0.0%)
- 4: 2, HFCS (AR6GWP100) with 0.00 Gg CO2 / year (0.0%)
- 5: 2, PFCS (AR6GWP100) with 0.00 Gg CO2 / year (0.0%)
Notes on data changes
Here we list notes explaining important emissions changes for the country.
- BUR4 data replaces NC3 data for 2011-2018 and adds data for 2020. 2019 is still taken from NC3 as it has more detail and is consistent. 2016 data are taken from DI as they have more detail and are consistent. There are high changes between 2019 and 2020 emissions for some sectors, but
- CO2 from chemical industry is much higher in 2020 because the 2020 data from BUR4 has much higher emissions in the chemical industry sector, especially for Ethylene production and Ammonia production.
- CO2 from metal production (2.C) is much higher in 2020 as well. The main driver is the ferroalloys production. Total emissions from metal production are much lower than for 2019 because the PFC emissions from Aluminum production are much lower.
Changes by sector and gas
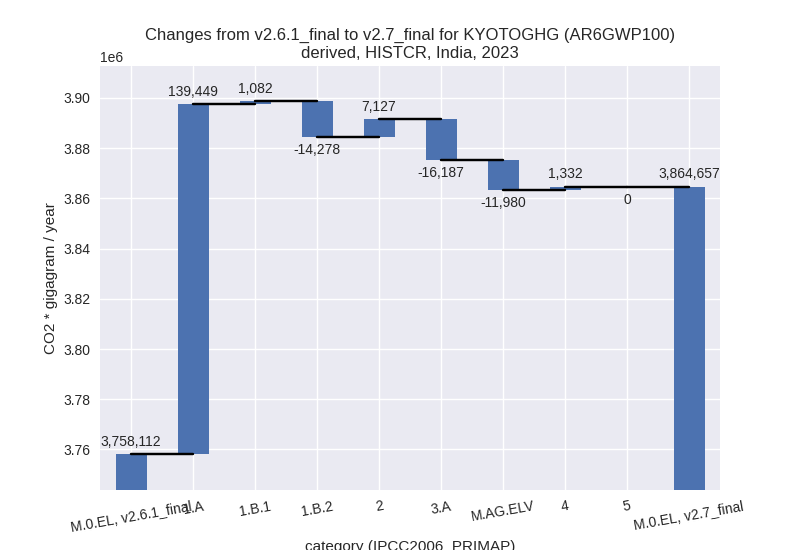
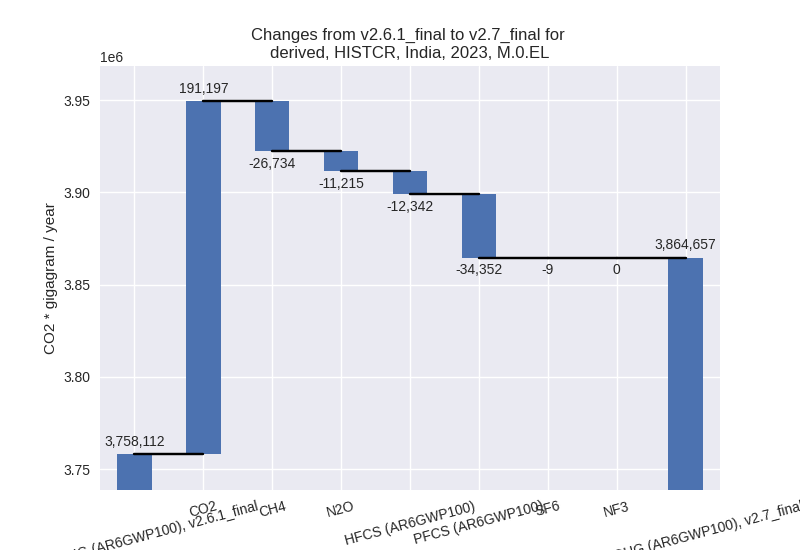
For each scenario and time frame the changes are displayed for all individual sectors and all individual gases. In the sector plot we use aggregate Kyoto GHGs in AR6GWP100. In the gas plot we usenational total emissions without LULUCF.
country reported scenario
2023
1990-2023
third party scenario
2023
1990-2023
Detailed changes for the scenarios:
country reported scenario (HISTCR):
Most important changes per time frame
For 2023 the following sector-gas combinations have the highest absolute impact on national total KyotoGHG (AR6GWP100) emissions in 2023 (top 5):
- 1: 1.A, CO2 with 136211.90 Gg CO2 / year (5.2%)
- 2: 2, CO2 with 54984.83 Gg CO2 / year (24.5%)
- 3: 2, PFCS (AR6GWP100) with -34351.97 Gg CO2 / year (-78.6%)
- 4: 1.B.2, CH4 with -14278.49 Gg CO2 / year (-56.0%)
- 5: 3.A, N2O with -13956.28 Gg CO2 / year (-63.2%)
For 1990-2023 the following sector-gas combinations have the highest absolute impact on national total KyotoGHG (AR6GWP100) emissions in 1990-2023 (top 5):
- 1: 1.A, CO2 with 13766.40 Gg CO2 / year (1.0%)
- 2: 2, CO2 with 5727.57 Gg CO2 / year (5.0%)
- 3: 2, PFCS (AR6GWP100) with -4230.14 Gg CO2 / year (-18.0%)
- 4: 3.A, N2O with -1641.13 Gg CO2 / year (-19.4%)
- 5: 1.B.2, CH4 with -1619.78 Gg CO2 / year (-6.0%)
Changes in the main sectors for aggregate KyotoGHG (AR6GWP100) are
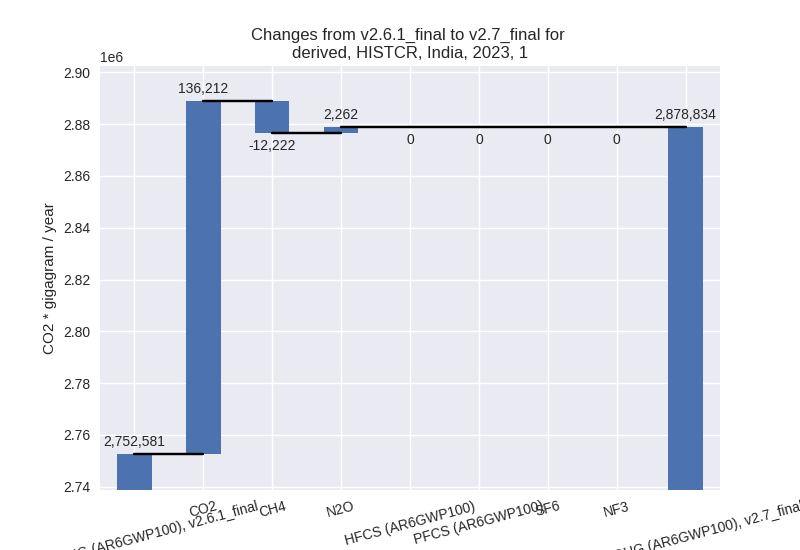
- 1: Total sectoral emissions in 2022 are 2646025.80
Gg CO2 / year which is 73.4% of M.0.EL emissions. 2023 Emissions have
changed by 4.6% (126252.70 Gg CO2 /
year). 1990-2023 Emissions have changed by 0.9% (12607.09 Gg CO2 / year). For 2023
the changes per gas
are:
The changes come from the following subsectors:- 1.A: Total sectoral emissions in 2022 are
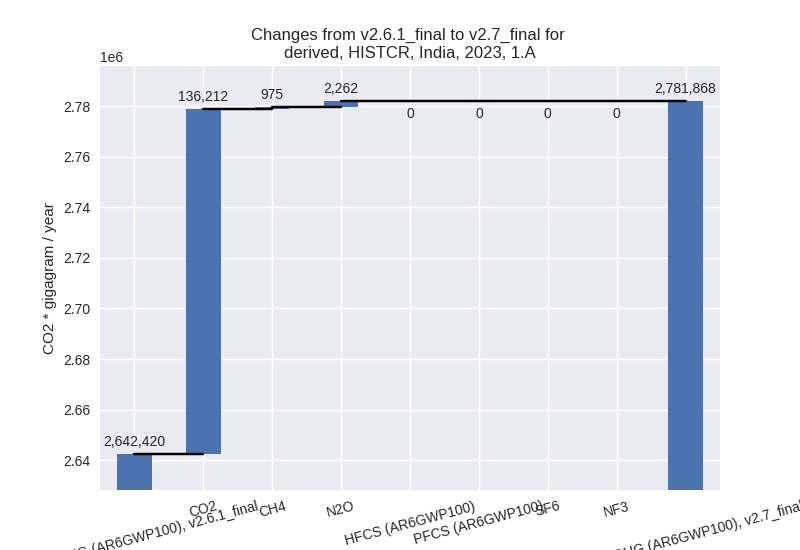
2557388.00 Gg CO2 / year which is 96.7% of category 1 emissions. 2023
Emissions have changed by 5.3%
(139448.90 Gg CO2 / year). 1990-2023 Emissions have changed by 1.0% (14119.38 Gg CO2 / year). For 2023
the changes per gas
are:
There is no subsector information available in PRIMAP-hist. - 1.B.1: Total sectoral emissions in 2022 are 73561.60 Gg CO2 / year which is 2.8% of category 1 emissions. 2023 Emissions have changed by 1.3% (1082.22 Gg CO2 / year). 1990-2023 Emissions have changed by 0.3% (107.48 Gg CO2 / year).
- 1.B.2: Total sectoral emissions in 2022 are
15076.21 Gg CO2 / year which is 0.6% of category 1 emissions. 2023
Emissions have changed by -48.2%
(-14278.49 Gg CO2 / year). 1990-2023 Emissions have changed by -5.2% (-1619.78 Gg CO2 / year). For 2023
the changes per gas
are:
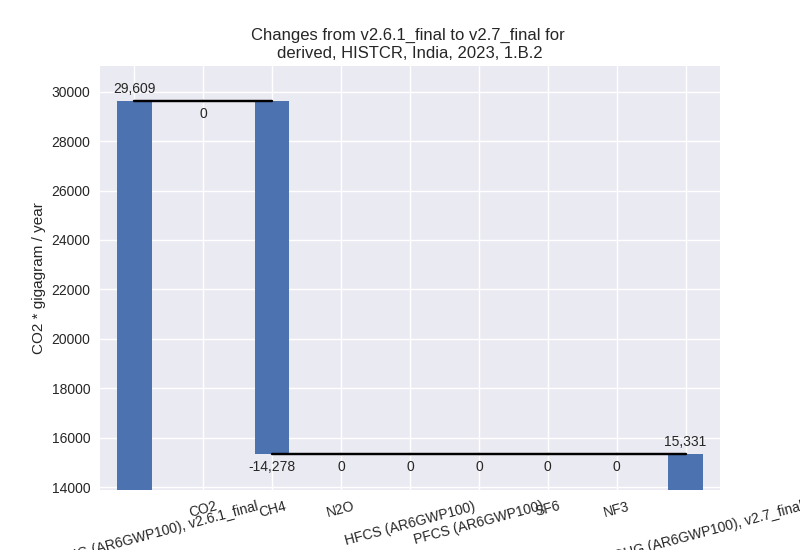
For 1990-2023 the changes per gas are: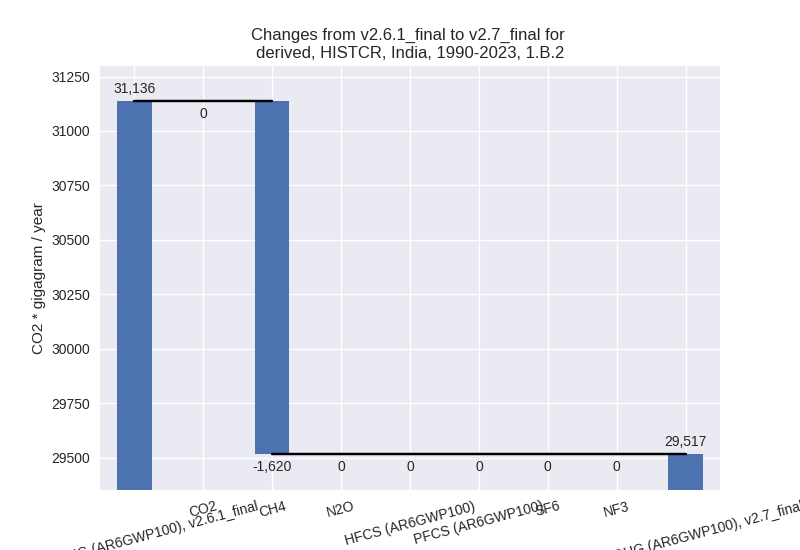
There is no subsector information available in PRIMAP-hist.
- 1.A: Total sectoral emissions in 2022 are
2557388.00 Gg CO2 / year which is 96.7% of category 1 emissions. 2023
Emissions have changed by 5.3%
(139448.90 Gg CO2 / year). 1990-2023 Emissions have changed by 1.0% (14119.38 Gg CO2 / year). For 2023
the changes per gas
are:
- 2: Total sectoral emissions in 2022 are 310356.44
Gg CO2 / year which is 8.6% of M.0.EL emissions. 2023 Emissions have
changed by 2.2% (7127.29 Gg CO2 /
year). 1990-2023 Emissions have changed by 0.0% (32.02 Gg CO2 / year). For 2023 the
changes per gas
are:
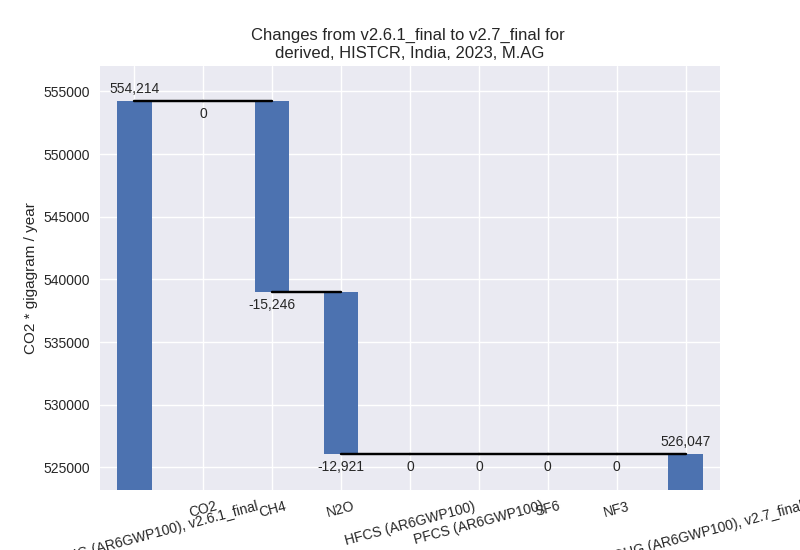
- M.AG: Total sectoral emissions in 2022 are
523459.04 Gg CO2 / year which is 14.5% of M.0.EL emissions. 2023
Emissions have changed by -5.1%
(-28167.04 Gg CO2 / year). 1990-2023 Emissions have changed by -0.7% (-3311.38 Gg CO2 / year). For 2023
the changes per gas
are:
The changes come from the following subsectors:- 3.A: Total sectoral emissions in 2022 are 309382.89
Gg CO2 / year which is 59.1% of category M.AG emissions. 2023 Emissions
have changed by -5.0% (-16186.60 Gg
CO2 / year). 1990-2023 Emissions have changed by -0.6% (-1902.78 Gg CO2 / year). For 2023
the changes per gas
are:
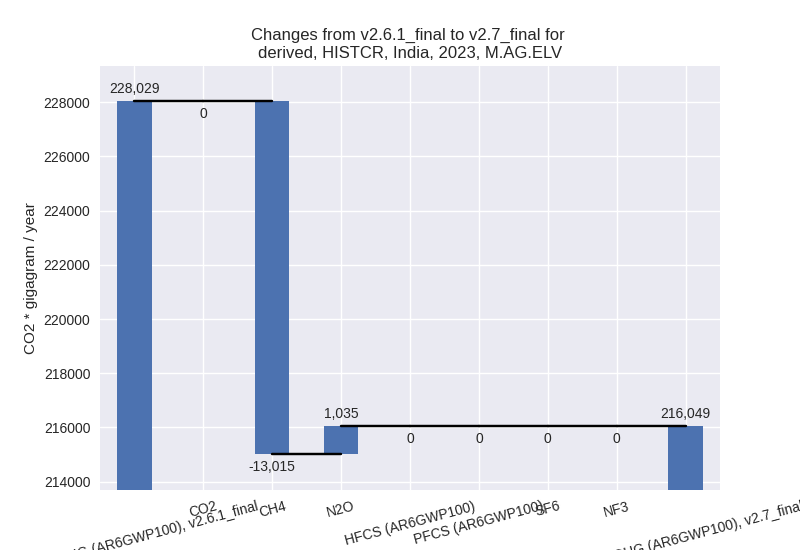
There is no subsector information available in PRIMAP-hist. - M.AG.ELV: Total sectoral emissions in 2022 are
214076.15 Gg CO2 / year which is 40.9% of category M.AG emissions. 2023
Emissions have changed by -5.3%
(-11980.44 Gg CO2 / year). 1990-2023 Emissions have changed by -0.7% (-1408.61 Gg CO2 / year). For 2023
the changes per gas
are:
There is no subsector information available in PRIMAP-hist.
- 3.A: Total sectoral emissions in 2022 are 309382.89
Gg CO2 / year which is 59.1% of category M.AG emissions. 2023 Emissions
have changed by -5.0% (-16186.60 Gg
CO2 / year). 1990-2023 Emissions have changed by -0.6% (-1902.78 Gg CO2 / year). For 2023
the changes per gas
are:
- 4: Total sectoral emissions in 2022 are 94079.94 Gg CO2 / year which is 2.6% of M.0.EL emissions. 2023 Emissions have changed by 1.4% (1332.25 Gg CO2 / year). 1990-2023 Emissions have changed by 0.2% (153.19 Gg CO2 / year).
- 5: Total sectoral emissions in 2022 are 31563.11 Gg CO2 / year which is 0.9% of M.0.EL emissions. 2023 Emissions have changed by 0.0% (0.00 Gg CO2 / year). 1990-2023 Emissions have changed by 0.0% (0.00 Gg CO2 / year).
third party scenario (HISTTP):
Most important changes per time frame
For 2023 the following sector-gas combinations have the highest absolute impact on national total KyotoGHG (AR6GWP100) emissions in 2023 (top 5):
- 1: 1.A, CO2 with 8387.30 Gg CO2 / year (0.3%)
- 2: 2, CH4 with 265.36 Gg CO2 / year (4.1%)
- 3: 1.A, CH4 with 0.00 Gg CO2 / year (0.0%)
- 4: 2, HFCS (AR6GWP100) with 0.00 Gg CO2 / year (0.0%)
- 5: 2, PFCS (AR6GWP100) with 0.00 Gg CO2 / year (0.0%)
For 1990-2023 the following sector-gas combinations have the highest absolute impact on national total KyotoGHG (AR6GWP100) emissions in 1990-2023 (top 5):
- 1: 1.A, CO2 with 218.64 Gg CO2 / year (0.0%)
- 2: 2, CH4 with 21.68 Gg CO2 / year (1.1%)
- 3: 1.A, CH4 with 0.00 Gg CO2 / year (0.0%)
- 4: 2, HFCS (AR6GWP100) with 0.00 Gg CO2 / year (0.0%)
- 5: 2, PFCS (AR6GWP100) with 0.00 Gg CO2 / year (0.0%)
Changes in the main sectors for aggregate KyotoGHG (AR6GWP100) are
- 1: Total sectoral emissions in 2022 are 2847794.30 Gg CO2 / year which is 68.4% of M.0.EL emissions. 2023 Emissions have changed by 0.3% (8387.30 Gg CO2 / year). 1990-2023 Emissions have changed by 0.0% (218.63 Gg CO2 / year).
- 2: Total sectoral emissions in 2022 are 322860.44 Gg CO2 / year which is 7.8% of M.0.EL emissions. 2023 Emissions have changed by 0.1% (265.36 Gg CO2 / year). 1990-2023 Emissions have changed by 0.0% (21.68 Gg CO2 / year).
- M.AG: Total sectoral emissions in 2022 are 824125.75 Gg CO2 / year which is 19.8% of M.0.EL emissions. 2023 Emissions have changed by 0.0% (0.00 Gg CO2 / year). 1990-2023 Emissions have changed by 0.0% (0.00 Gg CO2 / year).
- 4: Total sectoral emissions in 2022 are 138788.97 Gg CO2 / year which is 3.3% of M.0.EL emissions. 2023 Emissions have changed by 0.0% (0.00 Gg CO2 / year). 1990-2023 Emissions have changed by 0.0% (0.00 Gg CO2 / year).
- 5: Total sectoral emissions in 2022 are 31563.11 Gg CO2 / year which is 0.8% of M.0.EL emissions. 2023 Emissions have changed by 0.0% (0.00 Gg CO2 / year). 1990-2023 Emissions have changed by 0.0% (0.00 Gg CO2 / year).